Introduction
Cancer progression involves multiple pathways and
steps leading to cell growth and proliferation. New therapeutic
strategies targeting cell growth and proliferation include several
AKT inhibitors, even though little knowledge of their effects in
different cell-types or on the genome exists (1). In order to predict their effects, as
well as possible side-effects, it is important to understand how
AKT, particularly the different AKT isoforms, take part in the
different cellular pathways.
AKT is the central protein of a major cell signaling
system involved in cell survival, metastasis, drug resistance,
metabolism and radiation resistance (2). While inhibition of AKT can result in
inhibition of important pathways for cell-survival, it may also
lead to stimulation of other downstream proteins such as receptor
tyrosine kinases (e.g. HER3, IGF-1R and insulin receptor), enabling
the cancer cells to survive (3).
There are three AKT isoforms, AKT1, AKT2 and AKT3, which have high
homology but are expressed from three separate genes. Their
expression is tissue-dependent and they are believed to have
different functions. Knockout mouse studies have shown AKT1 to be
essential for cell survival, AKT2 to have a more prevalent role in
glucose homeostasis, while AKT3 is believed to be involved in brain
development (4). Overexpression of
the different AKT isoforms has been seen in several types of
cancer. An elevated expression of AKT1 has been observed in GIST,
thyroid and breast cancer, whereas high AKT2 expression has been
seen in glioma, colorectal, hepatocellular, ovarian and pancreatic
cancer, and AKT3 overexpression has been observed in breast and
prostate cancer (2,5). In several studies, AKT signaling is
associated with enhanced cell motility and invasion (6). However, recent in-depth studies on
the AKT isoforms using siRNA, isoform specific inhibitors, AKT
isoform expressing vectors and AKT isoform gene knockouts, have
shown that AKT1 and AKT2 might play different roles in this pathway
depending on the cell type (6).
Cancer cells generally grow faster than normal cells
and often display an increase in glucose uptake and lactate
production (7). AKT plays a role
in cellular metabolism through its association with glucose uptake
via the glucose transporters (GLUT), as well as the conversion of
stored glycogen back to glucose. There are several studies showing
that AKT1 and AKT2 have different roles in glucose homeostasis
(8). AKT2 silencing in mice
was shown to cause an impaired glucose uptake by fat and muscle
cells (9). Furthermore, in
vitro studies have demonstrated that AKT2 silencing
causes inhibition of insulin induced GLUT4 translocation to the
plasma membrane. GLUT4 promotes an increase of glucose in the cells
when situated in the plasma membrane (10). It has also been proposed that
glycolysis can result in formation of pyruvate and NADPH, which can
reduce reactive oxygen species and thereby reduces oxidative stress
(11).
Only a few studies have evaluated the effects of the
different AKT isoforms in colorectal cancer. We have previously
shown that both AKT1 and AKT2 interact with the DNA-repair protein
DNA-PKcs and that disruption of these increases radiation
sensitivity and influences the expression of cancer stem cell
markers CD44 and CD133 (12,13).
While the focus of previous studies has been on a few specific
pathways, the present study aimed to perform a genome wide
expression profile in AKT isoform knockout colon cancer
cells. Additionally, metabolomic and cell migration studies could
further elucidate the function of the AKT isoforms in colorectal
cancer. This may help to improve treatment by assessing new targets
for combination therapy or finding biomarkers for prediction of
treatment response.
Materials and methods
Cell culture
The colon cancer isogenic DLD-1 X-MAN™ cell lines
were obtained from Horizon Discovery Ltd., (Cambridge, UK) with the
different AKT isoforms genetically knocked out, cat. no.
HD-R00-001, HD-R00-002 and HD-R00-003. The cells were cultured in
75-cm2 culture flasks (Nunclon surface; Nunc, Roskilde,
Denmark) in McCoy's 5A medium (Flow Laboratories, Irvine, UK) with
10% fetal bovine serum (FBS; Sigma-Aldrich, St. Louis, MO, USA), 2
mM L-glutamine, 100 IU/ml penicillin and 10 µg/ml
streptomycin (Biochrom GmbH, Berlin, Germany). The cells were
cultured in a humidified incubator with 5% CO2 at 37°C
and trypsinized with trypsin-EDTA, 0.25% trypsin, 0.02% EDTA
(Biochrom GmbH).
Microarray expression analysis
Two separate passages of DLD-1 parental, AKT1
KO, AKT2 KO and AKT1/2 KO cells were cultured to 70%
confluence and RNA was extracted (RNeasy MiniPrep; Qiagen,
Valencia, CA, USA). The RNA concentration was measured with ND-1000
spectrophotometer (NanoDrop Technologies, Wilmington, DE, USA) and
RNA quality was evaluated using the Agilent 2100 Bioanalyzer system
(Agilent Technologies, Inc., Palo Alto, CA, USA). A total of 250 ng
of total RNA from each sample was used to generate amplified and
biotinylated sense-strand cDNA from the entire expressed genome
according to the GeneChip® WT PLUS reagent kit user
manual (P/N 703174 Rev.1; Affymetrix, Inc., Santa Clara, CA, USA).
GeneChip® HTA arrays (GeneChip® Human
Transcriptome array 2.0) were hybridized for 16 h in a 45°C
incubator, rotated at 60 rpm. According to the GeneChip®
expression, Wash, Stain and Scan Manual (P/N 702731 Rev.3;
Affymetrix) the arrays were then washed and stained using the
Fluidics Station 450 and finally scanned using the
GeneChip® Scanner 3000 7G.
Microarray data analysis
The raw data was normalized in the free software
Expression Console provided by Affymetrix (http://www.affymetrix.com) using the robust
multi-array average (RMA) method first suggested by Li and Wong in
2001 (14). Subsequent analysis of
the gene expression data was carried out in the freely available
statistical computing language R (http://www.r-project.org) using packages available
from the Bioconductor project (www.bioconductor.org). In order to search for the
differentially expressed genes between parental and the AKT
KO, an empirical Bayes moderated t-test was applied, using the
'limma' package (15). To address
the problem with multiple testing, P-values were adjusted using the
method of Benjamini and Hochberg (16).
Pathway analysis
DAVID Bioinformatic resources 6.7 software was used
to functionally classify and cluster the genes with an altered
expression and identify the most significantly altered pathways,
networks and metabolism processes that the genes were involved in.
Only genes with a 1.5-fold change and with a P<0.05 were used in
the evaluation. To rank and calculate P-values for the different
pathways and processes normalized data from all four cell lines was
compared. The P-value represents the probability for a particular
mapping of an experiment to a process arisen by chance, considering
the number of genes in the experiment versus the number of genes in
the map process.
Scratch wound migration assay
In this study, DLD-1 isogenic AKT1,
AKT2 and AKT1/2 knockout colon cancer cell lines were
used as a model system together with the parental cell line in
order to further elucidate the differences between the AKT isoforms
and how they are involved in various cellular pathways. Many of
these pathways are thought to be involved in cellular migration.
Thus, the migratory activity of isogenic AKT1, AKT2
and AKT1/2 knockout colon cancer cell lines were studied
together with the parental cells, using the scratch wound migration
assay (17). The migration rate
was monitored at two different settings, complete medium and after
starvation plus addition of EGF. DLD-1 parental and AKT
knockout cells were seeded in 6-well plates in McCoy's 5A medium
(Flow Laboratories). After 24 h the cells were washed three times
with 2% FBS/McCoy's medium and incubated in starvation medium, 2%
FBS/McCoy's, for another 24 h. The cells were wounded with a
sterile plastic pipette and rinsed three times to remove cellular
debris. Subsequently, complete medium, 10% FBS/McCoy's, plus 15 ng
human recombinant EGF (Chemicon) was added. Migration was monitored
using a Nikon 700D digital camera mounted on an inverted microscope
at time 0–24 h after wounding and analyzed using ImageJ software.
Statistical analyses were performed using GraphPad Prism version 6
for Windows (GraphPad Software, Inc., La Jolla, CA, USA). The
differences in uptake between the AKT KO cell lines compared
to the parental cell line were evaluated using two-way ANOVA with
multiple comparison test and were considered statistically
significant at P<0.05.
Cell harvesting for metabolic
profiling
Cells were cultured in 12-cm petri dishes and
harvested at ~75% confluence. All cell sample harvesting was
performed on ice. Growth medium was removed and cells were rapidly
washed three times with cold Dulbecco's phosphate-buffered saline
(PBS; Nordic Biolabs AB, Täby, Sweden) followed by detachment of
cells using a rubber-tipped cell scraper (Sarstedt). The detached
cells were collected in cold Milli-Q water (3.5 ml), transferred to
polypropylene tubes and snap-frozen in liquid N2
followed by thawing at 37°C for 10 min. The freeze-thaw cycle was
then repeated once with subsequent sonication on ice for 30 sec.
Protein concentrations were measured in duplicates using the
spectrophotometric assay with Bradford reagent (Sigma-Aldrich) and
using bovine serum albumin (BSA; Sigma-Aldrich) for reference
samples, all according to the manufacturer's instructions. Samples
were stored at −80°C until metabolite extraction. For each of the
four cell lines, three technical replicates were harvested.
Extraction of polar metabolites
Quenched cells were thawed at room temperature and
subjected to centrifugation (10 min, 2200 RCF) to remove
precipitated cellular debris. The supernatant of the cell extracts
was transferred to a fresh extraction tube, followed by addition of
chloroform and methanol in the proportions 4:4:2.85
(MeOH:CHCl3:H2O). The resulting two-phase
system was gently mixed and left at 4°C for 30 min prior to
centrifugation (2200 RCF, 20 min, 4°C). A fixed volume of the
aqueous phase was transferred to a new tube and evaporated under
N2 at 40°C until dry. The polar phase was subsequently
reconstituted in 0.7 ml phosphate-buffered D2O (150 mM,
pD 7) containing 2,2-dimethyl-2-silapentane-5-sulfonate sodium salt
(DSS; 34 µM) as a chemical shift reference. For the
analysis, one pooled quality control (QC) sample was also created
by pooling an equal volume of cell extracts prior to metabolite
extraction.
Metabolic profiling using NMR
spectroscopy
NMR measurements were carried out at 298 K on a
Bruker Avance 600 MHz (Bruker BioSpin GmbH, Rheinstetten, Germany)
equipped with a cryoprobe. For each sample, the 1D NOESYPR1D
standard pulse sequence
(−RD-90°-t1-90°-tm-90°-ACQ) was used. Each
pulse had a 90° pulse length; the total amount of FIDs recorded
were 256 collected into 64 K data points which was zero-filled to
128 K data points. The spectra width was set to 7183.91 Hz giving a
spectral acquisition time of 4.56 sec. The t1 and
tm was set to 6 µsec, respectively, 180 msec and
relaxation delay (D1) was 3 sec, resulting in a total acquisition
time of 33 min. The 1D spectra were manually phased and baseline
corrected and the 1H chemical shifts were referenced to
added DSS using the ACD/Labs (version 12.01; Advanced Chemistry
Development, Inc., Toronto, ON, Canada). Each 1H NMR
spectrum, within a range of 0–10 ppm, was reduced to 873 bins of
fixed width (0.01 ppm) excluding resonance regions for water
(δ5.15–4.67) and the internal standard (DSS, δ0.00–0.65, 1.77–1.72
and 2.92–2.88). The signal intensity in each bin was integrated and
data were imported, normalized to unit total intensity in Microsoft
Excel (Microsoft Office 2007; Microsoft, Redmond, CA, USA).
Assignments of NMR peaks were performed according to the
metabolomics standards initiative (MSI) (18) by comparing with the Human
Metabolome Database (v2.5) (19).
The metabolites identified should be seen as putatively annotated
compounds according to the MSI nomenclature.
Multivariate data analysis of metabolic
profiling data
Multivariate data analysis was conducted in SIMCA-P+
(version 13.0; MKS Umetrics AB, Umeå, Sweden) computational
software package. Data were Pareto scaling, as implemented in the
SIMCA-P+ package, prior to further analysis. Unsupervised principal
component analysis (PCA) and supervised orthogonal projection to
latent structures discriminant analysis (OPLS-DA) was used for
identification of key differences between parental cell lines and
AKT KO cell lines (20).
Results
Gene expression assay
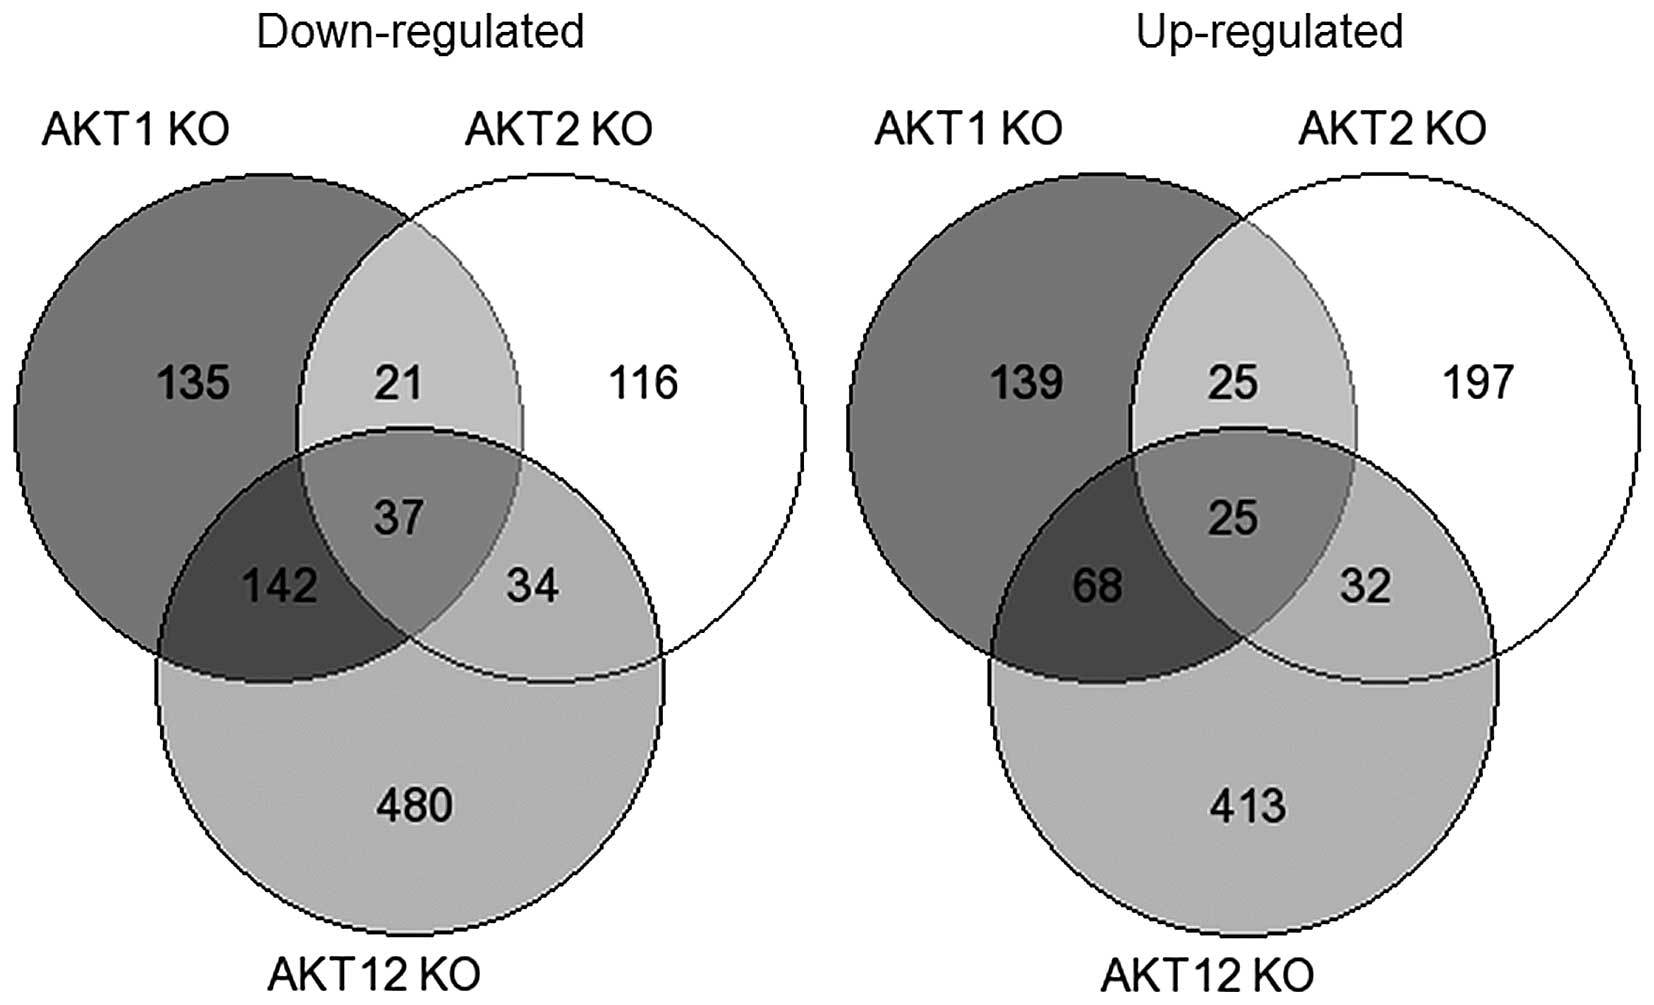
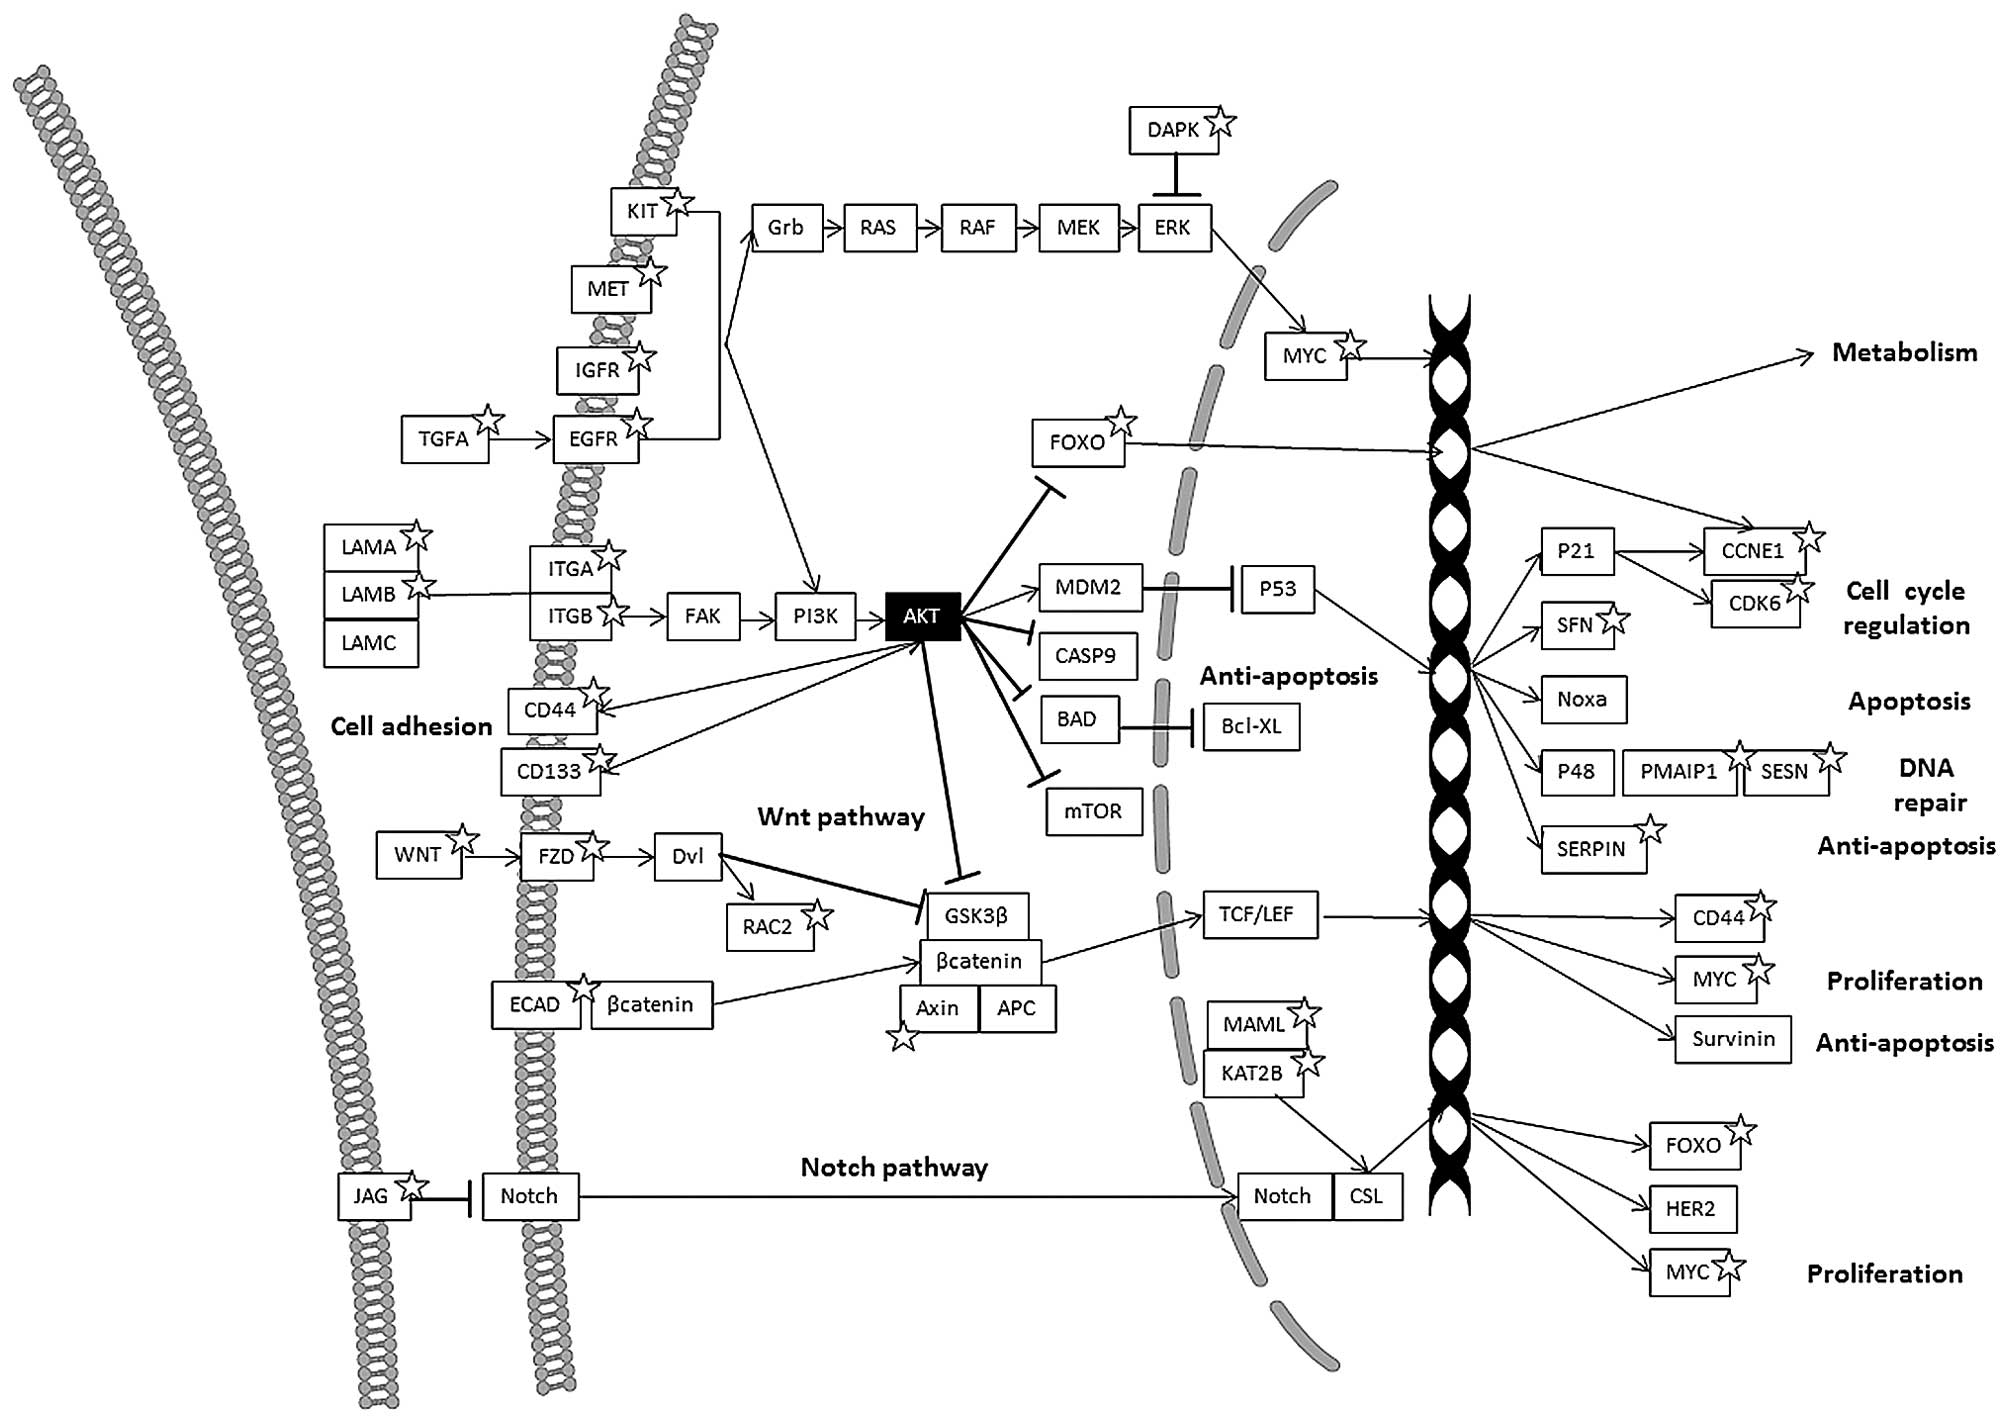
Comparing the different altered pathways in the
AKT1 KO, AKT2 KO and AKT1/2 KO cell-lines, a
number of signaling pathways were altered according to the
functional annotation analysis, including cell adhesion molecules
(CAMs), extracellular matrix (ECM)-receptor interaction, Notch, Wnt
and p53 pathways (Figs. 1 and
2, and Table I).
 | Table IFunctional annotation chart report of
KEGG signaling pathways from DAVID using the downregulated,
upregulated or both downregulated and upregulated gene set for each
subgroup. |
Table I
Functional annotation chart report of
KEGG signaling pathways from DAVID using the downregulated,
upregulated or both downregulated and upregulated gene set for each
subgroup.
| Pathways | P-value | Genes |
|---|
AKT1 KO vs.
parental
Downregulated genes | | |
| Notch signaling
pathway | 9.12E-02 | HES1, MAML2,
JAG1 |
| Upregulated
genes | | |
| ECM-receptor
interaction | 9.71E-04 | LAMA3, CD44, ITGB4,
ITGB5, ITGA3, THBS1 |
| Focal
adhesion | 2.22E-03 | EGFR, CAV1, LAMA3,
ITGB4, ITGB5, ITGA3, CAPN2, THBS1 |
| Pathways in
cancer | 2.94E-02 | EGFR, WNT5A, LAMA3,
NKX3-1, FOXO1, ITGA3, APPL1, TGFB2 |
| Both upregulated
and downregulated genes | | |
| ECM-receptor
interaction | 1.44E-03 | LAMA3, CD44, TNC,
ITGB4, ITGB5, ITGA3, LAMB1, THBS1 |
| Focal
adhesion | 7.12E-03 | EGFR, AKT1, CAV1,
LAMA3, TNC, ITGB4, ITGB5, ITGA3, LAMB1, CAPN2, THBS1 |
| Pathways in
cancer | 1.44E-02 | WNT5A, EGFR, SKP2,
FOXO1, LEF1, ITGA3, APPL1, TGFB2, DAPK1, AKT1, LAMA3, NKX3-1, TGFA,
LAMB1 |
| Prostate
cancer | 3.36E-02 | EGFR, AKT1, NKX3-1,
TGFA, LEF1, FOXO1 |
| Colorectal
cancer | 8.98E-02 | EGFR, AKT1, LEF1,
APPL1, TGFB2 |
AKT2 KO vs.
parental
Downregulated genes | | |
| N/A | | |
| Upregulated
genes | | |
| Cell adhesion
molecules (CAMs) | 5.27E-03 | CADM1, ITGB8,
PVRL3, CLDN1, NEO1, SDC4 |
| MAPK signaling
pathway | 7.87E-02 | BDNF, CACNA2D1,
RASGRF2, MAP3K14, FLNA, TGFB2 |
| Both upregulated
and downregulated genes | | |
| Cell adhesion
molecules (CAMs) | 7.97E-03 | ITGA9, CADM1,
ITGB8, PVRL3, CLDN1, CLDN2, NEO1, SDC4 |
| ECM-receptor
interaction | 5.88E-02 | ITGA9, CD44, ITGB8,
TNC, SDC4 |
AKT1/2 KO
vs. parental
Downregulated genes | | |
| Cell adhesion
molecules (CAMs) | 1.80E-02 | ALCAM, ITGA9, SDC1,
PTPRF, CLDN1, CLDN2, CD99, CDH1, NEO1, HLA-DMA |
| ECM-receptor
interaction | 4.10E-02 | LAMA2, CD47, ITGA9,
SDC1, TNC, ITGA3, LAMB1 |
| Notch signaling
pathway | 5.27E-02 | DTX4, HES1, KAT2B,
MAML2, JAG1 |
| Upregulated
genes | | |
| p53 signaling
pathway | 3.93E-03 | CCNE2, CCNE1,
SERPINB5, CDK6, RRM2B, PMAIP1, SESN3 |
| Pathways in
cancer | 6.22E-02 | WNT16, RALBP1,
ITGA2, FOXO1, CDK6, APPL1, FZD7, FZD6, CCNE2, IGF1R, CCNE1, PTK2,
TCEB1 |
| Upregulated and
downregulated genes | | |
| ECM-receptor
interaction | 1.25E-02 | LAMA2, CD47, ITGA9,
SDC1, CD44, TNC, ITGA1, ITGB5, ITGA2, ITGA3, LAMB1 |
| Pathways in
cancer | 1.33E-02 | WNT16, PPARG,
ARNT2, TGFB3, EGLN3, FOXO1, CDH1, KIT, AKT1, CCNE2, IGF1R, CCNE1,
PTK2, RAC2, TGFA, LAMB1, RALBP1, MET, SKP2, ITGA2, CDK6, ITGA3,
APPL1, FZD7, FZD6, DAPK1, LAMA2, TCEB1 |
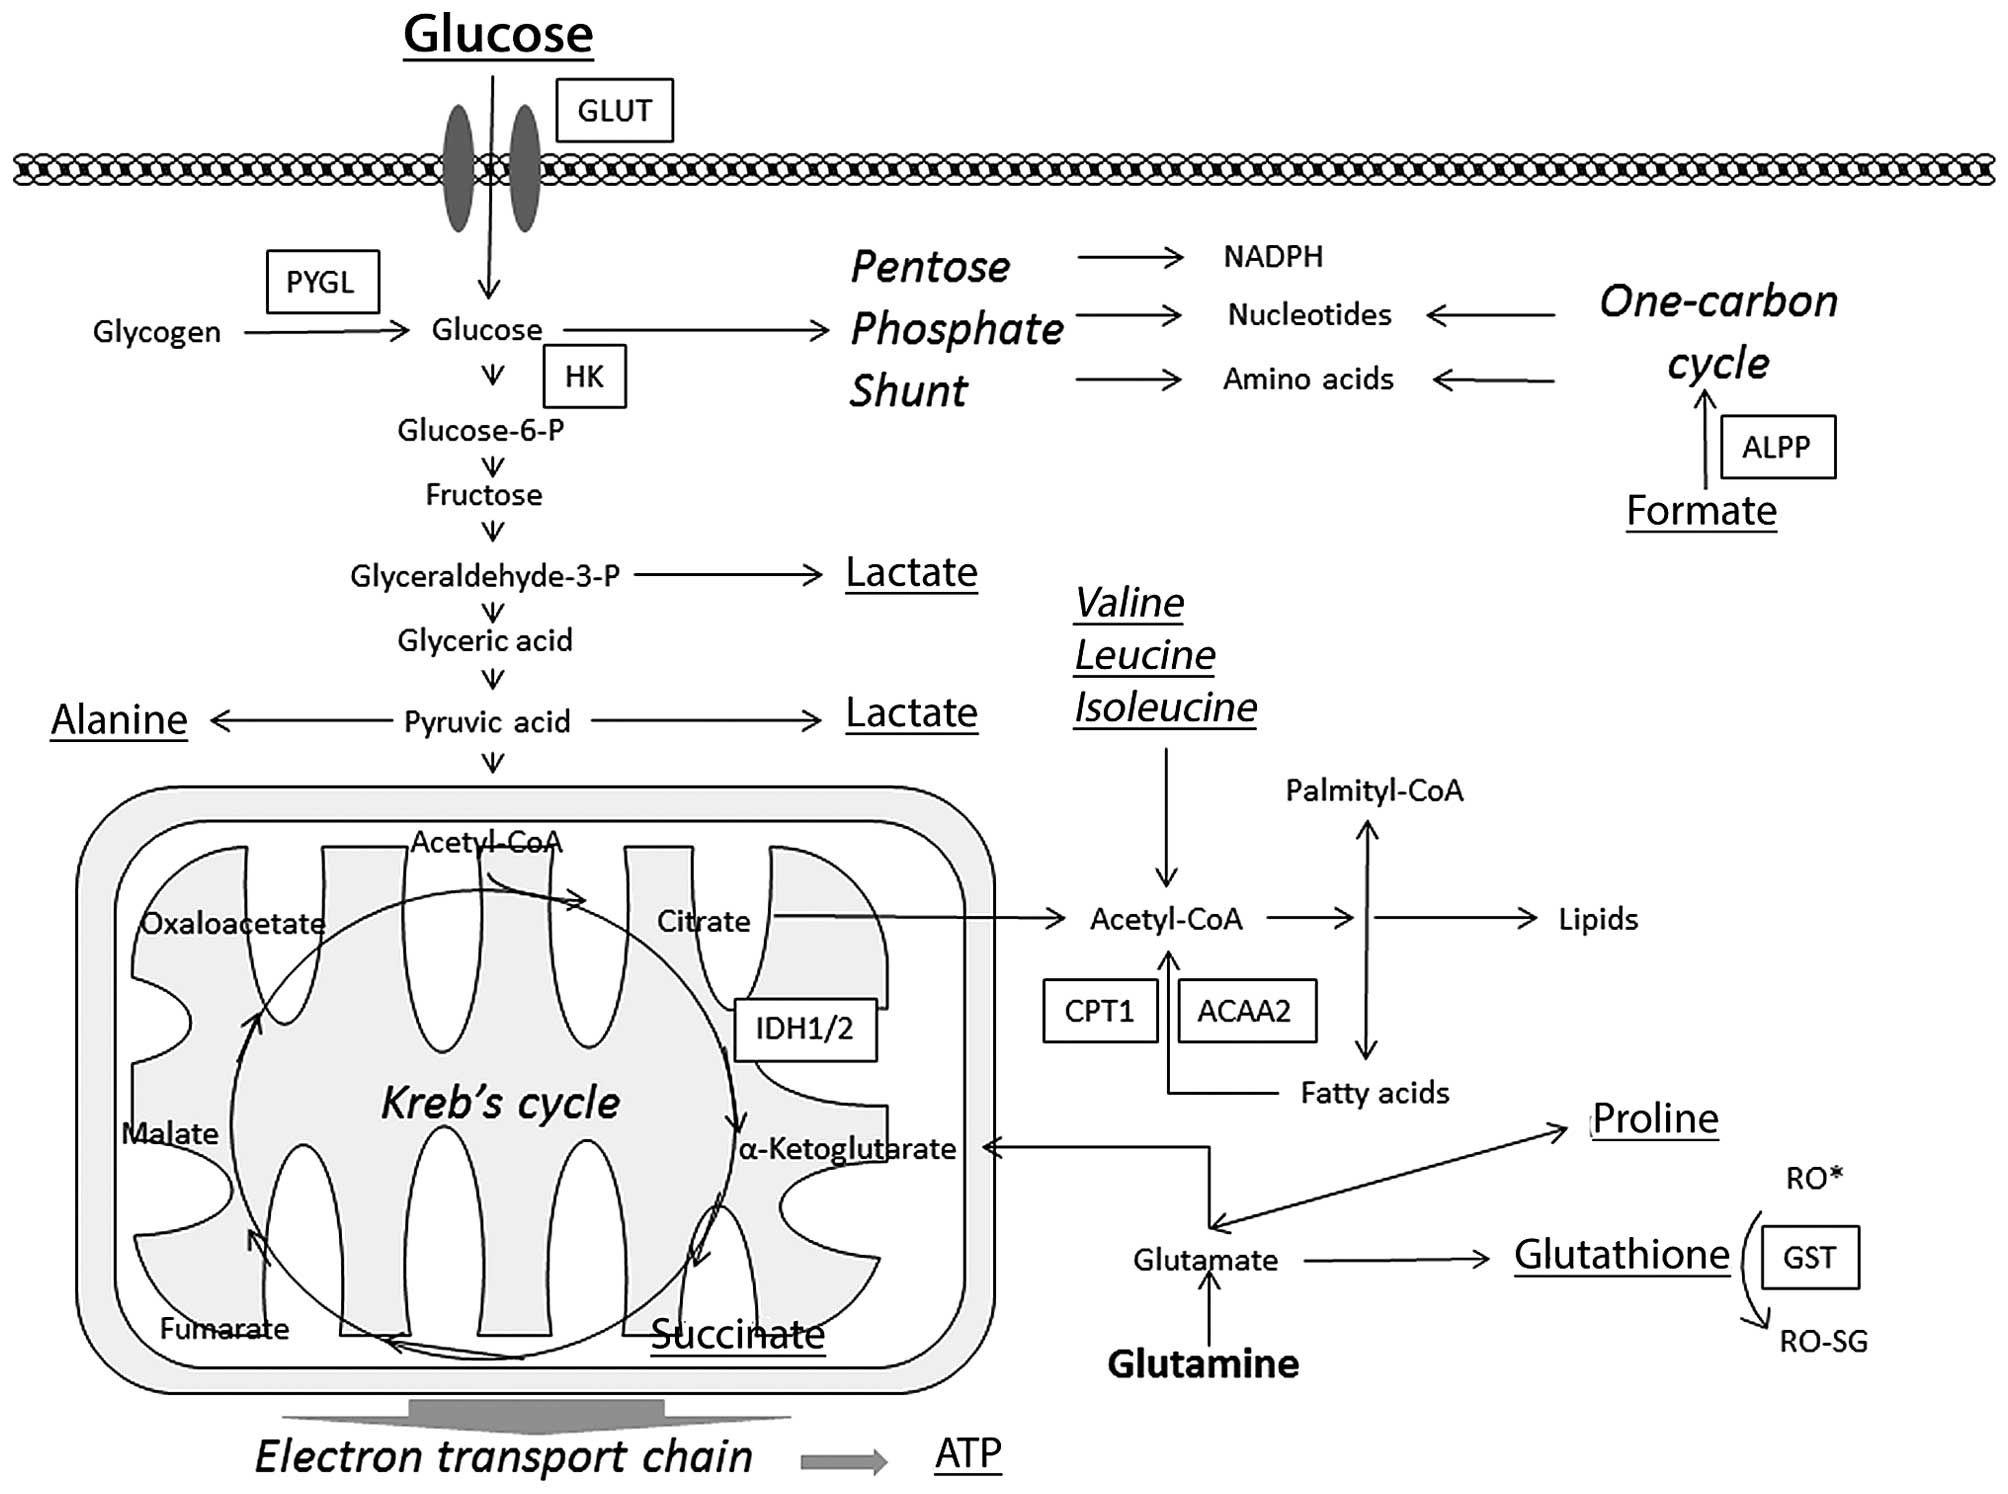
These pathways were further analyzed to evaluate the
importance of the different genes. There were also differences in
the metabolic pathways such as the starch, sucrose, glucose
pathway, the glutathione metabolism and fatty acid metabolism. Note
that some of these genes are involved in more than one pathway
(Fig. 3 and Table II).
| Table IIFunctional annotation chart report of
KEGG metabolic signaling pathways from DAVID using the
downregulated, upregulated or both downregulated and upregulated
gene set for each subgroup. |
Table II
Functional annotation chart report of
KEGG metabolic signaling pathways from DAVID using the
downregulated, upregulated or both downregulated and upregulated
gene set for each subgroup.
| Pathways | P-value | Genes |
|---|
AKT1 KO vs.
parental
Downregulated genes | | |
| N/A | | |
| Upregulated
genes | | |
| Folate
biosynthesis | 9.72E-02 | ALPPL2, ALPP |
| Both upregulated
and downregulated genes | | |
| Folate
biosynthesis | 1.98E-02 | ALPPL2, SPR,
ALPP |
| AKT2 KO vs.
parental | | |
| Downregulated
genes | | |
| N/A | | |
| Upregulated
genes | | |
| N/A | | |
| Both upregulated
and downregulated genes | | |
| Arginine and
proline metabolism | 6.49E-02 | SAT1, ALDH7A1,
CKMT1A, CKMT1B, MAOB |
| AKT1/2 KO
vs. parental | | |
| Downregulated
genes | | |
| Valine, leucine
and isoleucine degradation | 1.91E-03 | ALDH6A1, ACADSB,
MUT, HMGCS1, ALDH2, ABAT, ACAA1 |
| Glutathione
metabolism | 3.70E-03 | GSTM1, GSTM2,
GSTM3, GSTM4, IDH2, IDH1, MGST1 |
| Metabolism of
xenobiotics by cytochrome P450 | 9.10E-03 | GSTM1, GSTM2,
GSTM3, GSTM4, UGT1A5, UGT2B10, MGST1 |
| Drug
metabolism | 1.06E-02 | GSTM1, GSTM2,
GSTM3, GSTM4, UGT1A5, UGT2B10, MGST1 |
| Ascorbate and
aldarate metabolism | 1.36E-02 | UGT1A5, ALDH2,
UGDH, UGT2B10 |
| Propanoate
metabolism | 1.50E-02 | ALDH6A1, MUT,
ALDH2, ABAT, ACSS2 |
| Pentose and
glucuronate interconversions | 1.59E-02 | UGT1A5, UGDH,
UGT2B10, DCXR |
| Butanoate
metabolism | 1.85E-02 | ACSM3, HMGCS1,
ALDH2, ABAT, BDH2 |
| Androgen and
estrogen metabolism | 2.46E-02 | STS, HSD3B1,
UGT1A5, SULT2B1, UGT2B10 |
| Starch and sucrose
metabolism | 3.71E-02 | UGT1A5, PGM1, HK2,
UGDH, UGT2B10 |
| Amino sugar and
nucleotide sugar metabolism | 4.30E-02 | GNE, GFPT1, PGM1,
HK2, UGDH |
| Steroid hormone
biosynthesis | 4.94E-02 | STS, HSD3B1,
UGT1A5, SULT2B1, UGT2B10 |
| Retinol
metabolism | 7.97E-02 | RDH11, UGT1A5,
DHRS4L2, UGT2B10, PNPLA4 |
| Upregulated
genes | | |
| N/A | | |
| Both upregulated
and downregulated genes | | |
| Glutathione
metabolism | 1.52E-02 | GSTM1, GSTM2,
GSTM3, GSTM4, IDH2, IDH1, RRM2B, MGST1 |
| Starch and sucrose
metabolism | 2.18E-02 | PYGL, UGT1A5, PGM1,
HK2, UGDH, UGT2B10, PGM2L1 |
| Valine, leucine
and isoleucine degradation | 2.69E-02 | ALDH6A1, ACADSB,
MUT, HMGCS1, ALDH2, ABAT, ACAA1 |
| Butanoate
metabolism | 3.15E-02 | ACSM3, HMGCS1,
ALDH2, ABAT, BDH2, GAD1 |
| Drug
metabolism | 4.38E-02 | GSTM1, GSTM2,
GSTM3, GSTM4, UGT1A5, MAOB, UGT2B10, MGST1 |
| Ascorbate and
aldarate metabolism | 5.74E-02 | UGT1A5, ALDH2,
UGDH, UGT2B10 |
| Pentose and
glucuronate interconversions | 6.63E-02 | UGT1A5, UGDH,
UGT2B10, DCXR |
| Propanoate
metabolism | 8.61E-02 | ALDH6A1, MUT,
ALDH2, ABAT, ACSS2 |
In the cell adhesion molecule (CAM) pathway, several
genes were downregulated in the AKT1/2 KO cell line compared
to parental; ALCAM, CD99, CDH1, CLDN1,
CLDN2, HLA-DMA, ITGA9, NEO1,
PTPRF, SDC1, MET, RAC2, KIT and
TGFA. Genes that were upregulated include IGF1R,
PTK2, FOXO1 and PALLD. The AKT1 KO
cells displayed an analogous pattern. The AKT2 KO cells on
the other hand, showed upregulation of several genes in this
pathway; CADM1, CLDN1, ITGB8, NEO1,
PVRL3, SDC4, PALLD.
In the ECM-receptor interaction pathway, several
genes were altered in the AKT1/2 KO cell line compared to
parental cells. CD44 and several integrins; ITGA1,
ITGA2 and ITGB5 were upregulated whereas CD47,
ITGA3, ITGA9, LAMA2, LAMB1,
SYDC1 and TNC were downregulated. Similar patterns
were seen in the AKT1 and AKT2 KO.
In the Notch-signaling pathway, the AKT1/2 KO
and AKT1 KO had several genes that were downregulated
compared to parental; HES1, MAML2 and JAG1. In
the AKT1/2 KO, DTX4 and KAT2B were also
downregulated. In the AKT2 KO, there was a similar trend,
with the exception of KAT2B.
Genes involved in the Wnt signaling pathway, were
altered in all AKT isoform KO cells in relation to parental
cells. In the AKT1/2 KO, genes that were upregulated
include; FZD6, FZD7, MYC, WNT16,
DACT1 and TGFB1I1 while AXIN2, RAC2 and
TGFB3 were downregulated. In the AKT1 KO,
DACT1, TGFB1I1, TGFB2 and WNT5A were
upregulated while LEF1 was downregulated. In AKT2 KO,
TGFB2 was upregulated while AXIN2 was
downregulated.
Genes involved in the p53 pathway, were mostly
upregulated in the AKT1/2 KO; CCNE1, CCNE2,
CDK6, PMAIP1, RRM2B, SERPINB5 and
SESN3, while SKP2 was downregulated. A similar
pattern was seen in the AKT1 KO compared to parental with
SERPINB5 and THBS1 upregulated and SKP2
downregulated. In the AKT2 KO SERPINB5 was
upregulated while SESN3 was downregulated.
In the metabolic pathways, that were significantly
different between the AKT isoform KO cells and parental
cells were the glutathione and drug metabolism pathways (Table II). In the AKT1/2 KO
compared to parental, GSTM1, GSTM2, GSTM3,
GSTM4, IDH2, IDH1, MGST1,
UGT1A5, UGT2B10 were downregulated while MAOB
and RRM2B were upregulated. In the carbohydrate metabolism
(including sucrose, starch and glucose) PYGL, PGM2L1
and APPL1 were upregulated and UGT1A5, PGM1, HK2,
UGDH, UGT2B10, DCXR and ALDH2 were
downregulated. Similar patterns were seen in the AKT1 and
AKT2 KO, but not all genes were significantly altered. In
the fatty acid metabolism pathway, ACAA2, ALDH7A1,
ACSL5 were downregulated in the AKT2 KO. The gene expression
of ACAA2 was also downregulated in AKT1 KO, but upregulated
in the AKT1/2 KO. The gene expression of CPT1A was
downregulated in AKT1/2 KO. In the folate cycle, ALPP
and ALPPL2 were upregulated, while SPR was
downregulated in the AKT1 KO and AKT1/2 KO.
Cell migration
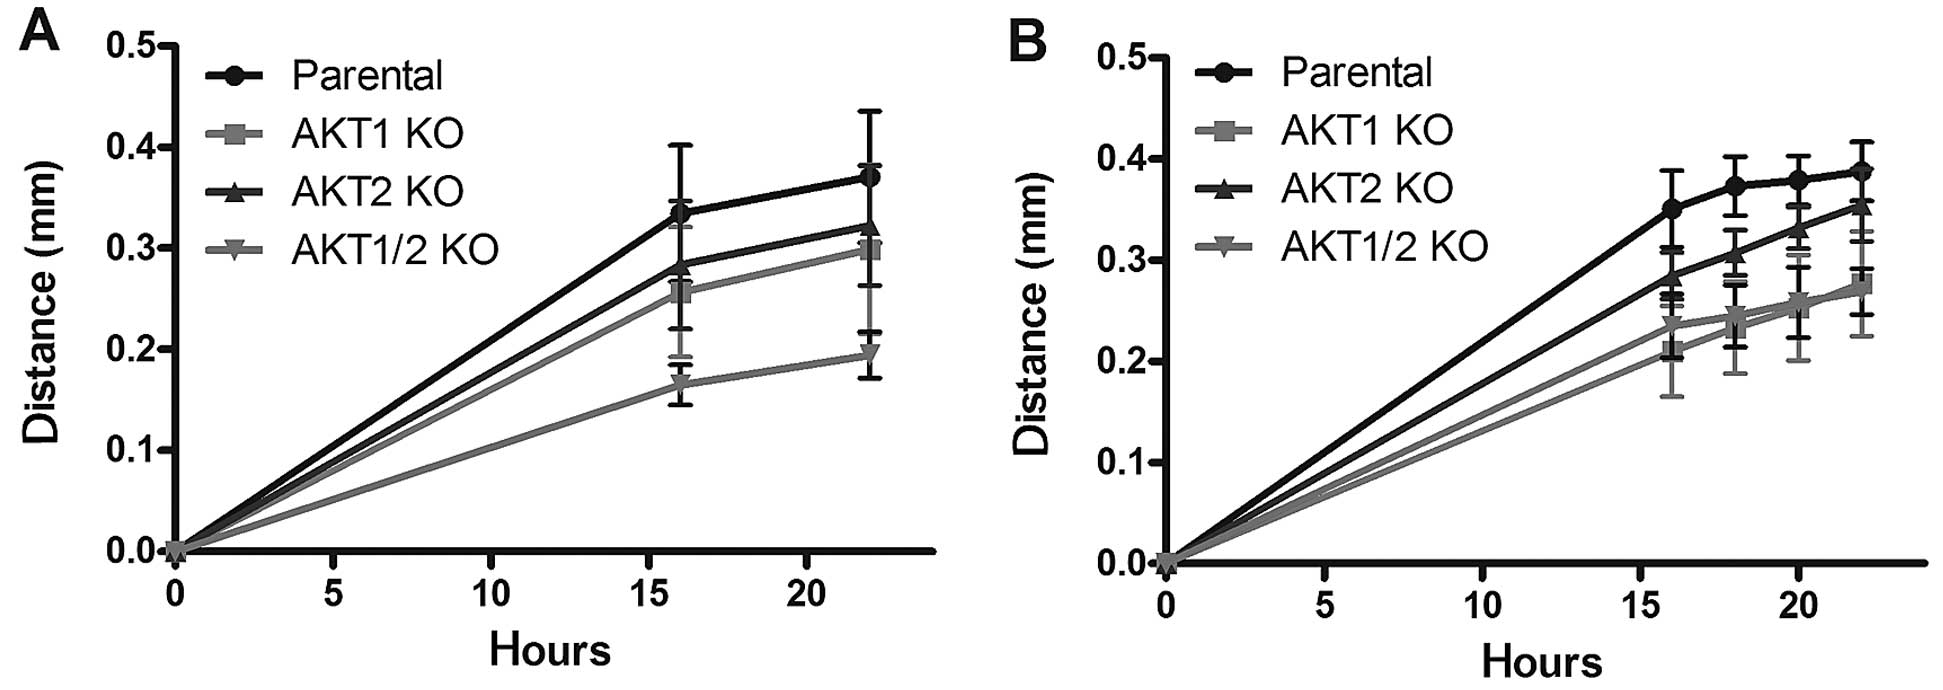
The scratch wound healing assay demonstrated a
reduced cell migration rate in the AKT KO cell lines
compared to the parental cell line (Fig. 4). In complete media, the
AKT1/2 KO cells demonstrated the most pronounced reduction
in migration rate (P<0.001) at 16 and 22 h, followed by
AKT1 KO (P<0.05), and AKT2 KO (P>0.05)
(Fig. 4A). Since growth factors
influence the migration rate, the cells were also starved for 24 h
before the addition of 15 ng EGF (Fig.
4B). In these settings, all different AKT KO cells
migrated more slowly than the parental cells. The migration rates
of the AKT1/2 KO and AKT1 KO were the most reduced
compared to the parental cells (P<0.001 for both at 16–22 h),
followed by AKT2 KO (P<0.05).
Metabolic profiling of the polar
metabolome
To further explore possible metabolic alterations,
the small polar metabolites were analyzed with NMR spectroscopy and
evaluated with multivariate modeling in both AKT KO cell
lines and the parental cell line. The differences in the polar
metabolome between the parental cell line and the AKT KO
cells were identified using OPLS-DA models and visualized using
S-line plots. Moreover, PCA analysis was used to overview the data
(Fig. 1). The altered spectral
bins, and consequently the annotated metabolites, were tested for
significance using ANOVA followed by LSD Tukey's test (Table III). Significant alterations
(P<0.05) were observed in AKT KO cells and include
decreased levels of lactate, alanine and succinic acid as well as
increased levels of formate. Moreover, AKT2 KO and
AKT1/2 KO demonstrated a significant increase of glucose
metabolism, and AKT1/2 KO also showed an increase in
glutathione and glutamine. The AKT1 KO had reduced levels of
the branched amino acids leucine, isoleucine and valine.
Additionally, the AKT1 KO and AKT1/2 KO displayed
reduced levels of glycine or reduced glycine levels.
| Table IIISummary of metabolite changes between
AKT knockout cells and parental cells measured with NMR. |
Table III
Summary of metabolite changes between
AKT knockout cells and parental cells measured with NMR.
| Metabolite ID | Chemical shift | AKT1 KO
| AKT2 KO
| AKT1/2 KO
|
|---|
| Alteration | P-value | Alteration | P-value | Alteration | P-value |
|---|
| Alanine | 1.47 | − | 0.0005 | NC | | − | 0.00003 |
| Leucine,
isoleucine | 0.96 | NC | | + | 0.0344 | NC | |
| Valine | 1.03 | NC | | + | 0.0151 | NC | |
| Glycine | 3.55 | NC | | NC | | − | 0.0075 |
| Proline | 2.0, 3.34 | − | 0.0045 | − | 0.00004 | − | 0.005 |
| Glucose | 3.24, 3.41, 3.52,
3.88, 4.64, 5.22 | NC | | + | 0.0028 | NC | |
| Lactate | 1.31, 4.10 | NC | | − | 0.0008 | − | 0.0082 |
| Glutathionea | 2.16, 2.55,
2.97 | NC | | | | + | 0.0007 |
| Succinic acid | 2.39 | − | 0.0021 | − | 0.0063 | − | 0.0015 |
| Formic acid
(formate) | 8.44 | + | 0.0135 | + | 0.00002 | + | 0.0132 |
| AMP | 5.93, 6.13, 8.26,
8.57 | − | 0.0346 | − | 0.0263 | NC | |
| ADP/ATP | 5.39, 6.13, 8.26,
8.52 | − | 0.0006 | − | 0.0006 | − | 0.0398 |
Discussion
The aim of the present study was to elucidate how
different pathways involved in cell survival, invasion, metastasis,
and resistance to therapy were altered in AKT isoform knockout cell
lines compared to their parental cell line. This was done using
genome wide expression profiling together with metabolic profiling,
as well as cell migration studies. Results from these analyses were
then related to our previous findings regarding DNA repair,
radio-resistance, and cancer stem cell marker expression (12,13).
One of the steps in tumor invasion, motility and
metastasis involves the cell adhesion molecules (CAMs), which take
part in both intracellular (ICM) and extracellular matrix (ECM)
interactions of the cancer cells. Loss of cell adhesion will render
the cancer cell more motile and invasive, and has been associated
with metastatic properties (21).
In this study, we demonstrated that genes in the CAM and ECM
pathways were significantly affected by the knockout of AKT1
and AKT2 isoforms, and that a result of this could be
reduced migration. The majority of the genes in the CAM and ECM
pathways were downregulated in the AKT1/2 KO cell lines
compared to parental cells (Table
II). This is in line with the results in the cell culture
migration assays, where the AKT knockout cell lines,
particularly in the AKT1/2 KO, showed a reduction in cell
migration rate compared to parental cells (Fig. 3A). This is also in agreement with
previous studies, by Ericson et al (22), showing that the AKT1/2 KO
formed fewer liver metastases compared to parental cells in mouse
xenografts. Furthermore, the AKT2 KO cells demonstrated an
upregulation of genes in the cell adhesion pathway. This could
explain the somewhat higher migration rate seen for AKT2 KO
cells under EGF treatment (Fig.
3B). Moreover, AKT2 KO cells express CD133, as opposed
to AKT1 and AKT1/2 KO cell lines (13). Notably, all the AKT isoform
KO cells had reduced cell migration compared to parental cells,
despite their upregulation of CD44, which is associated with
increased cell-cell and cell-ECM interactions, migration and
metastasis (13).
Pathways that are proposed to be involved in
radiation resistance, cell survival and cancer stem cell marker
expression are the Notch, Wnt and p53 pathways. The Notch signaling
pathway plays an important role in cell survival, embryonic
development, proliferation, differentiation and metastasis
(23). The Notch pathway has also
a role in cancer stem cells and radiation resistance in malignant
glioma (21) and breast cancer
(24). Furthermore, Notch pathway
inhibitors have been shown to increase radiation sensitivity in
head and neck cancer and colon cancer xenografts (25). In the present study, we show that
AKT KO caused a reduction in several genes in the Notch
signaling pathway (DTX4, HES1, KAT2B, MAML2 and JAG1). This
reduction was seen in AKT1/2 KO, AKT1 KO and to some
extent in AKT2 KO, which might explain the increase in
radiation sensitivity previously seen (12,13)
as well as the effects on cell migration (Fig. 4) in these cell lines compared to
parental cells.
Wnt-signaling is another important pathway in
colorectal cancer and cancer stem cells with β-catenin as the key
player (26) (Fig. 2). The colon cancer cell line,
DLD-1, used in the present study has a mutation in APC which is
suggested to make this pathway constantly active. However, despite
this mutation, we demonstrated that the AKT1/2 KO cells have
several upregulated genes (FZD6, FZD7, MYC, WNT16, DACT1 and
TGFB1I1) as well as others downregulated (AXIN2, RAC2 and TGFB3) in
this pathway. This is also in line with Yang et al (27) showing that APC might still
phos-phorylate β-catenin despite its mutation. Furthermore, AXIN2
was downregulated in the AKT1 KO, AKT2 KO and
AKT1/2 KO cell lines compared to their parental cell line,
which might result in the upregulation of the genes in the
Wnt-pathway, subsequently leading to an upregulation of genes like
CD44 as shown in a previous study (13).
p53 is a tumor suppressor, which is mutated in
numerous cancer forms. The colon cancer cell line DLD-1 has one
mutated p53 allele and one p53 silent allele (S241F/SIL) and has no
effect on the expression of p21 (28). AKT phosphorylates MDM2, which
following phosphorylation, binds to p53 and causes p53 degradation.
In contrast, p53 when active, can inhibit the expression of AKT via
PTEN. The AKT1/2 KO cell line had an increase in the
expression of genes involved in the p53 pathway compared to
parental cells, however, the regulation of these genes might not be
guided by p53 in this case. The genes that were upregulated include
PMAIP1 (Noxa) which is involved in apoptosis,
SERPINB5 and SESN3 involved in inhibition of
metastasis and angiogenesis, and RRM2B and THSB1,
which are involved in DNA repair.
The metabolic pathways are important for cell
survival and drug resistance. In this study, we have demonstrated
the effects of AKT isoform KO on metabolism, with an altered
expression of genes involved in metabolism as well as metabolic end
products. The main sources of energy are glucose and glutamine and
alterations in their metabolic pathways effect cell growth. A
number of genes involved in the metabolic pathways of glucose and
starch were downregulated in the AKT1/2 KO cell line
compared to parental cells. These genes are involved in different
parts of driving the metabolism of starch and glucose forward
(ALDH2, DCXR, HK2, PGM1, UGDH,
UGT1A5 and UGT2B10). However, PYGL, which converts
stored glycogen into glucose, was upregulated in AKT1 KO,
AKT2 KO and AKT1/2 KO. The metabolic profiling
experiment by NMR-spectroscopy also demonstrated that lactate was
reduced in AKT2 KO and AKT1/2 KO cells and that
alanine was reduced in AKT1 KO and AKT1/2 KO cells
compared to the parental. This might suggest that the glutamine
metabolism and the 'aerobic glycolysis' (i.e. metabolism of glucose
to lactate despite presence of oxygen) often seen in cancer cells
were reduced (29) (Table III). This would support the
theory of AKT-induced glucose metabolism, and that a reduction of
AKT can suppress this process. Additionally, the glucose level was
increased in the AKT2 KO cells compared to parental cells
despite the reduced level of lactate, suggesting that these cells
may still import glucose even with the lack of AKT2 or at least
using a different metabolic pathway compared to parental cells.
The fatty acid synthesis is believed to be promoted
by AKT through the activation of enzymes, which convert acetyl-CoA
to fatty acids. Fatty acids are a necessary part of the cell
membrane, involved in protein synthesis as well as serve as an
essential source of energy and thus proteins involved in the fatty
acid synthesis are upregulated in tumor cells (30). AKT regulates the synthesis of
proteins and long chain fatty acids via mTOR and fatty acid
synthase (FAS). Fatty acids can also be degraded into acetyl-CoA in
the mitochondria (via β-oxidation) and used as an energy source. It
is speculated that inhibition of the fatty acid biosynthesis or
upregulation of the fatty acid degradation would also impair the
tumor cell proliferation (31). In
the AKT2 KO cells, enzymes involved in the fatty acid
degradation, CPT1A, ACAA2, ALDH7A1 and
ACSL5, were downregulated, which would suggest that the
AKT2 KO cells have a lack of acetyl-CoA. However, another
source of acetyl-CoA is the metabolism of branched amino acids
(valine, leucine and isoleucine). As demonstrated in the
metabolomic assay, the level of branched amino acids was reduced in
the AKT1 KO cells. The level of succinic acid, which is a
part of the Krebs's cycle, was also reduced in all AKT
isoform KO cell lines compared to parental cells. This could be
linked to the IDH1 and IDH2 downregulation in the
AKT1 and AKT1/2 KO cells and the downregulation of
genes in the fatty acid degradation in AKT2 KO cells
(32). This would inhibit the
Krebs's cycle and cause cells to have a reduced proliferation.
Another important aspect of the metabolic pathways
is the resistance to drugs. The inactivation of chemotherapeutic
drugs is catalyzed by glutathione S-transferases (GSTs) and these
enzymes are believed to play an important role in multiple drug
resistance to chemotherapy (33).
GSTs also suppress the pro-apoptotic protein ASK1 (apoptosis
signal-regulating kinase-1) (34).
AKT1/2 KO cells show downregulation of several genes in the
glutathione pathway, which suggests that the sensitivity to
chemotherapeutics may be enhanced and the number of apoptotic cells
increased. The downregulation was, on the other hand, not as
prominent in the single AKT1 KO and AKT2 KO cell
lines. Furthermore, the glutathione level was increased in the
AKT1/2 KO, which could be a marker for increased oxidative
stress (ROS). However, this should be further clarified by studying
the level of ROS in the cells, as well as the level of the reduced
form of glutathione. The reduced form of glutathione is able to
detoxify the cells but the oxidized form cannot. Lactate may also
function as a scavenger and reduced levels of lactate in the
AKT2 KO and AKT1/2 KO may be part of the higher
radiation sensitivity of these cells compared to their parental
cells.
The folate cycle is important in cell replication
and survival through its involvement in DNA synthesis, DNA repair
and DNA methylation (35). ALPPs
are elevated in some cancers, including colorectal cancer (36), and have been correlated with folate
levels. SPR is involved in the folate cycle as well as in cell
proliferation (37). The gene
expression of ALPP and ALPPL1 was upregulated in the
AKT1 KO and AKT1/2 KO while SPR was downregulated
compared to parental. AKT1 KO and AKT1/2 KO also
showed decreased levels of glycine that can be correlated with an
impaired folate cycle. Additionally, the formate level, which is a
metabolite in the folate cycle, was increased in all AKT
isoform KO cells, suggesting that the folate cycle was impaired in
the AKT KO cells (38). The
impaired folate cycle could be connected to the higher radiation
sensitivity in AKT KO cells compared to parental due to the
lack of nucleotides for DNA repair. However, this needs to be
further clarified with more extensive metabolite studies.
In summary, this study shows that the dual knockout
of both AKT1 and AKT2 in a colorectal cancer cell
line (DLD-1) has great impact on several signaling pathways, such
as Notch, Wnt, p53 and genes in the cell adhesion and extracellular
matrix pathways, in addition to a reduced cell migration rate. The
genome analysis and metabolic profiling results show that both
AKT1 and AKT2 may change the glucose, starch and
sucrose metabolism pathway and that genes in this pathway are
mostly downregulated when AKT1 and AKT2 were knocked
out. Since lactate and alanine were reduced in AKT2 and
AKT1/2 KO cells compared to parental, this further confirms
that the aerobic glycolysis and the glutamine catabolism rates were
reduced. Genes involved in glutathione and drug metabolism,
especially the glutathione S-transferases were downregulated in
AKT1/2 KO. This is in line with an observed increase in
radiation sensitivity in these cells. The reduction of these
pathways confirms that knockout of both AKT1 and AKT2
will attenuate metastasis and tumor cell growth. Notably, genes in
the Wnt-pathway were upregulated as well as genes that allow
progression of the cell cycle, which could oppose this effect. AKT
inhibition should therefore be combined with other effectors
(drugs, radiation, and inhibitors) to attain the best effect.
Acknowledgments
The authors would like to acknowledge Hanna
Göransson Kultima at the SciLife Laboratory Uppsala, Sweden, for
all the help with the gene expression analysis and Ida Erngren for
the help with the metabolomic analysis.
References
|
1
|
Pal SK, Reckamp K, Yu H and Figlin RA: Akt
inhibitors in clinical development for the treatment of cancer.
Expert Opin Investig Drugs. 19:1355–1366. 2010. View Article : Google Scholar : PubMed/NCBI
|
|
2
|
Cheung M and Testa JR: Diverse mechanisms
of AKT pathway activation in human malignancy. Curr Cancer Drug
Targets. 13:234–244. 2013. View Article : Google Scholar : PubMed/NCBI
|
|
3
|
Chandarlapaty S, Sawai A, Scaltriti M,
Rodrik-Outmezguine V, Grbovic-Huezo O, Serra V, Majumder PK,
Baselga J and Rosen N: AKT inhibition relieves feedback suppression
of receptor tyrosine kinase expression and activity. Cancer Cell.
19:58–71. 2011. View Article : Google Scholar : PubMed/NCBI
|
|
4
|
Hollander MC, Maier CR, Hobbs EA, Ashmore
AR, Linnoila RI and Dennis PA: Akt1 deletion prevents lung
tumorigenesis by mutant K-ras. Oncogene. 30:1812–1821. 2011.
View Article : Google Scholar : PubMed/NCBI
|
|
5
|
Romano G: The role of the dysfunctional
akt-related pathway in cancer: Establishment and maintenance of a
malignant cell phenotype, resistance to therapy, and future
strategies for drug development. Scientifica (Cairo).
2013:3171862013.
|
|
6
|
Virtakoivu R, Pellinen T, Rantala JK,
Perälä M and Ivaska J: Distinct roles of AKT isoforms in regulating
β1-integrin activity, migration, and invasion in prostate cancer.
Mol Biol Cell. 23:3357–3369. 2012. View Article : Google Scholar : PubMed/NCBI
|
|
7
|
Vander Heiden MG, Cantley LC and Thompson
CB: Understanding the Warburg effect: The metabolic requirements of
cell proliferation. Science. 324:1029–1033. 2009. View Article : Google Scholar : PubMed/NCBI
|
|
8
|
Gonzalez E and McGraw TE: The Akt kinases:
Isoform specificity in metabolism and cancer. Cell Cycle.
8:2502–2508. 2009. View Article : Google Scholar : PubMed/NCBI
|
|
9
|
Garofalo RS, Orena SJ, Rafidi K, Torchia
AJ, Stock JL, Hildebrandt AL, Coskran T, Black SC, Brees DJ, Wicks
JR, et al: Severe diabetes, age-dependent loss of adipose tissue,
and mild growth deficiency in mice lacking Akt2/PKB beta. J Clin
Invest. 112:197–208. 2003. View Article : Google Scholar : PubMed/NCBI
|
|
10
|
Katome T, Obata T, Matsushima R, Masuyama
N, Cantley LC, Gotoh Y, Kishi K, Shiota H and Ebina Y: Use of RNA
interference-mediated gene silencing and adenoviral overexpression
to elucidate the roles of AKT/protein kinase B isoforms in insulin
actions. J Biol Chem. 278:28312–28323. 2003. View Article : Google Scholar : PubMed/NCBI
|
|
11
|
Simons A, Orcutt K, Madsen J, Scarbrough P
and Spitz D: The role of Akt pathway signaling in glucose
metabolism and metabolic oxidative stress. Oxidative Stress in
Cancer Biology and Therapy. Spitz DR, Dornfeld KJ, Krishnan K and
Gius D: Humana Press; New York: pp. 21–46. 2012, View Article : Google Scholar
|
|
12
|
Sahlberg SH, Gustafsson AS, Pendekanti PN,
Glimelius B and Stenerlow B: The influence of AKT isoforms on
radiation sensitivity and DNA repair in colon cancer cell lines.
Tumour Biol. 35:3525–3534. 2014. View Article : Google Scholar :
|
|
13
|
Sahlberg SH, Spiegelberg D, Glimelius B,
Stenerlöw B and Nestor M: Evaluation of cancer stem cell markers
CD133, CD44, CD24: association with AKT isoforms and
radioresistance in colon cancer cells. PLoS One. e946212014.
View Article : Google Scholar
|
|
14
|
Li C and Wong WH: Model-based analysis of
oligonucleotide arrays: Expression index computation and outlier
detection. Proc Natl Acad Sci USA. 98:31–36. 2001. View Article : Google Scholar : PubMed/NCBI
|
|
15
|
Smyth GK: Linear models and empirical
bayes methods for assessing differential expression in microarray
experiments. Stat Appl Genet Mol Biol. 3:Article3. 2004.
|
|
16
|
Benjamini Y and Hochberg Y: Controlling
the false discovery rate: A practical and powerful approach to
multiple testing. J R Stat Soc B. 57:289–300. 1995.
|
|
17
|
Liang CC, Park AY and Guan JL: In vitro
scratch assay: A convenient and inexpensive method for analysis of
cell migration in vitro. Nat Protoc. 2:329–333. 2007. View Article : Google Scholar : PubMed/NCBI
|
|
18
|
Sumner LW, Amberg A, Barrett D, Beale MH,
Beger R, Daykin CA, Fan TW, Fiehn O, Goodacre R, Griffin JL, et al:
Proposed minimum reporting standards for chemical analysis Chemical
Analysis Working Group (CAWG) Metabolomics Standards Initiative
(MSI). Metabolomics. 3:211–221. 2007. View Article : Google Scholar : PubMed/NCBI
|
|
19
|
Wishart DS, Jewison T, Guo AC, Wilson M,
Knox C, Liu Y, Djoumbou Y, Mandal R, Aziat F, Dong E, et al: HMDB
3.0 - The Human Metabolome Database in 2013. Nucleic Acids Res.
41(D1): D801–D807. 2013. View Article : Google Scholar
|
|
20
|
Trygg J and Wold S: Orthogonal projections
to latent structures (O-PLS). J Chemometr. 16:119–128. 2002.
View Article : Google Scholar
|
|
21
|
Makrilia N, Kollias A, Manolopoulos L and
Syrigos K: Cell adhesion molecules: Role and clinical significance
in cancer. Cancer Invest. 27:1023–1037. 2009. View Article : Google Scholar : PubMed/NCBI
|
|
22
|
Ericson K, Gan C, Cheong I, Rago C,
Samuels Y, Velculescu VE, Kinzler KW, Huso DL, Vogelstein B and
Papadopoulos N: Genetic inactivation of AKT1, AKT2, and PDPK1 in
human colorectal cancer cells clarifies their roles in tumor growth
regulation. Proc Natl Acad Sci USA. 107:2598–2603. 2010. View Article : Google Scholar : PubMed/NCBI
|
|
23
|
Takebe N, Nguyen D and Yang SX: Targeting
notch signaling pathway in cancer: Clinical development advances
and challenges. Pharmacol Ther. 141:140–149. 2014. View Article : Google Scholar :
|
|
24
|
Phillips TM, McBride WH and Pajonk F: The
response of CD24−/low/CD44+ breast
cancer-initiating cells to radiation. J Natl Cancer Inst.
98:1777–1785. 2006. View Article : Google Scholar : PubMed/NCBI
|
|
25
|
Liu SK, Bham SA, Fokas E, Beech J, Im J,
Cho S, Harris AL and Muschel RJ: Delta-like ligand 4-notch blockade
and tumor radiation response. J Natl Cancer Inst. 103:1778–1798.
2011. View Article : Google Scholar : PubMed/NCBI
|
|
26
|
de Sousa EM, Vermeulen L, Richel D and
Medema JP: Targeting Wnt signaling in colon cancer stem cells. Clin
Cancer Res. 17:647–653. 2011. View Article : Google Scholar
|
|
27
|
Yang J, Zhang W, Evans PM, Chen X, He X
and Liu C: Adenomatous polyposis coli (APC) differentially
regulates beta-catenin phosphorylation and ubiquitination in colon
cancer cells. J Biol Chem. 281:17751–17757. 2006. View Article : Google Scholar : PubMed/NCBI
|
|
28
|
Sur S, Pagliarini R, Bunz F, Rago C, Diaz
LA Jr, Kinzler KW, Vogelstein B and Papadopoulos N: A panel of
isogenic human cancer cells suggests a therapeutic approach for
cancers with inactivated p53. Proc Natl Acad Sci USA.
106:3964–3969. 2009. View Article : Google Scholar : PubMed/NCBI
|
|
29
|
DeBerardinis RJ, Mancuso A, Daikhin E,
Nissim I, Yudkoff M, Wehrli S and Thompson CB: Beyond aerobic
glycolysis: Transformed cells can engage in glutamine metabolism
that exceeds the requirement for protein and nucleotide synthesis.
Proc Natl Acad Sci USA. 104:19345–19350. 2007. View Article : Google Scholar : PubMed/NCBI
|
|
30
|
Menendez JA and Lupu R: Fatty acid
synthase and the lipogenic phenotype in cancer pathogenesis. Nat
Rev Cancer. 7:763–777. 2007. View Article : Google Scholar : PubMed/NCBI
|
|
31
|
Currie E, Schulze A, Zechner R, Walther TC
and Farese RV Jr: Cellular fatty acid metabolism and cancer. Cell
Metab. 18:153–161. 2013. View Article : Google Scholar : PubMed/NCBI
|
|
32
|
Oermann EK, Wu J, Guan KL and Xiong Y:
Alterations of metabolic genes and metabolites in cancer. Semin
Cell Dev Biol. 23:370–380. 2012. View Article : Google Scholar : PubMed/NCBI
|
|
33
|
Johansson K, Ahlen K, Rinaldi R, Sahlander
K, Siritantikorn A and Morgenstern R: Microsomal glutathione
transferase 1 in anticancer drug resistance. Carcinogenesis.
28:465–470. 2007. View Article : Google Scholar
|
|
34
|
Cho SG, Lee YH, Park HS, Ryoo K, Kang KW,
Park J, Eom SJ, Kim MJ, Chang TS, Choi SY, et al: Glutathione
S-transferase mu modulates the stress-activated signals by
suppressing apoptosis signal-regulating kinase 1. J Biol Chem.
276:12749–12755. 2001. View Article : Google Scholar : PubMed/NCBI
|
|
35
|
Choi SW and Mason JB: Folate and
carcinogenesis: An integrated scheme. J Nutr. 130:129–132.
2000.PubMed/NCBI
|
|
36
|
Harmenberg U, Frodin JE, Ljungdahl-Stahle
E, Mellstedt H, Wahren B and Stigbrand T: Significance of alkaline
phosphatase isozymes in the monitoring of patients with colorectal
carcinoma. Tumour Biol. 10:225–231. 1989. View Article : Google Scholar : PubMed/NCBI
|
|
37
|
Cho YR, Kim SH, Ko HY, Kim MD, Choi SW and
Seo DW: Sepiapterin inhibits cell proliferation and migration of
ovarian cancer cells via down-regulation of p70S6K-dependent
VEGFR-2 expression. Oncol Rep. 26:861–867. 2011.PubMed/NCBI
|
|
38
|
Lamarre SG, Morrow G, Macmillan L, Brosnan
ME and Brosnan JT: Formate: an essential metabolite, a biomarker,
or more? Clin Chem Lab Med. 51:571–578. 2013. View Article : Google Scholar
|