Introduction
Esophageal squamous cell carcinoma (ESCC) is one of
the most common malignancies worldwide (1). Despite recent progress in
multidisciplinary therapy and diagnostic approach, prognosis of
patients with ESCC remains poor because of the high incidence of
metastasis and therapeutic resistance (2,3).
However, increased understanding of the biological basis of ESCC
has led to the development of improved therapeutic and diagnostic
strategies.
Cancer stem cells (CSCs) are small number of cells
with stem cell properties such as self-renewal, differentiation
potential, tumorigenicity and therapeutic resistance (4–8).
Recent studies have detected mitotically quiescent CSCs in solid
tumors such as melanomas and breast and pancreatic cancers
(9–11). CSCs are predominantly present in
the resting phase of the cell cycle and undergo proliferation in
response to external stimuli (12). Quiescent CSCs possess higher
tumorigenicity and chemoresistance than other CSCs, indicating that
they are more responsible for the malignant potential of tumors and
they can be more effective therapeutic targets (10–14).
In ESCC, p75 neurotrophin receptor (p75NTR, CD271)
is expressed in a candidate CSC population that shows strong
expression of stem cell-related genes, high sphere/colony formation
ability, high tumorigenicity in a mouse xenograft model and
chemoresistance (15–18). Originally, p75NTR was found to be
expressed in the stem cell fraction of normal esophageal
keratinocytes, most of which were in the resting phase of the cell
cycle (19,20). Cell proliferation marker Ki-67
expression analysis and flow cytometric cell cycle analysis showed
that <50% p75NTR-positive cells maintain a mitotically quiescent
phenotype in ESCC (18). However,
isolation and characterization of these quiescent cells from
p75NTR-positive cells has not been performed to date. In the
present study, we isolated and characterized this candidate
quiescent CSC population in ESCC based on p75NTR expression and
cell cycle status.
Materials and methods
Cell culture
Human ESCC cell lines KYSE-30 and KYSE-140 were
established by Shimada et al (21) and were cultured in a T75 tissue
culture flask (Thermo Fisher Scientific, Inc., Yokohama, Japan)
containing DMEM/Ham's F-12 medium (Wako Pure Chemical Industries,
Ltd., Osaka, Japan) supplemented with 5% fetal calf serum (FCS;
Gibco, Grand Island, NY, USA) and 1% 100X antibiotic-antimycotic
(Gibco/Thermo Fisher Scientific, Waltham, MA, USA) by using a
standard previously reported method. The cells were maintained at
37°C in a humidified atmosphere of 5% CO2 until
confluence.
Cell sorting based on p75NTR expression
and cell cycle status
Cultured cells were washed once with
phosphate-buffered saline (PBS), then dissociated from culture
plates by using 0.25% trypsin EDTA (1X) and phenol red (Life
Technologies, Carlsbad, CA, USA) and were centrifuged at 300 × g
for 10 min. Single cells were resuspended in PBS containing 2% FCS
and allophycocyanin (APC)-conjugated human CD271 (LNGFR) antibody
(miltenyi Biotec GmbH, Bergisch Gladbach, Germany) or a compared
isotype control were incubated in the dark at 4°C for 30 min. After
washing twice with PBS containing 2% FCS, the cells were
resuspended in hank's balanced salt solution (Wako Pure Chemical
Industries), were treated with Vybrant® DyeCycle™ Violet
stain (DCV; Invitrogen/molecular Probes, Eugene, OR, USA) and were
mixed well. Next, the cells were incubated at 37°C for 30 min,
protected from light. Cell samples by using a flow cytometer (BD
FACSAria™ II; BD Biosciences, San Jose, CA, USA) were sorted into
the following four fractions: i) p75NTR-positive cells in the G0-G1
phase (p75NTR-positive/G0-1); ii) p75NTR-positive cells in the
S-G2-M phase (p75NTR-positive/S-G2-M); iii) p75NTR-negative cells
in the G0-G1 phase (p75NTR-negative/G0-1); iv) p75NTR-negative
cells in the S-G2-M phase (p75NTR-negative/S-G2-M). Each population
was evaluated as follows.
RNA extraction, cDNA synthesis and
real-time PCR
Total RNA was extracted using NucleoSpin®
RNA (Macherey-Nagel GmbH & Co.KG., Düren, Germany), according
to the manufacturer's instructions. Quality and quantity of the
total RNA were determined using NanoDrop™ 2000 (Thermo Fisher
Scientific, Wilmington, DE, USA) according to the manufacturer's
instructions. cDNA was synthesized using the PrimeScript™ II First
Strand cDNA Synthesis kit (Takara kyoto, Japan), according to the
manufacturer's instructions. cDNA samples were amplified using
mx3000P real-time qPCR system (Agilent Technologies, Palo Alto, CA,
USA) and SYBR® Premix Ex Taq™ II (Takara), according to
the manufacturer's instructions. PCR was performed using the
following protocol: 95°C for 15 sec, followed by 40 cycles of 95°C
for 5 sec and 60°C for 30 sec. mRNA expression was evaluated using
ΔΔCt method, with GAPDH as an internal normalization control.
Primers used for real-time PCR are as follows: p75NTR forward
primer, AAGAAAAGTGGGCCAGTGTG and p75NTR reverse primer,
AACAGTCCTTTGCAGGGTTG; Nanog forward primer, ATGCCTCACACGGAGACTGT
and Nanog reverse primer, AAGTGGGTTGTTTGCCTTTG; p63 forward primer,
CAGACTTGCCAGATCATCC and p63 reverse primer, CAGCATTGTCAGTTTCTTAGC;
BMI-1 forward primer, CCACCTGATGTGTGTGCTTTG and BMI-1 reverse
primer, TTCAGTAGTGGTCTGGTCTTGT; ABCG2 forward primer,
AGCAGGGACGAACAATCATC and ABCG2 reverse primer,
TTCCTGAGGCCAATAAGGTG; ERCC1 forward primer, GCCTCCGCTACCACAACCT and
ERCC1 reverse primer, TCTTCTCTTGATGCGGCGA; GAPDH forward primer,
ACCACAGTCCATGCCATCAC and GAPDH reverse primer,
TCCACCACCCTGTTGCTGTA.
Cell cycle analysis
Cell cycle was analyzed by performing flow cytometry
with BD CycleTest™ Plus DNA reagent kit (Becton-Dickinson, San
Jose, CA, USA) following the specific protocol provided by the
supplier. Data were analyzed using FCS4 Express cytometry
(Becton-Dickinson).
Colony formation assay
KYSE-30 or KYSE-140 cells were sorted into 1,000
cells by using BD FACSAria™ II. The cells were plated in 60-mm
tissue culture dishes (Thermo Fisher Scientific). After 14 days of
culturing, colonies were stained with Diff-Quik (Sysmex
International Reagents, Co., Ltd., Kobe, Japan) and the number of
colonies with a diameter of >3 mm was counted.
Cell fate assay by using a fluorescent
cell-tracing dye
KYSE-30 cells were stained with 10 µm
CellTrace™ Violet dye (Life Technologies, Carlsbad, CA, USA),
according to the manufacturer's instructions, and the stained cells
were incubated for 7 days at 37°C in an atmosphere of 5%
CO2. The cells were fixed with 4% paraformaldehyde in
PBS for 15 min, followed by incubation with PBS containing 1% FCS
for 30 min at room temperature. The cells were then incubated with
anti-p75NGF receptor antibody (ab52987; dilution, 1:1,000; Abcam,
Cambridge, UK) for 60 min at room temperature. Next, the cells were
washed three times with PBS and were incubated with fluorescein
isothiocyanate (FITC)-conjugated goat anti-rabbit IgG H&L
(ab6717; dilution, 1:1,000; Abcam) for 30 min at room temperature.
Finally, the cells were analyzed using a fluorescent microscope
(BZ-8000; Keyence, Osaka, Japan).
Sensitivity to anticancer drug
Each cell population was cultured at a density of
2×10³ cells/well in a 96-well plate (Thermo Fisher
Scientific) containing DMEM/Ham's F-12 medium supplemented with 5%
FCS at 37°C in a humidified atmosphere of 5% CO2. The
cells were cultured overnight until they reached confluence, after
which they were treated with or without (control) different
concentrations of cisplatin (CDDP; Wako Pure Chemicals). Cell
viability after 72 h of treatment with Cell Proliferation kit I
(Roche Diagnostics GmbH, Mannheim, Germany) was determined by
performing 3-(4, 5-dimethylthiazol-2-yl)-2,5-diphenyl-tetrazolium
bromide (MTT) assay. Absorbance was measured at 595 nm by using
FilterMax F5 (Molecular Devices, Tokyo, Japan). All assays were
performed according to the manufacturer's protocols.
Tumorigenicity assay in nude mice
All mouse studies were carried out under the
approval of the Institutional Review Board of the University of
Toyama (no. A-2013 MED-11). Six-week-old athymic nude mice
(BALB/CAN. Cg-Foxnlnu/CrCrlj; Charles River Laboratories
Japan Inc., Yokohama, Japan) were used for performing
tumorigenicity assay with KYSE-30 cells. Sorted cells (density,
100–1,000 cells) were subcutaneously injected into the bilateral
lumber of mice. The mice were sacrificed after 8 weeks, and the
sites of subcutaneous tumor development were counted and tumor
weights were measured.
Patients and surgical specimens
We analyzed 95 tumor specimens from patients with
ESCC who underwent a surgery at our hospital from 1986 to 2016.
Median follow-up time was 24 months (range, 1–134 months). The
study included 84 male and 11 female patients, and with a median
age of 67 years (range, 43–86 years). TNM stages (ver. 6) of the
patients are as follows: stage I, 8 patients; stage IIA, 22
patients; stage IIB, 11 patients; stage III, 48 patients; and stage
IV, 6 patients. In all, 23 patients received CDDP-based neoadjuvant
chemotherapy, of which 19 patients received CDDP plus
5-fluorouracil (5-FU) therapy, and 4 patients received CDDP plus
docetaxel and 5-FU therapy. The Institutional Review Board at the
University of Toyama approved this study (no. 20-57).
Immunohistochemical analysis
Immunohistochemical staining was performed using
anti-Ki-67 antibody (dilution, 1:100; Abcam) and human p75NTR
monoclonal antibody against p75NGER (NGER 5; dilution, 1:100;
Abcam). Immunostaining was performed using Envision Plus kits,
horseradish peroxidase, or 3,3′-diaminobenzidine (Dako Cytomation,
Kyoto, Japan), as recommended by the supplier. Counterstaining was
performed using Mayer's hematoxylin.
The numbers of p75NTR-positive cells and all tumor
cells with nuclear staining were counted in three random fields of
each section. Then, the proportions of each cell type in each tumor
were calculated. We classified tumors as positive when >5% of
the tumor cells were stained.
Double immunocytochemical staining of
p75NTR and cell proliferation marker Ki-67
Double immunocytochemical staining of p75NTR and
Ki-67 was performed using BOND-III automated immunostainers (Leica
Biosystems, Nussloch, Germany). Primary antibodies used for double
immunocytochemical staining against p75NTR and Ki-67 were the same
as used for immunohistochemical analysis.
Statistical analysis
Statistical analysis was performed using JMP 11.2.0
software (SAS Institute, Inc., Cary, NC, USA). Chi-square test and
Fisher's exact test were used for performing statistical analyses,
with P-values of <0.05 being considered statistically
significant. Kaplan-Meier method was used for performing survival
analysis.
Results
Differentiation of cell subsets according
to p75NTR expression and cell cycle status
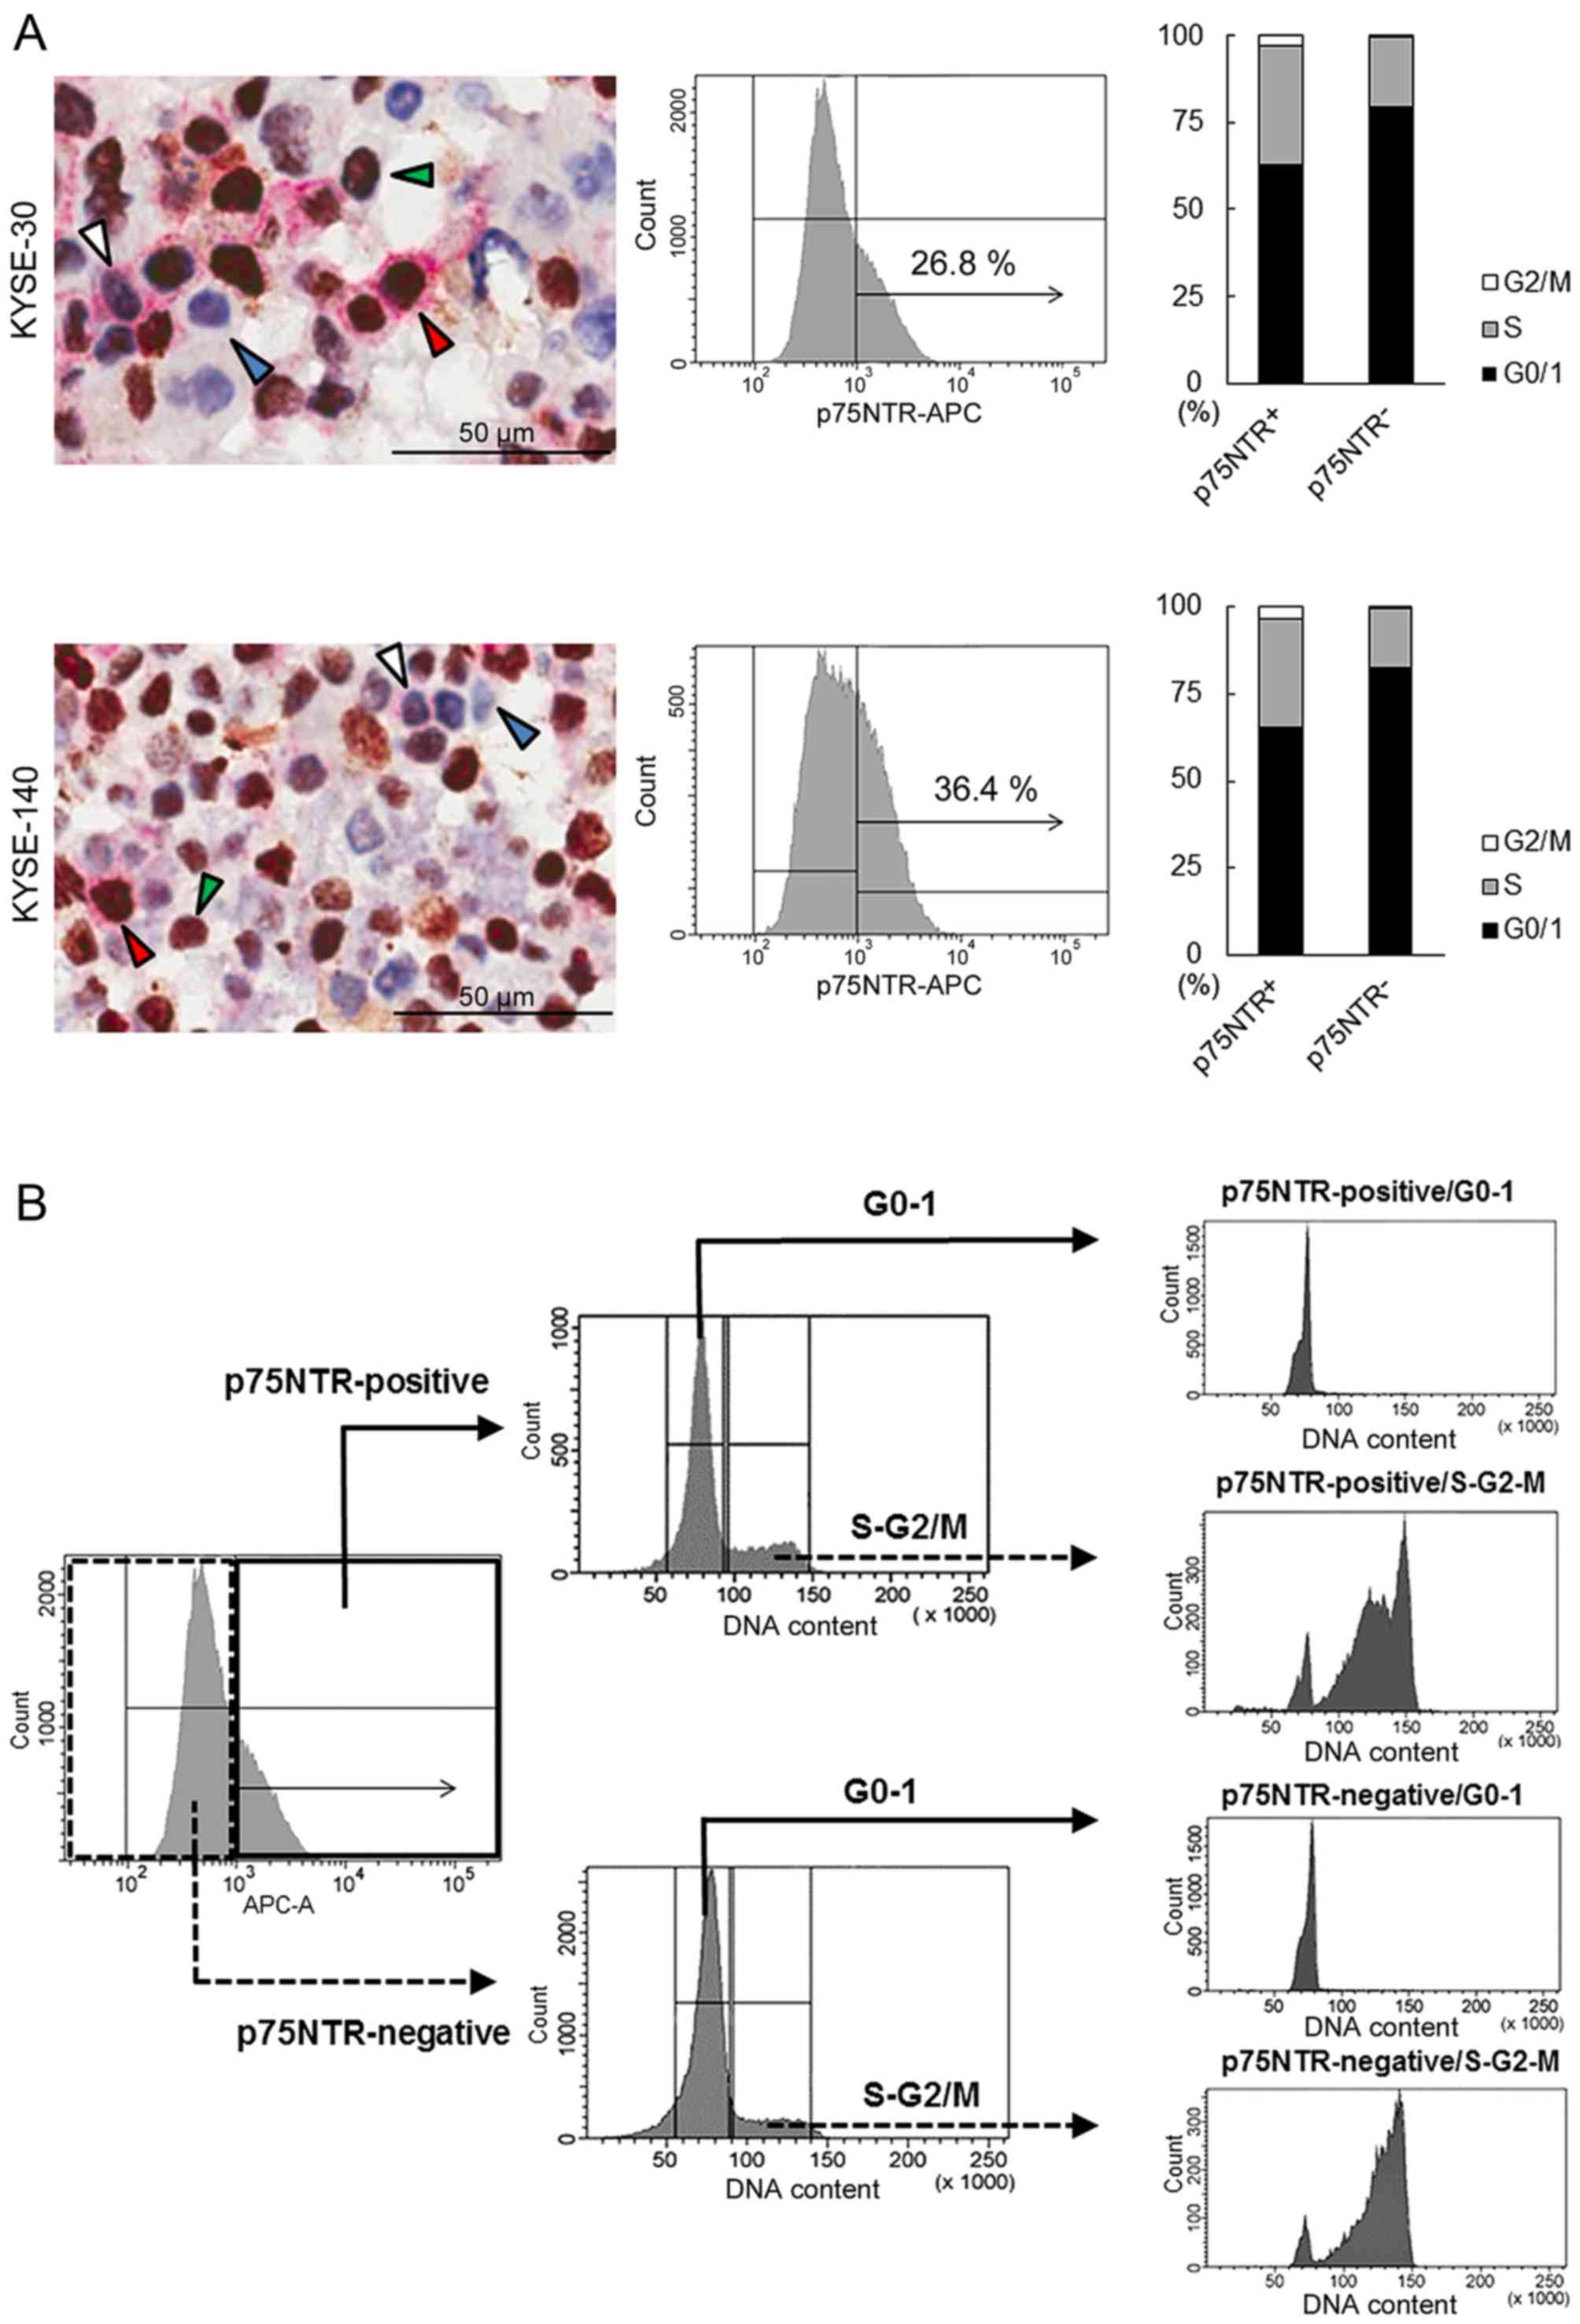
Double immunocytochemical staining of p75NTR (red)
and cell proliferation marker Ki-67 (brown), which are expressed in
cells in the G1, S, G2 and M phases of the cell cycle,
differentiated KYSE-30 and KYSE-140 cells into
p75NTR-positive/Ki-67-negative (white arrowhead),
p75NTR-positive/Ki-67-positive (red arrowhead),
p75NTR-negative/Ki-67-negative (blue arrowhead) and
p75NTR-negative/Ki-67-positive (green arrowhead) cells (Fig. 1A). Precise cell counting showed
that 11.4 and 15.7% KYSE-30 and KYSE-140 cells, respectively,
showed p75NTR positivity and Ki-67-negativity (G0 phase).
Furthermore, 21.8 and 33.8% p75NTR-positive and p75NTR-negative
KYSE-30 cells, respectively, yielded negative results for Ki-67.
Similarly, 36.5 and 43.1% p75NTR-positive and p75NTR-negative
KYSE-140 cells, respectively, yielded negative results for Ki-67
(Fig. 1A).
Flow cytometric analysis of p75NTR expression showed
positive staining in 26.8 and 36.4% KYSE-30 and KYSE-140,
respectively (Fig. 1A). Flow
cytometric analysis of cell cycle based on DNA content showed that
63.0 and 79.4% p75NTR-positive and p75NTR-negative KYSE-30 cells,
respectively, were in the G0/G1 phase and that 65.2 and 82.4% of
p75NTR-positive and p75NTR-negative KYSE-140 cells, respectively,
were in the G0/G1 phase (Fig. 1A).
Thus, 16.9 and 23.7% p75NTR-positive KYSE-30 and KYSE-140 cells,
respectively, were in the G0-G1 phase of the cell cycle.
Flow cytometric analysis identified four distinct
cell subsets, i.e., p75NTR-positive/G0-1, p75NTR-positive/S-G2-M,
p75NTR-negative/G0-1 and p75NTR-negative/S-G2-M cells, based on
p75NTR expression and cell cycle status.
Flow cytometric cell sorting based on
p75NTR expression and cell cycle status
To isolate viable p75NTR-positive/G0-1,
p75NTR-positive/S-G2-M, p75NTR-negative/G0-1, and
p75NTR-negative/S-G2-M cells, KYSE-30 and KYSE-140 cells were
fractionated into p75NTR-positive and p75NTR-negative cells by
using the APC-conjugated anti-p75NTR antibody, followed by
fractionation into cells in the G0-G1 and S-G2-m phases by using a
fluorescent DNA-staining dye DCV (Fig.
1B).
Expression of p75NTR in the four cell subsets sorted
by flow cytometry was confirmed by performing real-time PCR. The
mRNA expression of p75NTR was significantly higher in
p75NTR-positive/G0-1 and p75NTR-positive/S-G2-M cells than in
p75NTR-negative/G0-1 or p75NTR-negative/S-G2-M cells (Fig. 1C).
Cell cycle status of each cell subset was confirmed
using another DNA-staining dye (BD CycleTest™ Plus DNA reagent
kit). Results showed that 93.29 and 92.88% in p75NTR-positive and
p75NTR-negative KYSE-30 cells, respectively, were in the G0-G1
phase and 92.74 and 94.29% p75NTR-positive and p75NTR-negative
KYSE-140 cells, respectively, were in the G0-G1 phase (Fig. 1C). Furthermore, 99.9 and 93.43%
p75NTR-positive and p75NTR-negative KYSE-30 cells, respectively,
were in the S-G2-M phase, and 99.9 and 94.43% p75NTR-positive and
p75NTR-negative KYSE-140 cells, respectively, were in the S-G2-M
phase (Fig. 1C).
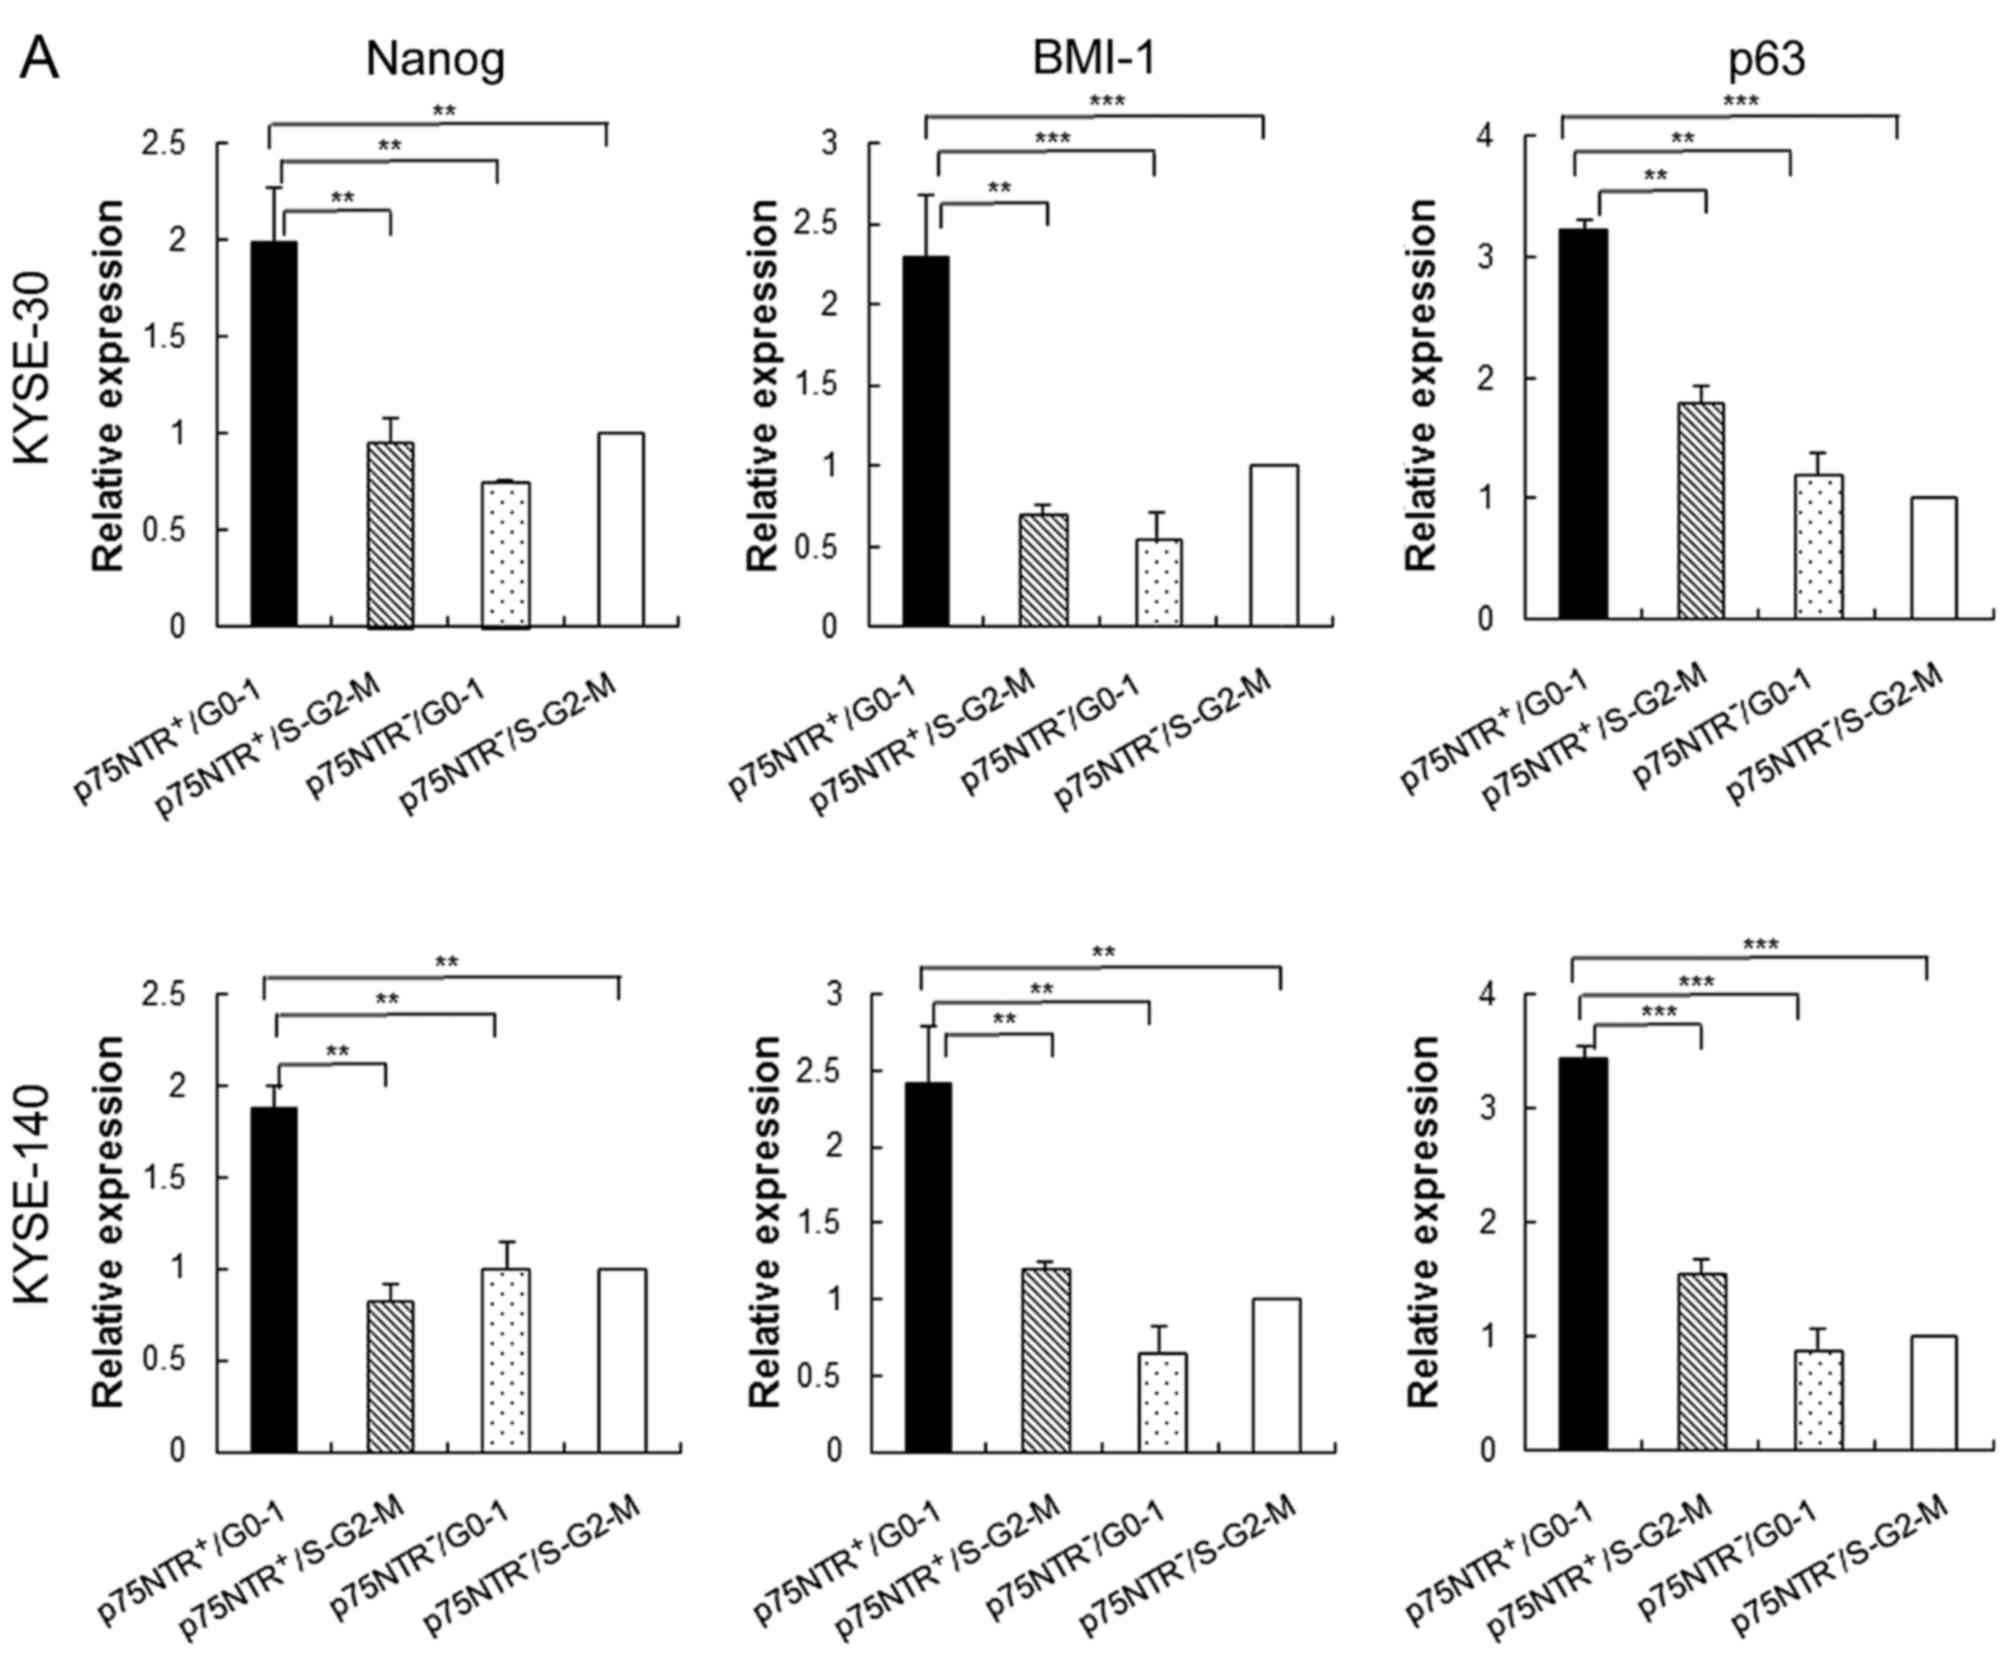
Stem cell phenotype of fractionated cell
subsets
Results of real-time PCR showed that expression of
stem cell-related genes such as Nanog, BMI-1 and p63 was
significantly higher in p75NTR-positive/G0-1 KYSE-30 and KYSE-140
cells than in the other cell subsets, including
p75NTR-positive/S-G2-M fraction KYSE-30 and KYSE-140 cells
(Fig. 2A). Furthermore,
p75NTR-positive/G0-1 KYSE-30 and KYSE-140 cells showed the highest
colony formation ability, with statistical significance, among the
four cell subsets, while p75NTR-positive/S-G2-M KYSE-30 and
KYSE-140 cells showed the second highest colony formation ability
(Fig. 2B).
To detect slow-cycling p75NTR-positive cells,
KYSE-30 cells were stained with a fluorescent cell-tracing reagent,
which diffuses into cells and covalently binds to intracellular
amines. After labeling, all the adherent KYSE-30 cells showed
fluorescent staining on culture day 1 (Fig. 2C). However, the number of unstained
cells increased by culture day 7 because the concentration of the
label decreased after cell division. However, a small number of
p75NTR-positive cells retained the label, suggesting that these
cells divided less frequently (Fig.
2C). Cell counting showed that 0.9% of all the cells retained
the label, and 3.4% of p75NTR-positive cells were label-retaining
cells. In contrast, no label-retention was observed in
p75NTR-negative cells (Fig.
2C).
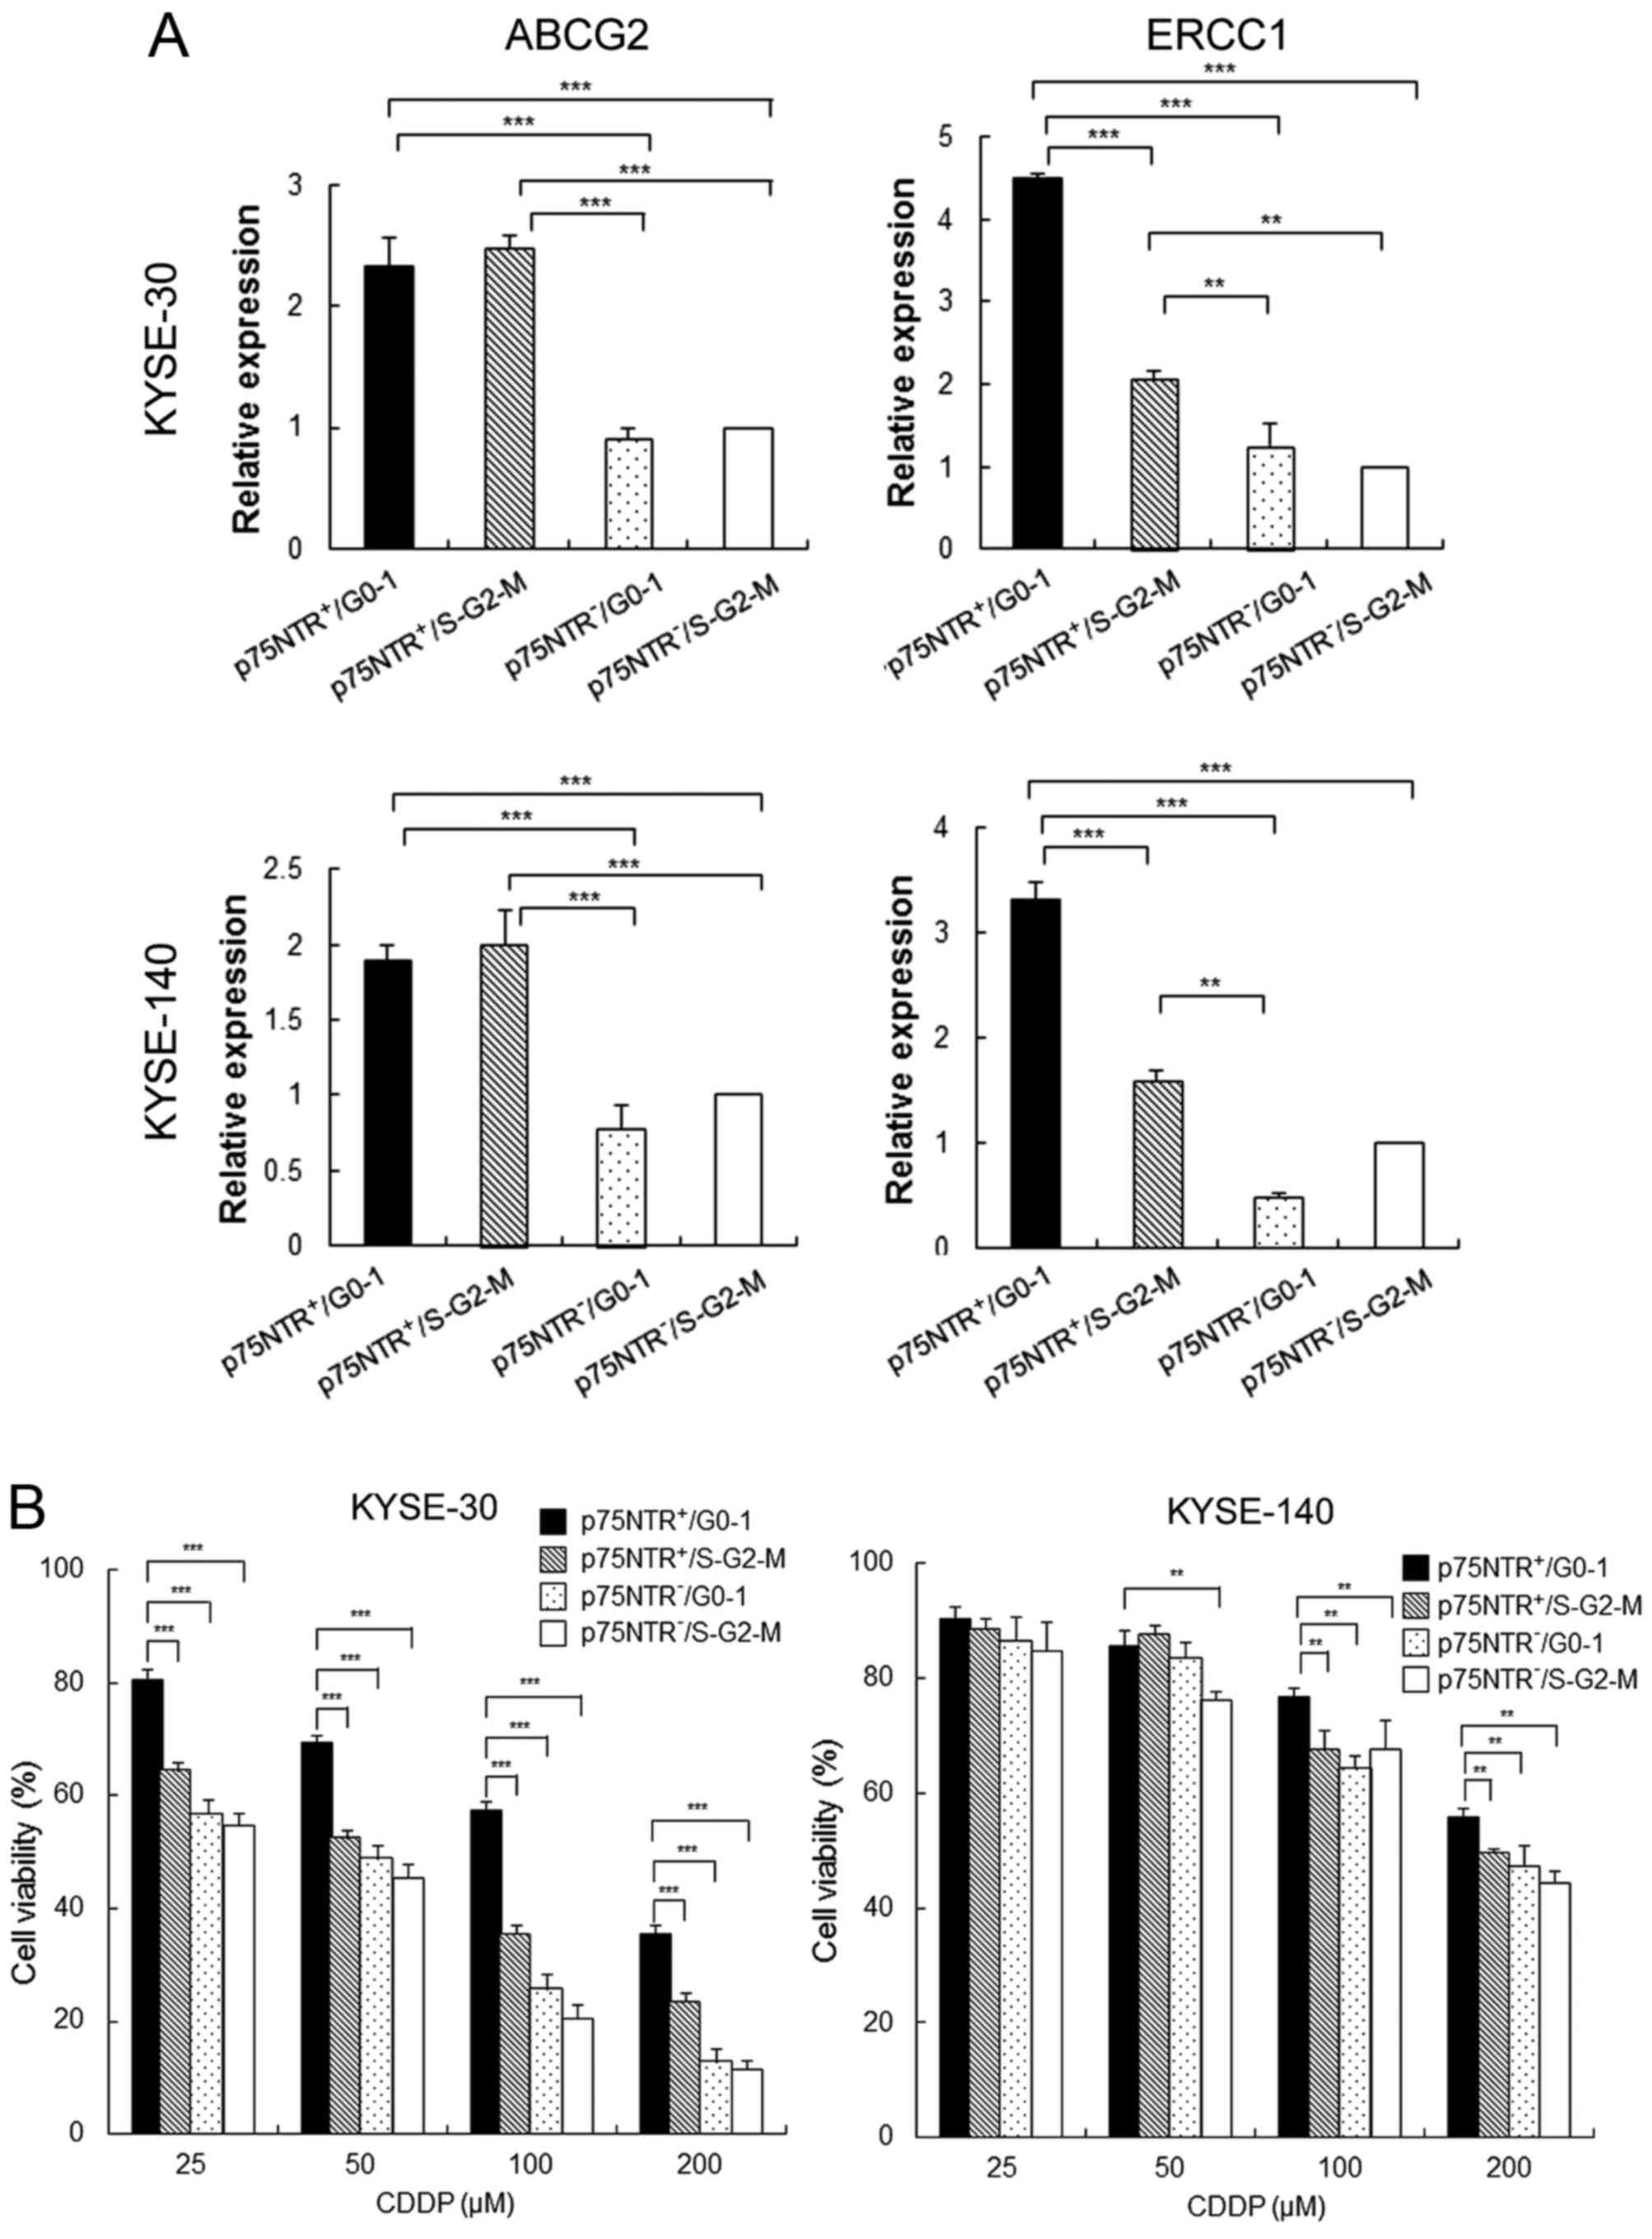
Drug resistance ability of the
fractionated cell subsets
Results of real-time PCR showed that the expression
of ATP-binding cassette sub-family G member 2 (ABCG2) was
significantly higher in p75NTR-positive cells than in
p75NTR-negative cells, irrespective of their cell cycle status
(Fig. 3A). On the other hand,
expression of excision repair cross-complementation group 1
(ERCC1), which contributes to resistance against platinum-based
chemotherapeutic drugs, was significantly higher in
p75NTR-positive/G0-1 cells than in other cell subsets, including
p75NTR-positive/S-G2-M cells (Fig.
3A). Results of the MTT assay showed that the viability of
total cells decrease by CDDP treatment dose-dependently both in
KYSE-30 and KYSE-40. However, the viability of p75NTR-positive/G0-1
KYSE-30 cells was significantly higher than that of the other cell
subsets at all CDDP concentrations. Furthermore, the viability of
p75NTR-positive/G0-1 KYSE-140 cells was significantly higher than
that of the other cell subsets at CDDP concentrations of 100 and
200 µM (Fig. 3B).
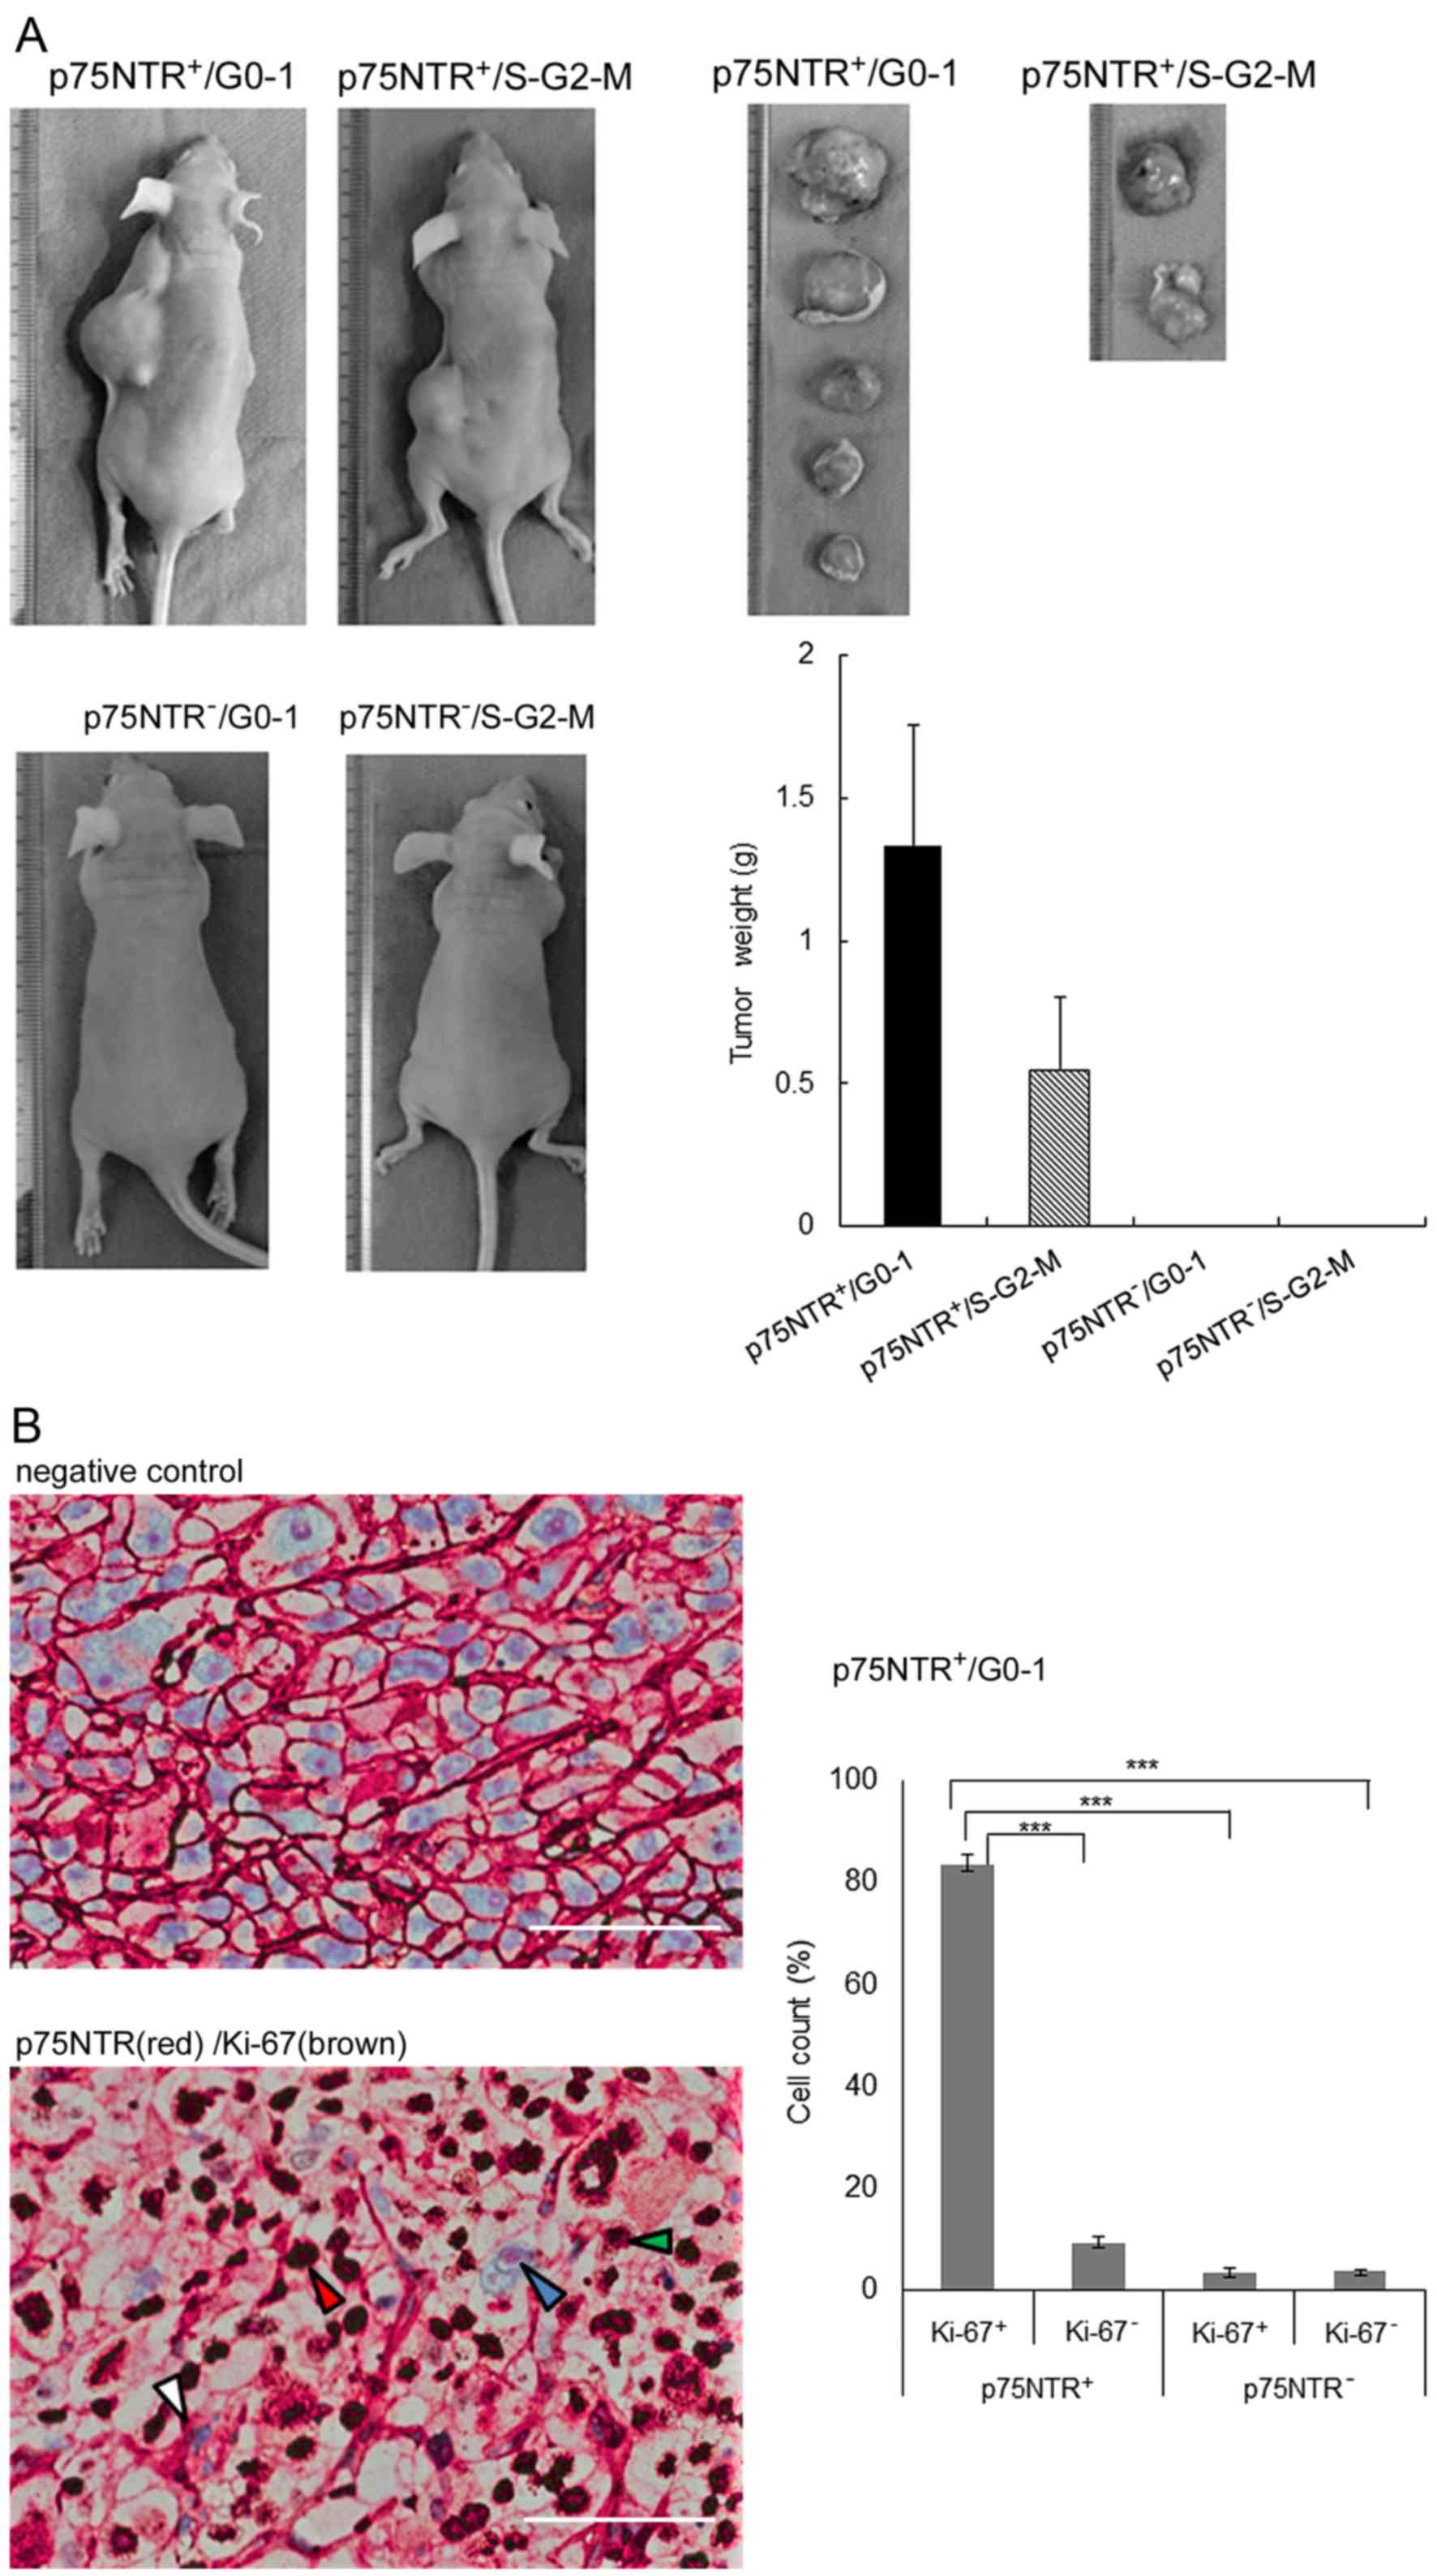
Tumorigenicity in nude mice
Subcutaneous injection of as few as 100
p75NTR-positive/G0-1 KYSE-30 cells into nude mice resulted in tumor
development at 5 of 6 (83.3%) injection sites after 8 weeks, while
that of p75NTR-positive/S-G2-M KYSE-30 cells resulted in tumor
development at 2 of 6 (33.3%) injection sites. Injection of 100
p75NTR-negative/G0-1 or p75NTR-negative/S-G2-M cells did not result
in tumor development (Table I).
The weights of tumors derived from p75NTR-positive/G0-1 cells were
higher than those of tumors derived from p75NTR-positive/S-G2-M
cells (Fig. 4A).
 | Table IIn vivo tumor development
after injecting p75NTR-positive/G0-1, p75NTR-positive/S-G2-M,
p75NTR-negative/G0-1 and p75NTR-negative/S-G2-M KYSE-30 cells into
nude mice. |
Table I
In vivo tumor development
after injecting p75NTR-positive/G0-1, p75NTR-positive/S-G2-M,
p75NTR-negative/G0-1 and p75NTR-negative/S-G2-M KYSE-30 cells into
nude mice.
| No. of cells
injected | Tumor incidence
|
|---|
| 1,000 | 300 | 100 |
|---|
| KYSE-30 |
|
p75NTR-positive/G0-1 | 6/6 | 4/6 | 5/6 |
|
p75NTR-positive/S-G2-M | 4/6 | 4/6 | 2/6 |
|
p75NTR-negative/G0-1 | 3/6 | 2/6 | 0/6 |
|
p75NTR-negative/S-G2-M | 2/6 | 1/6 | 0/6 |
Histological examination of xenograft tumors showed
that a large percentage (83.4%) of cells in tumors derived from 300
p75NTR-positive/G0-1 cells showed p75NTR (red) and Ki-67 (brown)
positivity. The proportion of other cell fractions was as follows:
p75NTR-positive/Ki-67-negative cells, 9.3%;
p75NTR-negative/Ki-67-positive cells, 3.5%; and
p75NTR-negative/Ki-67-negative cells, 3.8% (Fig. 4B).
Identification of cell subsets based on
p75NTR expression and cell cycle status in surgically resected ESCC
specimens and their clinicopathological significance
The expression of p75NTR was positive (>5% of the
cancer cells were stained in tumor) in 39 of 95 (41.1%) ESCC
specimens, with positive staining observed in the first few layers
of infiltrative margin (Fig. 5A).
Correlation between p75NTR expression and various prognostic
factors is summarized in Table
II. p75NTR was correlated with tumor depth (P=0.032) and
neoadjuvant chemotherapy (P=0.031). However, no significant
correlation was observed between p75NTR expression and other
factors such as age, sex, tumor location, lymph node metastasis,
distant metastasis, TNM classification, histology and postoperative
tumor recurrence. Kaplan-Meier survival curves showed that p75NTR
expression was correlated with a favorable overall survival
(Fig. 5B).
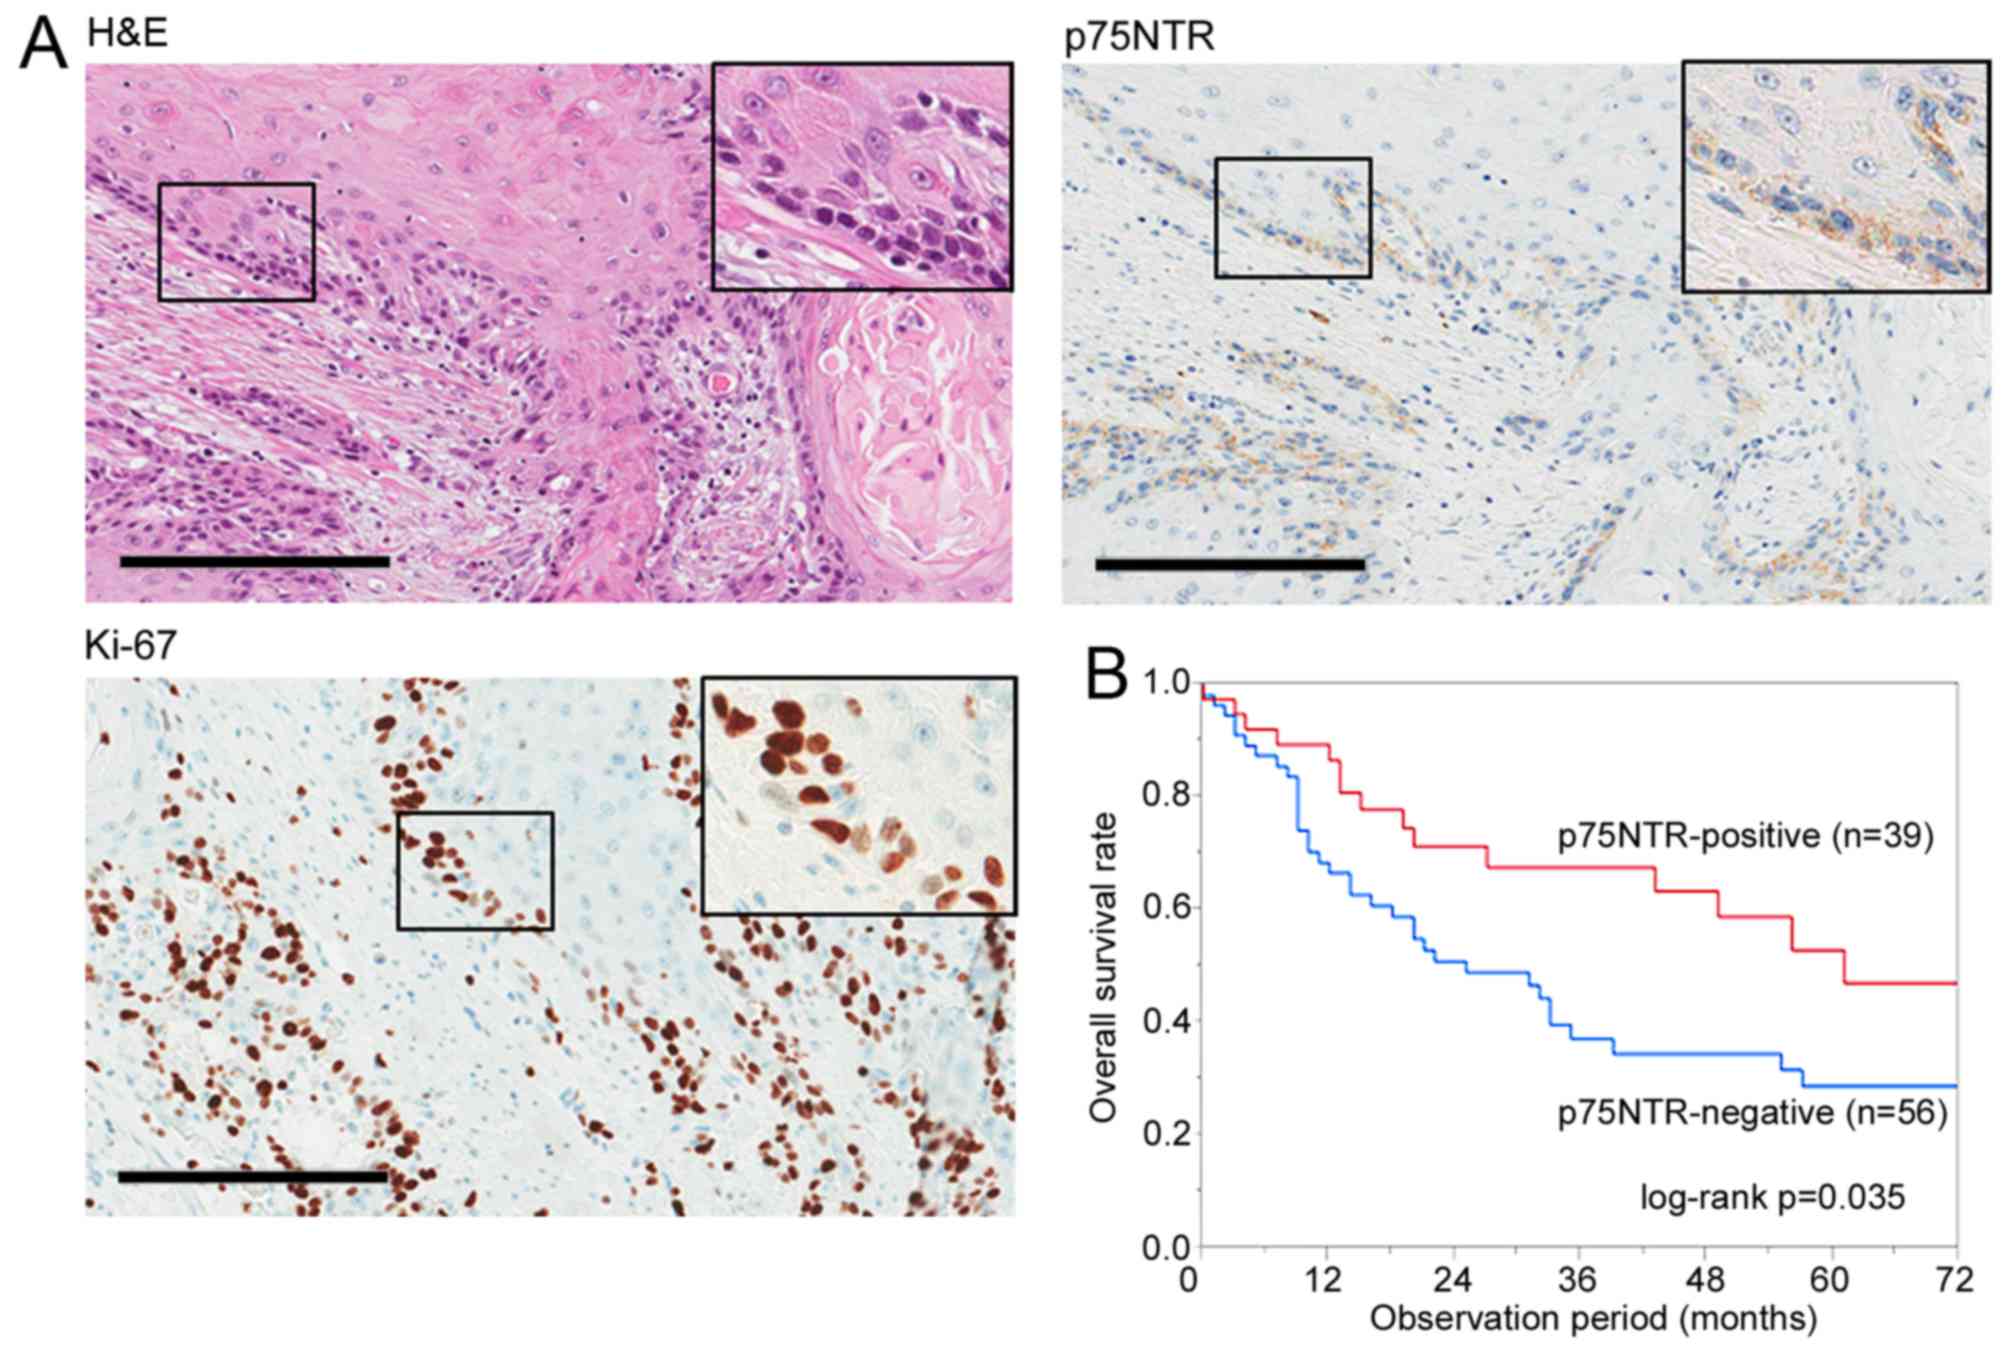 | Figure 5Identification of cell subsets based
on p75NTR expression and cell cycle status in surgically resected
ESCC specimens. (A) Representative results of positive staining for
h&E, p75NTR and Ki-67 in a serial section of a well
differentiated ESCC specimen. Original magnification, ×200; scale
bar, 200 µm. (B) Correlation between p75NTR expression and
overall survival after surgery. In all, 95 patients with ESCC were
analyzed by performing Kaplan-Meier survival analysis (log-rank
test). (C) Representative results of double immunohistochemical
staining of p75NTR (red) and Ki-67 (brown) in a well differentiated
tumor specimen (upper left panel) and a poorly differentiated tumor
specimen (lower left panel). Nuclei were stained with hematoxylin.
The white, red, blue and green arrowheads indicate
p75NTR-positive/Ki-67-negative, p75NTR-positive/Ki-67-positive,
p75NTR-negative/Ki-67-negative and p75NTR-negative/Ki-67-positive
cells, respectively; scale bar, 200 µm. The number of cells
of each subset was counted (right panels). The error bars represent
standard error of mean. (D) Correlation between the proportion of
p75NTR-positive/Ki-67-negative cells in tumors and overall survival
after curative surgery. In all, 20 patients with p75NTR-positive
ESCC tumors were analyzed by performing Kaplan-Meier survival
analysis (log-rank test). |
| Table IIRelationship between p75NTR
expression and clinicopathological characteristics of patients with
ESCC. |
Table II
Relationship between p75NTR
expression and clinicopathological characteristics of patients with
ESCC.
| p75NTR
|
|---|
| Positive
(n=39) | Negative
(n=56) | P-value |
|---|
| Sex |
| Male | 34 | 50 | 0.756 |
| Female | 5 | 6 | |
| Age (years) |
| ≥65 | 23 | 31 | 0.834 |
| <65 | 16 | 25 | |
| Site |
| Ce-Ut | 4 | 6 | 0.943 |
| Mt-Ae | 35 | 50 | |
| pT |
| T1–T2 | 19 | 15 | 0.032a |
| T3–T4 | 20 | 41 | |
| pN |
| N0 | 13 | 22 | 0.667 |
| N1–3 | 26 | 34 | |
| M |
| M0 | 37 | 52 | 0.691 |
| M1 | 2 | 4 | |
| pStage | | | |
| I–II | 20 | 21 | 0.211 |
| III–IV | 19 | 35 | |
| Histology |
| Well-mod | 30 | 46 | 0.601 |
| Poor | 9 | 10 | |
| Neoadjuvant
chemotherapy |
| Yes | 14 | 9 | 0.031a |
| No | 25 | 47 | |
| Postoperative tumor
recurrence |
| Yes | 7 | 17 | 0.231 |
| No | 32 | 39 | |
Double immunohistochemical staining of p75NTR and
Ki-67 was performed in 20 of 39 p75NTR-positive patients who
provided appropriate additional specimens. Representative images of
well differentiated and poorly differentiated tumors are shown in
Fig. 5C. p75NTR-positive staining
was apparent in the first one to two layers from the infiltrative
margin in well differentiated tumors. In contrast, p75NTR-positive
staining was diffusely distributed in poorly differentiated tumors.
Double immunohistochemical staining of p75NTR (red) and Ki-67
(brown) helped in distinguishing p75NTR-positive/Ki-67-negative
(white arrowhead), p75NTR-positive/Ki-67-positive (red arrowhead),
p75NTR-negative/Ki-67-negative (blue arrowhead) and
p75NTR-negative/Ki-67-positive (green arrowhead) cells. The number
of cells belonging to each subset was counted for each section
(Fig. 5C). The median proportion
of p75NTR-positive cells in 20 tumors was 28.7% (range, 12.9–94.0%)
and that of p75NTR-positive/Ki-67-negative cells in 20 tumors was
13.2% (range, 3.0–80.1%).
The relationship between the proportion of
p75NTR-positive/Ki-67-negative cells in tumors and
clinicopathological factors is summarized in Table III. High proportion of
p75NTR-positive/Ki-67-negative cells was correlated with poorly
differentiated histology (P=0.02), postoperative tumor recurrence
(P=0.007) and with the proportion of p75NTR-positive cells in
tumors (P=0.01). Kaplan-Meier survival curves showed a trend of
unfavorable postoperative prognosis in patients who had tumor with
higher proportion of p75NTR-positive/Ki-67-negative cells, although
there was no statistically significant correlation (Fig. 5D).
| Table IIIRelationship between p75NTR and Ki-67
expression and clinicopathological characteristics of patients with
ESCC. |
Table III
Relationship between p75NTR and Ki-67
expression and clinicopathological characteristics of patients with
ESCC.
| Proportion of
p75NTR-positive/Ki-67-negative cells
|
|---|
| Low (<13.2%)
(n=10) | High (≥13.2%)
(n=10) | P-value |
|---|
| Sex |
| Male | 8 | 9 | 0.528 |
| Female | 2 | 1 | |
| Age (years) |
| ≥65 | 4 | 5 | 0.653 |
| <65 | 6 | 5 | |
| Site |
| Ce-Ut | 6 | 5 | 0.653 |
| Mt-Ae | 4 | 5 | |
| pT |
| T1–T2 | 6 | 4 | 0.371 |
| T3–T4 | 4 | 6 | |
| pN |
| N0 | 3 | 1 | 0.255 |
| N1–3 | 7 | 9 | |
| M |
| M0 | 10 | 10 | N/A |
| M1 | 0 | 0 | |
| pStage |
| I–II | 3 | 3 | 1.00 |
| III–IV | 7 | 7 | |
| Histology |
| Well-mod | 8 | 3 | 0.021a |
| Poor | 2 | 7 | |
| Neoadjuvant
chemotherapy |
| Yes | 5 | 6 | 0.653 |
| No | 5 | 4 | |
| Postoperative tumor
recurrence |
| Yes | 1 | 7 | 0.007b |
| No | 9 | 3 | |
| p75NTR-positive
cells (%) |
| Low
(<29.1%) | 8 | 2 | 0.006b |
| high (≥29.1%) | 2 | 8 | |
Discussion
Recent studies involving ESCC cell lines have shown
that p75NTR is expressed in a cell subset possessing CSC properties
such as colony formation ability, tumorigenicity in mouse xenograft
models and chemoresistance (15–18).
However, p75NTR-positive cells are heterogeneous in terms of cell
surface marker expression and cell cycle status (18). Double immunostaining performed in
the present study detected four distinct cell subsets based on the
expression of p75NTR and Ki-67 and showed that 11.4 and 15.7%
KYSE-30 and KYSE-140 cells, respectively, were p75NTR-positive
quiescent cells (which are present in the resting phase of the cell
cycle). Flow cytometric cell sorting based on p75NTR expression and
by using a fluorescent DNA-staining dye showed that
p75NTR-positive/G0-1 cells, but not p75NTR-positive/S-G2-M cells,
showed strong expression of stem-related genes (Nanog, BMI-1 and
p63), high colony formation ability, high tumorigenicity in a mouse
xenograft model, and strong chemoresistance, indicating that
p75NTR-positive/G0-1 cells represented a more enriched CSC
population in ESCC. The above results along with the recent studies
that detected quiescent CSCs with enhanced CSC phenotypes in solid
tumors (9–11), suggest that p75NTR-positive/G0-1
cells are quiescent CSCs in ESCC.
Results of Ki-67 immunocytochemical analysis and
flow cytometric cell cycle analysis did not show a significant
difference between p75NTR-positive and p75NTR-negative cells with
respect to cell cycle distribution. This is consistent with the
results of previous studies on ESCC (18) and pancreatic cancer cell lines
(22), indicating that cell cycle
status alone cannot be used to isolate quiescent CSCs. In the
present study, cell sorting along with the detection of cell cycle
status and proposed CSC marker p75NTR enabled us to differentiate
between quiescent CSCs and quiescent non-CSCs. A previous study
reported that squamous differentiation marker involucrin is highly
expressed in a subpopulation of p75NTR-negative cells, most of
which are in the G0/G1 phase of the cell cycle (18). p75NTR-negative/G0-1 cells were
suggested to include cells that withdrew from the cell cycle as
well as cells that showed squamous differentiation or cellular
senescence.
In the present study, 21.8 and 36.5% p75NTR-positive
KYSE-30 and KYSE-140 cells, respectively, showed Ki-67 negativity.
Flow cytometric analysis showed that 63.0 and 65.2% p75NTR-positive
KYSE-30 and KYSE-140 cells, respectively, were in the G0/G1 phase
of the cell cycle. Ki-67 is a marker of cell proliferation and is
expressed during all the active phases of the cell cycle (G1, S, G2
and M) but is not expressed in resting (G0) cells (23). Flow cytometric cell cycle assays
based on the quantification of DNA content by using DNA-binding
dye-detected cells in the G0/G1, S and G2/m phases (24). Flow cytometric cell cycle assay
performed in the present study showed that ~33.3% (21.8/63.0) and
56.0% (36.5/65.2) p75NTR-positive KYSE-30 and KYSE-140 cells,
respectively, were in the G0 phase. A novel assay system that
enables the isolation of viable CSCs in the G0 phase may allow more
precise characterization of quiescent CSCs.
In previous studies, slow-cycling CSCs were detected
by performing label-retention assays with thymidine analog BrdU,
which incorporates into newly synthesized DNA, or with lipophilic
labeling dyes such as DiI and PKH26, which incorporate into the
cell membrane (9–11). After several weeks in culture,
infrequently dividing slow-cycling cells that retain originally
incorporated labels are detected as label-retaining cells; in
contrast, label concentration decreases in fast-cycling bulk tumor
cells after each round of cell division (25). In the present study, absence of
Ki-67 immunoreactivity and detection of cells in the G0 phase
indicate quiescence of cells just at the time of analysis but does
not indicate a continuously slow-cycling phenotype, which depends
on the doubling time of quiescent cells (i.e., the duration for
which the cells stay in the resting phase of the cell cycle).
However, results of label-retention assay performed in the present
study by using a fluorescent cell-tracing reagent showed
label-retention in 3.4% p75NTR-positive cells, but not in
p75NTR-negative cells, suggesting relatively slow cycling of some
p75NTR-positive/G0-1 cells. We performed flow cytometric cell
sorting based on p75NTR expression and by using DNA-staining dye
DCV to isolate cells in specific phases of the cell cycle. DCV is a
fluorescent dye with low cytotoxicity that enters living cells and
selectively binds to DNA without fixation and permeabilization,
thus, enabling the isolation of viable cells and assessment of
their biological phenotypes (24).
To the best of our knowledge, the present study is the first to
isolate and characterize candidate quiescent CSCs in ESCC, thus,
providing a novel target for investigating molecular mechanisms
regulating quiescent CSCs and for developing novel therapeutic
strategies.
Results of real-time PCR performed in the present
study showed strong Nanog, BMI-1 and p63 expression in
p75NTR-positive/G0-1 cells. Nanog is an embryonic pluripotency
marker associated with the stem cell-like phenotype of CSCs
(26). BMI-1 plays a crucial role
in the self-renewal of CSCs in different cancers, including
esophageal cancer (27,28). p63 encoded by the oncogene TP63
regulates the growth and invasion of ESCC (29,30).
These findings suggest that Nanog, BMI-1 and p63 regulate
p75NTR-positive/G0-1 cells. NGF/proNGF/p75NTR axis plays a critical
role in regulating the self-renewal of quiescent CSCs in breast
cancer (31). Overexpression of
NGF and its autocrine loop enhances the proliferation and migration
of ESCC cell lines (32),
suggesting that p75NTR signaling plays a role in the regulation of
quiescent p75NTR-positive/G0-1 cells.
In the present study, p75NTR-positive/G0-1 cells
showed strong chemoresistance to CDDP. CDDP is one of the most
effective anticancer drugs widely used in the first-line therapy of
several cancers, including ESCC (3,33).
Because CDDP targets rapidly proliferating tumor cells (34), it generally does not affect
quiescent CSCs. However, resistance to chemotherapies depends not
only on cell quiescence but also on various molecular pathways in
tumor cells (35). In this study,
p75NTR-positive/G0-1 cells showed strong expression of ABCG2 and
ERCC1. ABCG2 is an efflux transporter involved in multidrug
resistance, and its overexpression is associated with response to
chemotherapy and prognosis in ESCC (36). ERCC1 is involved in nucleotide
excision repair pathway that modulates the efficacy of
platinum-based chemotherapies by removing drug-induced DNA damage
(37). In ESCC, expression of
polymorphism in ERCC1 is a predictor of CDDP-based chemotherapy
(38–40). Stem cell-related genes that were
strongly expressed in p75NTR-positive/G0-1 cells, such as Nanog and
BMI-1, are also involved in chemoresistance in different cancers
(41–43). These findings strongly suggest that
p75NTR-positive/G0-1 cells are responsible for resistance to
CDDP-based chemotherapy in ESCC.
Immunohistochemical staining of surgically resected
ESCC specimens showed p75NTR-positive (>5% of the tumor cells
were stained) in 41.1% patients who showed favorable postoperative
survival, which is consistent with the results of previous studies
(15,18). Moreover, p75NTR expression was
significantly correlated with neoadjuvant chemotherapy, suggesting
possible induction of p75NTR expression or selective survival of
chemoresistant p75NTR-positive cells during chemotherapy. On the
other hand, clinical significance of very small number of the cells
with p75NTR expression (when ≤5% of the cancer cells were stained
in a tumor) remains to be addressed. In addition, as was shown in a
previous report, the expression of p75NTR decreases during
progression of cancer in about half of ESCC tumors, resulting in
complete loss of the expression in some cases (20). Therefore, other CSC markers are
needed in tumors in which the expression of p75NTR is completely
lost.
Double immunohistochemical staining of
p75NTR-positive ESCC specimens detected
p75NTR-positive/Ki-67-negative quiescent cells, with a median
proportion of 13.2% cells (range, 3.0–80.1%), which is consistent
with the distribution of p75NTR-positive/Ki-67-negative KYSE cells
both in vitro and in vivo. In addition, the
proportion of p75NTR-positive/Ki-67-negative cells was correlated
with poorly differentiated histology and postoperative tumor
recurrence, indicating that these cells represented relatively
immature cells and are responsible for malignant potential in ESCC.
Kaplan-Meier survival curves showed that patients with tumors
having a high proportion of p75NTR-positive/Ki-67-negative cells
showed poor survival; however, the correlation was not
statistically significant. These results suggest that
p75NTR-positive/Ki-67-negative cells in ESCC possess quiescent CSC
phenotypes similar to cultured KYSE cells. Further studies
involving a large number of patients, extended follow-up, isolation
of viable p75NTR-positive quiescent cells from fresh tumor samples
may help elucidate the biological characteristics and clinical
significance of quiescent CSCs.
In addition to p75NTR, CD44 (44) and CD90 (45) have been reported to be putative CSC
markers in ESCC. In a previous report from our laboratory (18), the p75NTR-positive CD44-negative
fraction of KYSE-30 possessed CSC properties, such as stem
cell-related gene expression, lower expression of differentiation
markers, drug resistance and in vivo tumorigenicity.
Furthermore, the majority of p75NTR-positive/CD44-negative cells
were in a mitotically quiescent state, while
p75NTR-positive/CD44-positive cells were actively proliferating.
Similarly, the p75NTR-positive/CD90-negative subset was mitotically
quiescent cells, while the p75NTR-positive/CD90-positive subset was
actively proliferating. These observations indicate that
p75NTR-positive/G0-1 fraction in this study is a specific
subpopulation of ESCC with quiescent CSC properties, which cannot
be identified using CD44 or CD90.
In conclusion, flow cytometric cell sorting based on
p75NTR expression and cell cycle status helped in isolating and
characterizing candidate quiescent CSCs from ESCC cell lines. These
cells showed enhanced tumorigenicity and strong chemoresistance.
Immunohistochemical examination detected small number of
p75NTR-positive/Ki-67-negative cells in surgically resected ESCC
specimens and indicate that these cells were associated with poorly
differentiated histology of ESCC tumor. The results of the present
study indicate that quiescent CSCs can be used as targets for
investigating molecular process regulating quiescent CSC phenotypes
and for developing novel therapeutic strategies.
Acknowledgments
The present study was supported by the Grant-in-Aid
for Scientific Research (C) MEXT KAKENHI (grant nos. 15K10088 and
15K10089). This study was also supported by the MEXT Translational
Research Network Program (A-29).
References
|
1
|
Rice TW, Rusch VW, Apperson-Hansen C,
Allen MS, Chen LQ, Hunter JG, Kesler KA, Law S, Lerut TE, Reed CE,
et al: Worldwide esophageal cancer collaboration. Dis Esophagus.
22:1–8. 2009. View Article : Google Scholar : PubMed/NCBI
|
|
2
|
Thallinger CM, Raderer M and Hejna M:
Esophageal cancer: A critical evaluation of systemic second-line
therapy. J Clin Oncol. 29:4709–4714. 2011. View Article : Google Scholar : PubMed/NCBI
|
|
3
|
Ando N, Kato H, Igaki H, Shinoda M, Ozawa
S, Shimizu H, Nakamura T, Yabusaki H, Aoyama N, Kurita A, et al: A
randomized trial comparing postoperative adjuvant chemotherapy with
cisplatin and 5-fluorouracil versus preoperative chemotherapy for
localized advanced squamous cell carcinoma of the thoracic
esophagus (JCOG9907). Ann Surg Oncol. 19:68–74. 2012. View Article : Google Scholar
|
|
4
|
Dalerba P and Clarke MF: Cancer stem cells
and tumor metastasis: First steps into uncharted territory. Cell
Stem Cell. 1:241–242. 2007. View Article : Google Scholar
|
|
5
|
Clarke MF and Fuller M: Stem cells and
cancer: Two faces of eve. Cell. 124:1111–1115. 2006. View Article : Google Scholar : PubMed/NCBI
|
|
6
|
Reya T and Clevers H: Wnt signalling in
stem cells and cancer. Nature. 434:843–850. 2005. View Article : Google Scholar : PubMed/NCBI
|
|
7
|
D'Angelo RC and Wicha MS: Stem cells in
normal development and cancer. Prog mol Biol Transl Sci.
95:113–158. 2010. View Article : Google Scholar : PubMed/NCBI
|
|
8
|
Dean M, Fojo T and Bates S: Tumour stem
cells and drug resistance. Nat Rev Cancer. 5:275–284. 2005.
View Article : Google Scholar : PubMed/NCBI
|
|
9
|
Roesch A, Fukunaga-Kalabis M, Schmidt EC,
Zabierowski SE, Brafford PA, Vultur A, Basu D, Gimotty P, Vogt T
and Herlyn M: A temporarily distinct subpopulation of slow-cycling
melanoma cells is required for continuous tumor growth. Cell.
141:583–594. 2010. View Article : Google Scholar : PubMed/NCBI
|
|
10
|
Pece S, Tosoni D, Confalonieri S, Mazzarol
G, Vecchi M, Ronzoni S, Bernard L, Viale G, Pelicci PG and Di Fiore
PP: Biological and molecular heterogeneity of breast cancers
correlates with their cancer stem cell content. Cell. 140:62–73.
2010. View Article : Google Scholar : PubMed/NCBI
|
|
11
|
Dembinski JL and Krauss S:
Characterization and functional analysis of a slow cycling stem
cell-like subpopulation in pancreas adenocarcinoma. Clin Exp
Metastasis. 26:611–623. 2009. View Article : Google Scholar : PubMed/NCBI
|
|
12
|
Chen W, Dong J, Haiech J, Kilhoffer MC and
Zeniou M: Cancer stem cell quiescence and plasticity as major
challenges in cancer therapy. Stem Cells Int. 2016:17409362016.
View Article : Google Scholar : PubMed/NCBI
|
|
13
|
Adorno-Cruz V, Kibria G, Liu X, Doherty M,
Junk DJ, Guan D, Hubert C, Venere M, Mulkearns-Hubert E, Sinyuk M,
et al: Cancer stem cells: Targeting the roots of cancer, seeds of
metastasis, and sources of therapy resistance. Cancer Res.
75:924–929. 2015. View Article : Google Scholar : PubMed/NCBI
|
|
14
|
Li L and Bhatia R: Stem cell quiescence.
Clin Cancer Res. 17:4936–4941. 2011. View Article : Google Scholar : PubMed/NCBI
|
|
15
|
Okumura T, Tsunoda S, Mori Y, Ito T,
Kikuchi K, Wang TC, Yasumoto S and Shimada Y: The biological role
of the low-affinity p75 neurotrophin receptor in esophageal
squamous cell carcinoma. Clin Cancer Res. 12:5096–5103. 2006.
View Article : Google Scholar : PubMed/NCBI
|
|
16
|
Huang SD, Yuan Y, Liu XH, Gong DJ, Bai CG,
Wang F, Luo JH and Xu ZY: Self-renewal and chemotherapy resistance
of p75NTR positive cells in esophageal squamous cell carcinomas.
BMC Cancer. 9:92009. View Article : Google Scholar : PubMed/NCBI
|
|
17
|
Li S, Yue D, Chen X, Wang L, Li J, Ping Y,
Gao Q, Wang D,, Zhang T, Li F, et al: Epigenetic regulation of
CD271, a potential cancer stem cell marker associated with
chemoresistance and metastatic capacity. Oncol Rep. 33:425–432.
2015.
|
|
18
|
Yamaguchi T, Okumura T, Hirano K, Watanabe
T, Nagata T, Shimada Y and Tsukada K: p75 neurotrophin receptor
expression is a characteristic of the mitotically quiescent cancer
stem cell population present in esophageal squamous cell carcinoma.
Int J Oncol. 48:1943–1954. 2016.PubMed/NCBI
|
|
19
|
Okumura T, Shimada Y, Imamura M and
Yasumoto S: Neurotrophin receptor p75 (NTR) characterizes human
esophageal keratinocyte stem cells in vitro. Oncogene.
22:4017–4026. 2003. View Article : Google Scholar : PubMed/NCBI
|
|
20
|
Okumura T, Shimada Y, Sakurai T, Hori R,
Nagata T, Sakai Y and Tsukada K: Abnormal cell proliferation in the
p75NTR-positive basal cell compartment of the esophageal epithelium
during squamous carcinogenesis. Dis Esophagus. 28:634–643. 2015.
View Article : Google Scholar
|
|
21
|
Shimada Y, Imamura M, Wagata T, Yamaguchi
N and Tobe T: Characterization of 21 newly established esophageal
cancer cell lines. Cancer. 69:277–284. 1992. View Article : Google Scholar : PubMed/NCBI
|
|
22
|
Li C, Heidt DG, Dalerba P, Burant CF,
Zhang L, Adsay V, Wicha M, Clarke MF and Simeone DM: Identification
of pancreatic cancer stem cells. Cancer Res. 67:1030–1037. 2007.
View Article : Google Scholar : PubMed/NCBI
|
|
23
|
Scholzen T and Gerdes J: The Ki-67
protein: From the known and the unknown. J Cell Physiol.
182:311–322. 2000. View Article : Google Scholar : PubMed/NCBI
|
|
24
|
Bradford JA and Clarke ST: Dual-pulse
labeling using 5-ethynyl-2′-deoxyuridine (Edu) and
5-bromo-2′-deoxyuridine (Brdu) in flow cytometry. Curr Protoc
Cytom. 55:7.38.1–7.38.15. 2011.
|
|
25
|
Hsu YC and Fuchs E: A family business:
Stem cell progeny join the niche to regulate homeostasis. Nat Rev
Mol Cell Biol. 13:103–114. 2012. View
Article : Google Scholar : PubMed/NCBI
|
|
26
|
Hadjimichael C, Chanoumidou K,
Papadopoulou N, Arampatzi P, Papamatheakis J and Kretsovali A:
Common stemness regulators of embryonic and cancer stem cells.
World J Stem Cells. 7:1150–1184. 2015.PubMed/NCBI
|
|
27
|
Oren O and Smith BD: Eliminating cancer
stem cells by targeting embryonic signaling pathways. Stem Cell
Rev. 13:17–23. 2017. View Article : Google Scholar
|
|
28
|
Yu X, Jiang X, Li H, Guo L, Jiang W and Lu
SH: miR-203 inhibits the proliferation and self-renewal of
esophageal cancer stem-like cells by suppressing stem renewal
factor Bmi-1. Stem Cells Dev. 23:576–585. 2014. View Article : Google Scholar
|
|
29
|
Lee KB, Ye S, Park MH, Park BH, Lee JS and
Kim SM: p63-Mediated activation of the β-catenin/c-Myc signaling
pathway stimulates esophageal squamous carcinoma cell invasion and
metastasis. Cancer Lett. 353:124–132. 2014. View Article : Google Scholar : PubMed/NCBI
|
|
30
|
Ye S, Lee KB, Park MH, Lee JS and Kim SM:
p63 regulates growth of esophageal squamous carcinoma cells via the
Akt signaling pathway. Int J Oncol. 44:2153–2159. 2014.PubMed/NCBI
|
|
31
|
Tomellini E, Touil Y, Lagadec C, Julien S,
Ostyn P, Ziental-Gelus N, Meignan S, Lengrand J, Adriaenssens E,
Polakowska R, et al: Nerve growth factor and proNGF simultaneously
promote symmetric self-renewal, quiescence, and epithelial to
mesenchymal transition to enlarge the breast cancer stem cell
compartment. Stem Cells. 33:342–353. 2015. View Article : Google Scholar
|
|
32
|
Tsunoda S, Okumura T, Ito T, Mori Y, Soma
T, Watanabe G, Kaganoi J, Itami A, Sakai Y and Shimada Y:
Significance of nerve growth factor overexpression and its
autocrine loop in oesophageal squamous cell carcinoma. Br J Cancer.
95:322–330. 2006. View Article : Google Scholar : PubMed/NCBI
|
|
33
|
van Hagen P, Hulshof MC, van Lanschot JJ,
Steyerberg EW, van Berge Henegouwen MI, Wijnhoven BP, Richel DJ,
Nieuwenhuijzen GA, Hospers GA, Bonenkamp JJ, et al CROSS Group:
Preoperative chemoradiotherapy for esophageal or junctional cancer.
N Engl J Med. 366:2074–2084. 2012. View Article : Google Scholar : PubMed/NCBI
|
|
34
|
Yuan L, Yu WM, Yuan Z, Haudenschild CC and
Qu CK: Role of ShP-2 tyrosine phosphatase in the DNA damage-induced
cell death response. J Biol Chem. 278:15208–15216. 2003. View Article : Google Scholar : PubMed/NCBI
|
|
35
|
Galluzzi L, Senovilla L, Zitvogel L and
Kroemer G: The secret ally: Immunostimulation by anticancer drugs.
Nat Rev Drug Discov. 11:215–233. 2012. View
Article : Google Scholar : PubMed/NCBI
|
|
36
|
Tsunoda S, Okumura T, Ito T, Kondo K,
Ortiz C, Tanaka E, Watanabe G, Itami A, Sakai Y and Shimada Y:
ABCG2 expression is an independent unfavorable prognostic factor in
esophageal squamous cell carcinoma. Oncology. 71:251–258. 2006.
View Article : Google Scholar
|
|
37
|
Furuta T, Ueda T, Aune G, Sarasin A,
Kraemer KH and Pommier Y: Transcription-coupled nucleotide excision
repair as a determinant of cisplatin sensitivity of human cells.
Cancer Res. 62:4899–4902. 2002.PubMed/NCBI
|
|
38
|
Huang J, Zhou Y, Zhang H, Qu T, Mao Y, Zhu
H, Quan L, Xing P, Wang J, He J, et al: A phase II study of
biweekly paclitaxel and cisplatin chemotherapy for recurrent or
metastatic esophageal squamous cell carcinoma: ERCC1 expression
predicts response to chemotherapy. Med Oncol. 30:3432013.
View Article : Google Scholar
|
|
39
|
Chen WH, Xin PL, Pan QX, Chen YY, Wang CR,
Zhang ZS, Chen YF, Zhang CY and Cai WJ: ERCC1 single nucleotide
polymorphism C8092A, but not its expression is associated with
survival of esophageal squamous cell carcinoma patients from Fujian
province, China. PLoS One. 9:e1066002014. View Article : Google Scholar : PubMed/NCBI
|
|
40
|
Yu X, Xiao H, Zhao B, Zhang X and Wang G:
DNA repair gene ERCC1 C118T polymorphism predicts sensitivity of
recurrent esophageal cancer to radiochemotherapy in a Chinese
population. Thorac Cancer. 6:741–748. 2015. View Article : Google Scholar : PubMed/NCBI
|
|
41
|
Yang L, Zhang X, Zhang M, Zhang J, Sheng
Y, Sun X, Chen Q and Wang LX: Increased Nanog expression promotes
tumor development and Cisplatin resistance in human esophageal
cancer cells. Cell Physiol Biochem. 30:943–952. 2012. View Article : Google Scholar : PubMed/NCBI
|
|
42
|
Yin T, Wei H, Leng Z, Yang Z, Gou S, Wu H,
Zhao G, Hu X and Wang C: Bmi-1 promotes the chemoresistance,
invasion and tumorigenesis of pancreatic cancer cells.
Chemotherapy. 57:488–496. 2011. View Article : Google Scholar
|
|
43
|
Banerjee Mustafi S, Chakraborty PK, Naz S,
Dwivedi SK, Street M, Basak R, Yang D, Ding K, Mukherjee P and
Bhattacharya R: MDR1 mediated chemoresistance: BMI1 and TIP60 in
action. Biochim Biophys Acta. 1859:983–993. 2016. View Article : Google Scholar : PubMed/NCBI
|
|
44
|
Zhao JS, Li WJ, Ge D, Zhang PJ, Li JJ, Lu
CL, Ji XD, Guan DX, Gao H, Xu LY, et al: Tumor initiating cells in
esophageal squamous cell carcinomas express high levels of CD44.
PLoS One. 6:e214192011. View Article : Google Scholar : PubMed/NCBI
|
|
45
|
Tang KH, Dai YD, Tong M, Chan YP, Kwan PS,
Fu L, Qin YR, Tsao SW, Lung HL, Lung ML, et al: A CD90+
tumor-initiating cell population with an aggressive signature and
metastatic capacity in esophageal cancer. Cancer Res. 73:2322–2332.
2013. View Article : Google Scholar : PubMed/NCBI
|