Introduction
Over 100 years ago, lung cancer was a very rare
disease. In 1912, Isaac Adler's first monograph 'Primary malignant
growths of the lungs and bronchi: a pathological and clinical
study' was published, and it focused on lung cancer in which the
author analyzed 374 cases of lung cancer (1). Since that time, a significant
increase in lung cancer incidence has been observed (2,3).
Currently, epidemiological data indicate that lung cancer is the
leading cause of cancer-related mortality worldwide, with an
estimation of over 1.8 million new diagnosed cases and 1.6 million
deaths from lung cancer annually (4). An improvement in the diagnosis and
treatment of lung cancer has been achieved over the past decades;
however, the 5-year survival rate for this type of cancer is only
18%, which is poor compared with that for other types of cancer
(5). Such a poor outcome in lung
cancer treatment is a result of the advanced stage of the disease
at the time of diagnosis. While early-stage cancer is managed
primarily with surgical resection, followed by adjuvant
chemotherapy, advanced-stage lung cancer usually remains incurable,
with patients being supported only with palliative care. Therefore,
a number of treatment concepts and schedules are investigated and
being developed globally, beginning from basic research aiming at
understanding the molecular events driving lung cancer to novel
therapeutic approaches and strategies (6).
Over the past decades, much research has focused on
the anticancer activity of vitamin D, as it was discovered that
calcitriol [1,25(OH)2D3], a hormonally active
form of vitamin D3, regulates a number of signaling
pathways that drive breast cancer, colon cancer, prostate cancer,
melanoma and other types of cancer (7,8).
1,25(OH)2D3 and different vitamin D analogs
have also been shown to possess anti-proliferative activity against
lung cancer cells that express vitamin D receptor (VDR) (9,10).
Moreover, studies using animal models have indicated that
1,25(OH)2D3 decreases the metastatic
potential of Lewis lung cancer (LLC) cells and augment the immune
response against cancer (11,12).
Other studies have revealed that vitamin D supplementation
decreases the frequency of lung cancer induced by using various
carcinogens in laboratory animals (13,14).
In addition, 1,25(OH)2D3 is able to inhibit
the metastasis of B16 melanoma cells into the lungs (15).
By regulating proliferation, differentiation and
apoptosis, as well as angiogenesis,
1,25(OH)2D3 exhibits anti-neoplastic activity
(7).
1,25(OH)2D3 influences angiogenesis by
exerting direct anti-proliferative effects on tumor-derived
endothelial cells or via the downregulation of the expression of
vascular endothelial growth factor (VEGF) or interleukin (IL)-8 in
several malignant cells (16–18).
These data suggest that 1,25(OH)2D3 or its
analogs may be very important agents in the anti-angiogenic therapy
of cancers.
In a number of types of cancer, including non-small
cell lung cancer (NSCLC), targeting tumor angiogenesis is widely
developed since neovascularization is essential for tumor growth,
progression and metastasis (19).
One of the main pro-angiogenic pathways described is VEGF signaling
(20). There are, in general, two
main approaches used in interfering with tumor angiogenesis and
these are as follows: i) the use of high molecular weight
monoclonal antibodies binding circulating VEGF or its receptors
(VEGFRs) present in the cell membranes of endothelial cells; and
ii) small-molecule tyrosine kinase inhibitors (TKIs) that bind and
block the activity of VEGF receptors (19). Bevacizumab (Avastin, Hoffmann-La
Roche Ltd., Basel, Switzerland) is one of the most well-known
anti-VEGF monoclonal antibodies. In an Eastern Cooperative Oncology
Group (ECOG) clinical trial involving 878 patients with recurrent
or advanced NSCLC, bevacizumab in combination with platinum-based
chemotherapy was shown to improve survival compared to chemotherapy
alone (21,22). In the case of TKIs, there is a
growing number of newly synthesized and studied inhibitors that not
only target VEGFRs, but also simultaneously target other kinases
[e.g., c-kit, platelet-derived growth factor receptor (PDGFR),
fibroblast growth factor receptor (FGFR) and RET]. Among these
inhibitors, nintedanib was the first agent to demonstrate improved
survival in the second-line treatment of patients with
adenocarcinoma NSCLC (19,23).
Treatment with sunitinib (inhibitor of VEGFR1-3,
PDGFRα and β RET) and other multi-target drugs, is accompanied by
certain adverse effects (19).
Therefore, combining sunitinib at lower doses with other
chemotherapeutic agents may be used to avoid undesirable
side-effects, while revealing synergistic activity (24). Second, tumors develop resistance to
anti-angiogenic treatment, activating alternative pathways that
promote angiogenesis; therefore, studies on drug combinations
targeting several signaling pathways may provide means of better
controlling tumor angiogenesis (25). Third, despite the introduction of
anti-angiogenic drugs to clinical practice, there has still been a
high failure rate of trials with anti-angiogenic agents. Due to the
heterogeneous nature of lung cancer in NSCLC, some patients are
more likely to respond to anti-angiogenic drugs than others, which
may explain the failure of some clinical trials (19 and refs
therein).
Vitamin D compounds have been previously tested in
our laboratory for their anti-proliferative and anticancer
activities in different cancer models both in vitro and
in vivo, mainly in breast cancer, colorectal cancer and
leukemia, where vitamin D analogs exhibited anticancer activity
alone or potentiated the activity of standard cytostatics (26–32).
In the present study, we wished to examine the activity of the
vitamin D compounds, 1,24(OH)2D3 (PRI-2191)
and 1,25(OH)2D3, in combination with two TKIs
(imatinib and sunitinib) and two cytostatic drugs (cisplatin and
docetaxel) in A549 lung cancer cells and human lung microvascular
endothelial cells (HLMECs).
Materials and methods
Cell culture
The lung cancer cell line, A549, was obtained from
the American Type Culture Collection (ATCC, Bethesda MD, USA).
HLMECs (which had been already immortalized by transfection with
pSV3-neoplasmid containing large T-antigen gene) were a kind gift
from Professor Claudine Kieda (Center for Molecular Biophysics,
Orleans, France) (33). The cell
lines were maintained at the Cell Culture Collection Division of
Hirszfeld Institute of Immunology and Experimental Therapy, Polish
Academy of Sciences in Wroclaw, Poland. The A549 cells were
cultured in OptiMEM + RPMI-1640 (1:1) medium [PChO; Institute of
Immunology and Experimental Therapy (IIET), Polish Academy of
Sciences (PAS), Wroclaw, Poland], containing 5% fetal bovine serum
(FBS) and 2 mM L-glutamine (Sigma-Aldrich, Steinheim, Germany). The
HLMECs were cultured in RPMI-1640 (PChO, IIET, PAS, Wroclaw,
Poland) with the addition of 10% FBS and 2 mM L-glutamine
(Sigma-Aldrich). Both culture media were supplemented with the
following antibiotics: streptomycin and penicillin (Polfa
Tarchomin, Warsaw, Poland). The cells were cultured in an auto flow
water jacket CO2 incubator (NuAire, Plymouth, MN, USA)
at 37°C and in a humidified atmosphere saturated with 5%
CO2.
Compounds
Vitamin D3 metabolites, such as
calcitriol [1,25-dihydroxy vitamin D3,
1,25(OH)2D3] and PRI-2191
(24R)-1,24-dihydroxy vitamin D3
[1,24(OH)2D3, tacalcitol] (31) were certified synthetic materials
provided by the Pharmaceutical Research Institute (Warsaw, Poland).
Imatinib mesylate (also termed Gleevec or GV) was obtained from the
Pharmaceutical Research Institute. Sunitinib malate (also termed
SU) and docetaxel (also termed DTX) were obtained from AK
Scientific Inc. (Union City, CA, USA). Cisplatin (also termed CIS)
was obtained from Accord Healthcare Poland (Warsaw, Poland).
Prior to in vitro usage, the vitamin D
compounds were dissolved in 99.8% ethanol (Avantor, Gliwice,
Poland). Imatinib mesylate was dissolved in aqua pro injection
(Polpharma, Starogard Gdanski, Poland). Sunitinib malate and
docetaxel were dissolved in dimethyl sulfoxide (DMSO)
(Avantor).
Prior to in vivo usage, the vitamin D analog
1,24(OH)2D3 was dissolved in 99.8% ethanol
(Avantor), then diluted in 80% polyethylene glycol (Sigma-Aldrich)
to reach the required concentrations, and then administered to mice
at a volume of 5 μl/g/body weight. SU was diluted in 0.1 M
citrate buffer (pH 3.5) (PChO, IIET PAS) to reach the required
concentrations and was administered to mice at a volume of 10
μl/g/body weight. DTX was dissolved in a mixture of
cremophor + ethanol (0.36 ml + 0.64 ml) and then in saline (1:9)
(cremophor from Sigma-Aldrich; ethanol 96% from Avantor; saline
from PChO, IIET PAS) and was administered to the mice at a volume
of 10 μl/g/body weight.
Determination of anti-proliferative
activity
Using sulforhodamine B (SRB) assay, the cytotoxic
activity of the test compounds and their combinations against the
A549 cells and HLMECs was evaluated. First, the cells were exposed
to each agent alone in the range of serial dilutions for 72 h.
Simultaneously, the cells were exposed to solvents used, such as
EtOH and DMSO (Avantor) in the same serial dilutions as with the
test agents. Following incubation, cells were fixed with 50%
trichloroacetic acid (TCA) (Avantor) for 1 h followed by washing
with tap water. The cells were then stained for 30 min with 0.1%
SRB (Sigma-Aldrich) in 1% acetic acid (Avantor); the excess of SRB
was washed out with 1% acetic acid. The dye bound to the cells was
extracted with 10 mM TRIS-base [Tris(hydroxymethyl)aminomethane]
(Sigma-Aldrich), and the absorbance of each solution was measured
at 540 nm wavelength in Synergy H4 Hybrid Multi-Mode microplate
reader (BioTek Instruments, Inc., Winooski, VT, USA). Using
Cheburator 0.4, Dmitry Nevozhay software, the 50% inhibitory
concentration (IC50) was calculated, as previously
described (34). Based on the
calculated IC50 value, the concentrations of a given TKI
and cytostatic were set following the rule of 'fixed constant
ratio' (35,36). Vitamin D compounds were used at the
concentration of 100 nM. The cells were then exposed to various
combinations of each vitamin D compound with each TKI and/or
cytostatic tested for 72 h; using SRB assay, the anti-proliferative
activity was measured again, and the proliferation inhibition was
calculated as follows: % proliferation inhibition =
−[(Abscontrol − Absmed)/(Abstest −
Absmed)×100−100], where Abs control is the absorbance of
the control cells, Absmed is the absorbance of the
culture medium and Abstest is the absorbance for the
test agent or combination treatment.
The experiments were repeated at least thrice in
separate courses. Based on the calculated percentage of
proliferation inhibition, the effects of the combination of the
test compounds (synergism, additive effect and antagonism) were
assessed using the combination index (CI) calculated as previously
described by Chou and Talalay (37,38)
with CalcuSyn Version 2.1 software (Biosoft, Cambridge, UK). If the
CI >1.2, the effect observed was antagonistic, and the CI from
the range of 0.8–1.2 depicted an additive effect and a CI <0.8
depicted synergism.
Cell cycle and cell death analysis
The A549 cells and HLMECs were seeded in 24-well
plates (Corning Inc., Corning NY, USA) in culture medium. After 24
h, the compounds in different combinations were added and the cells
were exposed to these compounds for 72 h. The cells were then
collected, washed in phosphate-buffered saline (PBS) (PChO, IIET
PAS), and preserved in 70% ethanol (Avantor) at −20°C for at least
24 h. The cells were then washed in PBS and then incubated at +37°C
for 1 h with 8 μg/ml RNase (Thermo Fisher Scientific,
Waltham MA, USA). Subsequently, the cells were incubated for 30 min
with 50 μl of 0.1 mg/ml propidium iodide (Sigma-Aldrich) and
analyzed using a flow cytometer BD LSR Fortessa with FACS Diva
Software (Becton-Dickinson, San Jose, CA, USA). The experiment was
repeated at least thrice.
Caspase-3 activity assay
Caspase-3 activity was analyzed based on its
enzymatic activity of the hydrolysis of synthetic substrate
Ac-DEVD-ACC leading to the release of 7-amino-coumarin
fluorochrome, with the measurement of the fluorescence intensity in
time (39). Therefore, the A549
cells and HLMECs were seeded in 24-well plates, and after 24 h, the
test compounds were added to the cells alone or in different
combinations for 72 h. The culture medium was then discarded and
the cells were lysed for 30 min at +4°C in 50 mM HEPES buffer (pH
7.5) containing 10% saccharose, 150 mM NaCl, 5 mM EDTA, 10 mM
DL-dithiothreitol (DTT), 0.1% Triton X-100 (DTT was added ex
tempore) (Sigma-Aldrich). The 20 mM HEPES reaction buffer (pH
7.5) containing 10% saccharose, 100 mM NaCl, 1 mM EDTA and 10 mM
DTT (DTT was added ex tempore) and 10 μM Ac-DEVD-ACC
synthetic substrate (added ex tempore) (Wroclaw University
of Technology, Wroclaw, Poland) were prepared and warmed up to
+37°C in dark prior to use. Subsequently, 40 μl of each cell
lysate were transferred to 96-well white plates (Corning,
Amsterdam, The Netherlands), followed by the addition of 160
μl Ac-DEVD-ACC containing reaction buffer. The increase in
fluorescence intensity was measured at λ=355 and λ=460 nm within 2
h every 10 min at +37°C in Synergy H4 Hybrid Multi-Mode microplate
reader with Gen5 1.11.5 software (BioTek Instruments, Inc.). The
kinetic of the reaction was calculated as relative fluorescence
units (RFU)/min. In order to normalize the obtained results of
caspase-3 activity to the number of cells, SRB assay was performed
in parallel 24-well plates of cultured cells exposed to analogous
combinations of the test compounds for 72 h. Experiments were
repeated at least thrice in separate courses.
Western blot analysis
The A549 cells and HLMECs exposed for 72 h to
different combinations of GV, SU, CIS, DTX and vitamin D compounds
were lysed in RIPA buffer (Sigma-Aldrich) supplemented with
protease and phosphatase inhibitor cocktails (Sigma-Aldrich)
followed by centrifugation for 10 min at +4°C and 11,000 × g.
Tumors harvested from the mice (see below) following storage at
−80°C were homogenized (Tissue and Cell Homogenizer FastPrep-24, MP
Biomedicals, Warsaw, Poland) in RIPA buffer containing protease
inhibitor cocktail (Sigma-Aldrich). The homogenates were then
centrifuged twice for 10 min at +4°C and 11,000 × g and the
supernatants were then transferred to new tubes. The total protein
concentration in the cell and tissue lysates was measured using the
modified Lowry method (Bio-Rad, Warsaw, Poland).
Approximately 30 μg (in vitro) or 100
μg (in vivo) of protein were denatured in Laemmli
buffer (Bio-Rad, Warsaw, Poland) supplemented with
β-mercaptoethanol (Sigma-Aldrich) for 5 min at +95°C and were then
loaded onto SDS-PAGE gels. Following electrophoresis, proteins were
transferred from gels onto PVDF membranes (GE Healthcare UK Ltd.,
Little Chalfont, UK). After blocking in 5% non-fat dry milk in PBS,
the membranes were probed for 1 h at room temperature with the
following primary antibodies (antibodies dilution 1:200 in
PBS-Tween-20): anti-Bax (sc-493), anti-Bcl-2 (sc-783), anti-VDR
(sc-1008), for actin (1:500), anti-CYP24 (sc-66851), anti-CYP27B1
(sc-67261), anti-p21 (sc-397), anti-p53 (sc-6243), anti-phosphatase
and tensin homolog (PTEN) (sc-9145), anti-nuclear factor (NF)-κB
(sc-114), anti-IκB (sc-371), and anti-actin (sc-1616-R) (Santa Cruz
Biotechnology, Santa Cruz CA, USA). Following incubation with the
primary antibodies, the PVDF membranes were washed thrice for 10
min in PBS-Tween-20 (PBS from PChO, IIET, PAS; Tween-20 from
Sigma-Aldrich) and were then incubated for 1 h at room temperature
with alkaline phosphatase-conjugated secondary antibody (RPN5783)
(antibody dilution 1:10,000 in PBS-Tween-20) (GE Healthcare UK
Ltd.). Following incubation with the secondary antibody and washing
in PBS-Tween-20 (3×10 min), protein bands were visualized with an
enhanced chemifluorescence kit (GE Healthcare UK Ltd.). Images were
acquired with a Carestream Image Station 4000MM PRO (Carestream
Molecular Imaging, Woodbridge, CT, USA). Western blot analysis was
repeated 2–4 times. Densitometric analysis of the western blots was
performed using ImageJ 1.48v software (National Institutes of
Health, Bethesda, MA, USA). The results were normalized to
actin.
Immunofluorescence staining
The A549 cells were cultured on sterile cover glass
(12-mm in diameter) (Menzel-Gläser, Thermo Fisher Scientific,
Waltham, MA, USA), placed into 24-well plates, and exposed for 72 h
to different combinations of GV, SU, CIS, DTX and vitamin D
compounds. The cells were then washed in PBS and fixed in cold
acetone:methanol (1:1) (Avantor) at −20°C, permeabilized in 0.5%
PBS-Triton X-100 (Sigma-Aldrich), washed in 0.1% PBS-Triton X-100
and blocked in 2% FBS in PBS (Sigma-Aldrich). Subsequently, the
cells were incubated with anti-p53 antibody at room temperature
(sc-6243, Santa Cruz Biotechnology, Santa Cruz, CA, USA), washed in
0.1% PBS-Triton X-100, and incubated with FITC-conjugated secondary
antibody (sc-2365, Santa Cruz Biotechnology). After the next wash,
the cell nucleus was stained with 4′,6-diamidino-2-phenylindole
dihydrochloride (DAPI) (Life Technologies, Carlsbad, CA, USA) and
the cells were embedded in anti-fade mounting medium (Santa Cruz
Biotechnology). The slides were examined under a fluorescence
microscope with CellSens software (Olympus, Warsaw, Poland).
Real-time PCR analysis
The A549 cells exposed to the test compounds and
their combinations were collected in TRI Reagent (Sigma-Aldrich)
and kept at −80°C for further analysis. After thawing, chloroform
(Avantor) was added to each test tube, following by shaking and
centrifugation (12,000 × g, +4°C, 15 min), and the obtained water
phase was transferred to clean test tubes and total RNA was
precipitated with isopropanol (POCH, Gliwice, Poland). Following
centrifugation, the pellet of RNA was washed in 75% ethanol
(Avantor); the RNA was allowed to dry, and the pellet of RNA was
dissolved in DEPC (Sigma-Aldrich). The RNA concentration was
measured using a NanoDrop 2000 UV-Vis spectrophotometer (Thermo
Fisher Scientific, Wilmington, DE, USA). Approximately, 1 μg
RNA of each sample was incubated with DNase (Invitrogen, Carlsbad
CA, USA) and RNase inhibitor (EURx, Gdansk, Poland) at +37°C in
Veritii 9902 thermocycler (Life Technologies) for 15 min and cDNA
was synthesized using iScript kit (Bio-Rad, Hercules, CA, USA)
according to the following steps: 5 min +25°C, 30 min +42°C, 5 min
+85°C, and cooling down to +4°C. Samples were stored for further
analysis at −20°C. Using real-time PCR, the expression of
MYC (Hs00153408_m1, Life Technologies), VEGFA
(Hs00900055_m1, Life Technologies), and TP53 (Hs00153349_m1,
Life Technologies) was analyzed with the use of TaqMan probes and
Master Mix (Life Technologies) in Viia 7 Real-Time PCR System with
Viia 7 Software v1.1 (Life Technologies) as follows: 2 min +50°C,
10 min +95°C; 40 cycles, 15 sec +95°C, 1 min +60°C. The ΔΔCT method
was used to calculate the relative changes in gene expression.
Results were analyzed in Expression Suite Software v1.0.3 (Life
Technologies) and the level of expression was normalized to RPLP0
(Hs99999902_m1, Life Technologies).
PDGF-BB and VEGF-A ELISA
The levels of PDGF-BB and VEGF-A in tumor lysates,
prepared as described for western blot analysis, were then assessed
using commercially available ELISA kits (eBiosciences, Vienna,
Austria and Invitrogen, Camarillo CA, USA, respectively), following
the manufacturer's instructions. The absorbance of probes obtained
at the end of the procedure was measured at 450 nm using Synergy H4
Hybrid Multi-Mode Microplate Reader with software Gen5 (BioTek
Instruments, Inc.). The calculated cytokine level was then
normalized in each sample to the total protein concentration. In
addition, the VEGF-A level was measured in conditioned medium
obtained from the A549 cells. For this purpose, the A549 cells were
exposed in vitro to the test combinations of GV, SU, CIS,
DTX and vitamin D compounds [1,25(OH)2D3 and
1,24(OH)2D3] for 72 h and then washed with
PBS and incubated with RPMI-1640 medium without FBS and phenol red
for 48 h (PChO, IIET PAS). Subsequently, conditioned medium was
collected, and to include the number of cells in each well, SRB
assay was performed to assess the proliferation inhibition of the
test compounds and their combination. The experiment was repeated
thrice.
Establishment of mouse xenograft A549
tumor model
The study involving the use of laboratory animals
was performed following the approval of The First Local Ethical
Committee for Experiments with the Use of Laboratory Animals,
Wroclaw, Poland (LKE approval no.: 41/2011, 28/2013 and 29/2013). A
total of 104 NOD/SCID female mice (Animal Facility of Department of
Clinical Immunology and Transplantology, Jagiellonian University
Medical College, Krakow, Poland), which were 4–6-weeks old, were
maintained under specific pathogen-free (SPF) conditions. Viable
A549 cells in the number of 5×10⁶ per mouse in 0.2-ml
Hank's medium (PChO IIET PAS) were injected subcutaneously (s.c.)
into the right flank of the abdomen of all mice (day 0), and after
the tumor volume reached 80 mm3 of the mean volume, the
mice were randomly divided into 8 groups (6 mice were not included
in further analysis as the tumors were too small for evaluation):
control (12 mice), DTX (12 mice), SU (12 mice),
1,24(OH)2D3 (12 mice), SU +
1,24(OH)2D3 (12 mice), DTX +
1,24(OH)2D3 (12 mice), SU + DTX (13 mice) and
SU + DTX + 1,24(OH)2D3 (13 mice), receiving
different combinations of the treatment agents so that the mean
tumor volume in each group was comparable (day 17, D17). The
compounds were administered from the following day as follows: i)
DTX, once a week for 3 weeks intraperitoneally (i.p.) at a dose of
5 mg/kg/body weight [days (D)18, D24 and D31]; ii) SU, every day
for 19 days by oral gavage at a dose of 40 mg/kg/body weight (from
D19 to D36); iii) vitamin D analog
1,24(OH)2D3 thrice a week for 5 weeks s.c. at
a dose of 1 μg/kg/body weight (D19, D21, D23, D26, D28, D30,
D33, D35, D37, D40, D42, D44, D47 and D49).
The control mice received all three solvents used
for the test compounds in the respected schedule, while the mice
that received one or two compounds were also administered the
solvent of the remaining compounds (e.g., mice receiving DTX also
received citrate buffer (solvent of SU) and 80% polyethylene glycol
[solvent of 1,24(OH)2D3)].
The growing tumors were measured thrice a week using
digital caliper (Mitutoyo Corp., Kawasaki, Japan) during the
experiment, and the body mass of animals was controlled on a
precise scale (Mettler Toledo, Warsaw, Poland). Tumor volume was
calculated using the formula (a2×b)/2, where a = shorter
tumor diameter (mm) and b = longer tumor diameter (mm). On the
final day of the experiment (D51), when tumor volume exceeded 2,000
mm3, mice were anesthetized with 3–5% (v/v) mixture of
isoflurane (Aerrane isofluranum; Baxter, Canada) in synthetic air
(200 ml/min) and blood was harvested from retro-orbital sinus
separately from all mice in two tubes with or without anticoagulant
EDTA (Kabe Labortechnik GmbH; Nümbrecht, Germany). The mice were
then sacrificed by cervical dislocation and the tumors and selected
organs (liver, spleen, kidneys, and heart) were harvested and
weighed on a scale. The tumors were then frozen in liquid nitrogen
and stored at −80°C for subsequent analysis. Multiple tumors were
not observed in our study.
Hematological and biochemical analysis of
blood harvested from mice
Blood collected on EDTA anticoagulant was analyzed
on a fully automated hematological analyzer Mythic C18 (Orphée
S.A., Plan-les-Ouates, Switzerland) using Hematos v.1.1 software
(Zelnet, Ostrow Wlkp., Poland) assessing 18 hematological and blood
morphology parameters listed in Results. Blood was centrifuged for
15 min at 2,500 × g after the analysis, and the obtained plasma was
transferred to new and clean tubes. Blood collected in tubes
without anticoagulant was stored at room temperature for
approximately 30 min to coagulate. The probes were then centrifuged
at 1,500 × g for 10 min, and serum obtained was transferred to new
and clean tubes. Plasma and serum were then analyzed on a
biochemical analyzer Cobas c111 (Roche Diagnostics International
Ltd., Rotkreuz, Switzerland) to assess the levels of the following
biochemical parameters: alanine aminotransferase (ALT), aspartate
transaminase (AST), alkaline phosphatase (ALP), lactate
dehydrogenase (LDH), bilirubin, calcium, cholesterol, creatinine,
glucose, phosphates, urea and uric acid.
Statistical analysis
Statistical analysis was performed using STATISTICA
version 7.1 software (StatSoft, Inc., Tulsa, OK, USA). First, using
Levene's test, homogeneity of variance was tested and then
parametric (one-way ANOVA) or non-parametric tests were used.
Second, the Kruskal-Wallis ANOVA multiple comparison p-values
(two-tailed) test and the Mann-Whitney U test were used for tumor
growth inhibition analysis. P-values <0.05 were considered to
indicate statistically significant differences.
Results
Anti-proliferative activity of GV, SU,
CIS, DTX and 1,24(OH)2D3 or
1,25(OH)2D3, and their combinations
After the IC50 value of each agent alone
was assessed (as described in the Materials and methods), we
performed the analysis of the anti-proliferative activity of
different combinations of a given TKI with a cytostatic drug (also
termed CYT) and vitamin D compound to examine whether using two or
three compounds at low concentrations is more effective in the
inhibition of A549 lung cancer cell proliferation and if using
vitamin D compounds additionally strengthens the cytotoxicity of
the test agents against the A549 cells and HLMECs. GV or SU in
combination with CIS exerted a more potent anti-proliferative
effect against the A549 lung cancer cells compared to each agent
alone. When a third compound, such as
1,24(OH)2D3 or
1,25(OH)2D3 was added, no additional effects
were observed. GV or SU did not augment the anti-proliferative
activity of DTX alone. When 1,24(OH)2D3 or
1,25(OH)2D3 were also added, no additional
activity was observed (Fig.
1).
 | Figure 1Antiproliferative activity of GV, SU,
CIS, DTX, PRI-2191 and/or calcitriol against A549 lung cancer
cells. A549 cells were exposed to combinations of the test
compounds at different concentrations for 72 h: N, TKI and CYT were
used at their respective IC50 concentrations; 0.5 N,
half of IC50; 0.25 N, a quarter of IC50;
PRI-2191 and calcitriol were used at constant concentration of 100
nM. Bars represent the means ± SD; *p<0.05, compared
with TKI, TKI + vit, CYT, CYT + vit; **p<0.05,
compared with TKI and TKI + vit; +p<0.05, compared
with TKI; #p<0.05, compared with TKI and CYT and CYT
+ vit; $p<0.05, compared with CYT and CYT + vit
(one-way ANOVA, Fisher's test). GV, imatinib; SU, sunitinib; CIS,
cisplatin; DTX, docetaxel; vit, vitamin D compound [PRI-2191,
1,24(OH)2D3; Calcitriol,
1,25(OH)2D3]; TKI, tyrosine kinase
inhibitor. |
The analysis of the nature of the interaction
between the test compounds revealed synergism for the combination
of SU or CIS with vitamin D compounds at the highest concentrations
used, and for GV or SU combined with CIS and/or with vitamin D
compounds (CI <0.8). When DTX was used with GV or SU, additive
effects or antagonism were observed, depending on the concentration
used (Table I).
 | Table ICombination index (CI) for
combinations of GV, SU, CIS, DTX with PRI-2191 or calcitriol for
A549 lung cancer cells. |
Table I
Combination index (CI) for
combinations of GV, SU, CIS, DTX with PRI-2191 or calcitriol for
A549 lung cancer cells.
| TKI/CYTa | Nb
| 0.5 N
| 0.25 N
|
|---|
| 0c | PRI-2191 | Calc | 0 | PRI-2191 | Calc | 0 | PRI-2191 | Calc |
|---|
| GV | –d | 1.106 | 1.076 | – | 1.139 | 1.588 | – | 1.231 | 1.686 |
| SU | – | 0.663 | 0.766 | – | 0.446 | 0.470 | – | 0.319 | 0.395 |
| CIS | – | 0.712 | 0.776 | – | 0.867 | 1.018 | – | 1.074 | 0.799 |
| DTX | – | 1.034 | 1.078 | – | 1.376 | 1.281 | – | 1.153 | 1.679 |
| GV + CIS | 0.570 | 0.564 | 0.559 | 1.229 | 1.247 | 1.165 | 1.771 | 1.134 | 1.308 |
| SU + CIS | 0.607 | 0.510 | 0.455 | 0.919 | 0.849 | 0.825 | 1.360 | 0.990 | 0.973 |
| GV + DTX | 0.870 | 1.072 | 0.987 | 1.500 | 2.089 | 2.042 | 1.490 | 1.686 | 1.638 |
| SU + DTX | 1.633 | 2.010 | 1.782 | 1.143 | 1.122 | 1.152 | 1.117 | 2.016 | 1.386 |
As DTX revealed a high anti-proliferative activity
in all three test concentrations, the proliferation inhibition
observed in combinations with GV or SU may have probably resulted
mostly from DTX activity. Therefore, in the following experiment,
we tested DTX at a 10-fold lower concentration. The results
revealed that the combination of DTX with GV or SU resulted in a
greater inhibition of proliferation than GV, SU, or DTX alone
(Fig. 2). CI analysis revealed
that the interactions between the test compounds were still
additive or antagonistic (Table
II).
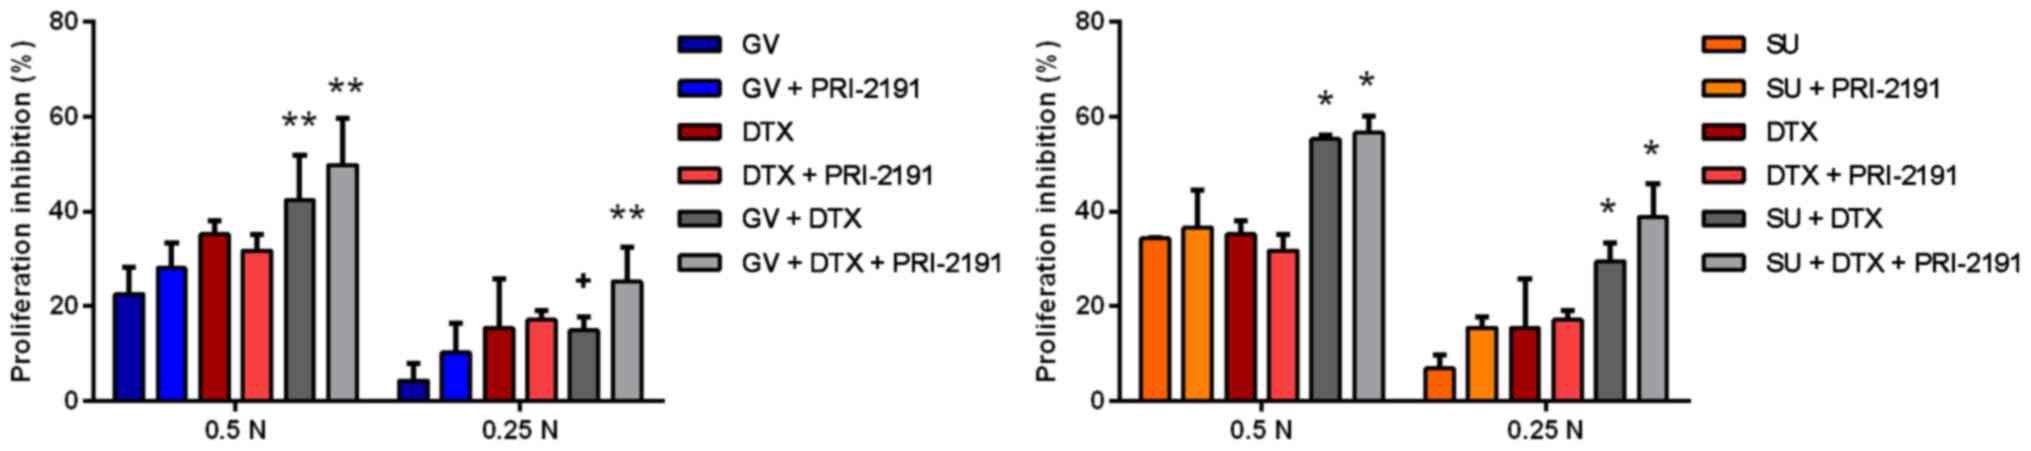 | Figure 2Anti-proliferative activity of GV and
SU with DTX and/or with PRI-2191 against A549 lung cancer cells.
DTX was used at concentration a 10-fold lower concentration than
the calculated IC50 value. Bars represent the means ±
SD; *p<0.05, compared with TKI, TKI + vit, CYT, CYT +
vit; **p<0.05, compared with TKI and TKI + vit (GV +
DTX only compared to GV); +p<0.05, compared with TKI
(one-way ANOVA, Fisher's test). GV, imatinib; SU, sunitinib; DTX,
docetaxel; vit, vitamin D compound [PRI-2191,
1,24(OH)2D3]; TKI, tyrosine kinase
inhibitor. |
| Table IICombination index (CI) for GV and SU
with DTX and/or with PRI-2191 for A549 lung cancer cells. |
Table II
Combination index (CI) for GV and SU
with DTX and/or with PRI-2191 for A549 lung cancer cells.
| TKI/CYTa | 0.5 Nb
| 0.25 N
|
|---|
| 0c | PRI-2191 | 0 | PRI-2191 |
|---|
| GV | –d | 0.898 | – | 0.711 |
| SU | – | 0.966 | – | 0.726 |
| DTX | – | 1.102 | – | 0.925 |
| GV + DTX | 1.527 | 1.311 | 1.632 | 1.149 |
| SU + DTX | 1.329 | 1.296 | 1.132 | 0.920 |
The analysis of the anti-proliferative activity of
the test agents using the HLMECs revealed that
1,24(OH)2D3 and
1,25(OH)2D3 augmented the cytotoxic activity
of GV, SU, CIS, DTX and their combinations (Fig. 3).
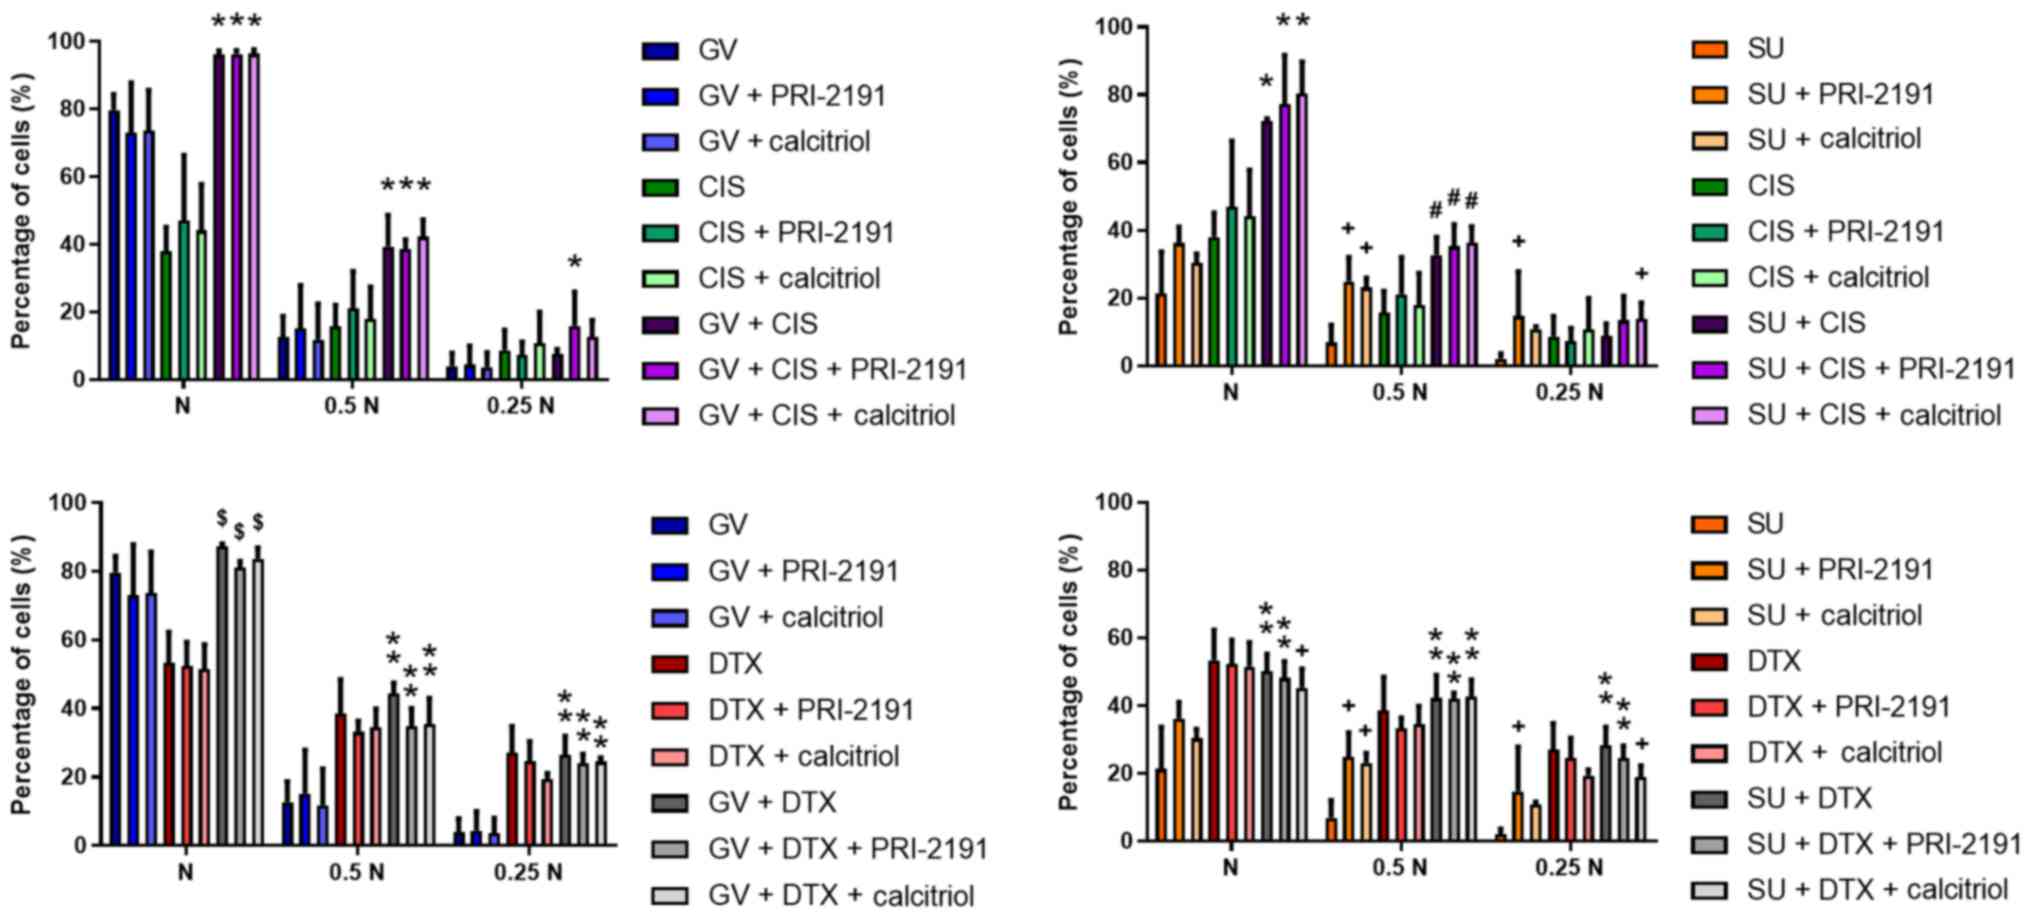
 | Figure 3Anti-proliferative activity of GV,
SU, CIS, DTX, PRI-2191 and/or calcitriol against human lung
microvascular endothelial cells (HLMECs). HLMECs were exposed to
combinations of the test compounds at different concentrations for
72 h: N, TKI and CYT were used at their respective IC50
values; 0.5 N, half of IC50; 0.25 N, a quarter of
IC50; PRI-2191 and calcitriol were used at a constant
concentration of 100 nM. Bars represent the means ± SD;
*p<0.05, compared with TKI, TKI + vit, CYT, CYT +
vit; +p<0.05, compared with TKI;
#p<0.05, compared with TKI, CYT and CYT + vit;
δp<0.05, compared with TKI, TKI + vit and CYT;
$p<0.05, compared with CYT and CYT + vit;
%p<0.05, compared with TKI, CYT, CYT + vit and TKI +
CYT (one-way ANOVA, Fisher's test). GV, imatinib; SU, sunitinib;
CIS, cisplatin; DTX, docetaxel; vit, vitamin D compound [PRI-2191,
1,24(OH)2D3; Calcitriol,
1,25(OH)2D3]; TKI, tyrosine kinase
inhibitor. |
Synergism was observed between the TKIs or the
cytostatic drugs and 1,24(OH)2D3 or
1,25(OH)2D3. The interaction between GV or SU
and cytostatic drugs was also synergistic in most cases, and the
addition of 1,24(OH)2D3 or
1,25(OH)2D3 even augmented such an effect (CI
<0.8). For those combinations for which an additive effect was
observed, that is, SU + CIS and SU + DTX, when vitamin D compounds
were added, the mechanism of interaction shifted toward synergism
(Table III).
| Table IIICombination index (CI) for
combinations of GV, SU, CIS, DTX with PRI-2191 or calcitriol for
human lung microvascular endothelial cells (HLMECs). |
Table III
Combination index (CI) for
combinations of GV, SU, CIS, DTX with PRI-2191 or calcitriol for
human lung microvascular endothelial cells (HLMECs).
| TKI/CYTa | Nb
| 0.5 N
| 0.25 N
|
|---|
| 0c | PRI-2191 | Calc | 0 | PRI-2191 | Calc | 0 | PRI-2191 | Calc |
|---|
| GV | –d | 0.102 | 0.152 | – | 0.378 | 0.187 | – | 0.377 | 0.300 |
| SU | – | 0.367 | 0.324 | – | 0.637 | 0.634 | – | 0.494 | 0.545 |
| CIS | – | 0.758 | 0.755 | – | 0.755 | 0.814 | – | 0.618 | 0.637 |
| DTX | – | 0.926 | 0.782 | – | 0.677 | 0.686 | – | 0.465 | 0.669 |
| GV + CIS | 0.735 | 0.600 | 0.624 | 0.693 | 0.430 | 0.431 | 0.603 | 0.312 | 0.391 |
| SU + CIS | 0.858 | 0.584 | 0.569 | 1.315 | 0.871 | 0.903 | 1.062 | 0.675 | 0.772 |
| GV + DTX | 0.792 | 0.734 | 0.638 | 0.546 | 0.494 | 0.459 | 1.711 | 0.372 | 0.418 |
| SU + DTX | 0.945 | 0.803 | 0.795 | 1.040 | 0.927 | 0.933 | 0.755 | 0.609 | 0.615 |
Cell cycle and cell death analysis
In order to determine whether using the test drug
combinations has an effect on specific phases of the cell cycle,
that is, whether drug combinations arrest cells at the same or
other phases as given agent alone, we performed cell cycle
analysis. GV alone arrested the A549 cells at the
G0/G1 phase, decreasing the percentage of
cells in the S phase compared to the control cells. SU, at the
concentration used, did not affect the distribution of cells in
cell the cycle phases, but when 1,24(OH)2D3
or 1,25(OH)2D3 was added with SU, the
percentage of cells in the G0/G1 phase
increased compared to the control cells. CIS decreased the
percentage of cells in the G0/G1 phase and
increased that of cells in the G2/M phase compared to
the control cells. The addition of vitamin D compounds to CIS
resulted in a decrease in the percentage of cells in the S phase
with a simultaneous increase in the percentage of cells in the
G2/M phase compared to CIS alone. DTX also decreased the
percentage of cells in the G0/G1 phase, but
increased that of cells in the S phase compared to the control
cells. When 1,24(OH)2D3 or
1,25(OH)2D3 was added to DTX, no additional
effects were observed. In the case of treatment of the A549 cells
with GV or SU together with CIS, the percentage of cells in the
G0/G1 and S phase decreased, while that of
the cells in the G2/M phase increased compared to the
controls, and to treatment with CIS, GV and SU alone.
1,24(OH)2D3 or
1,25(OH)2D3 added to these combinations
augmented the observed effects. GV with DTX increased the
percentage of cells in the G0/G1 phase
compared to DTX, and the percentage of cells in S phase compared to
GV alone, while it decreased the percentage of cells in the
G2/M phase compared with the control and the agents used
alone. Treatment of the A549 cells with SU together with DTX
resulted in a decrease in the percentage of cells in the
G0/G1 phase, and in an increase in the
percentage of cells in the G2/M phase compared to the
controls and the compounds used alone, and also resulted in a
decrease in the percentage of S phase cells compared to DTX alone.
By introducing 1,24(OH)2D3 or
1,25(OH)2D3 to these combinations (p<0.05,
one-way ANOVA, Fisher's test) (Fig.
4), no additional effects were observed.
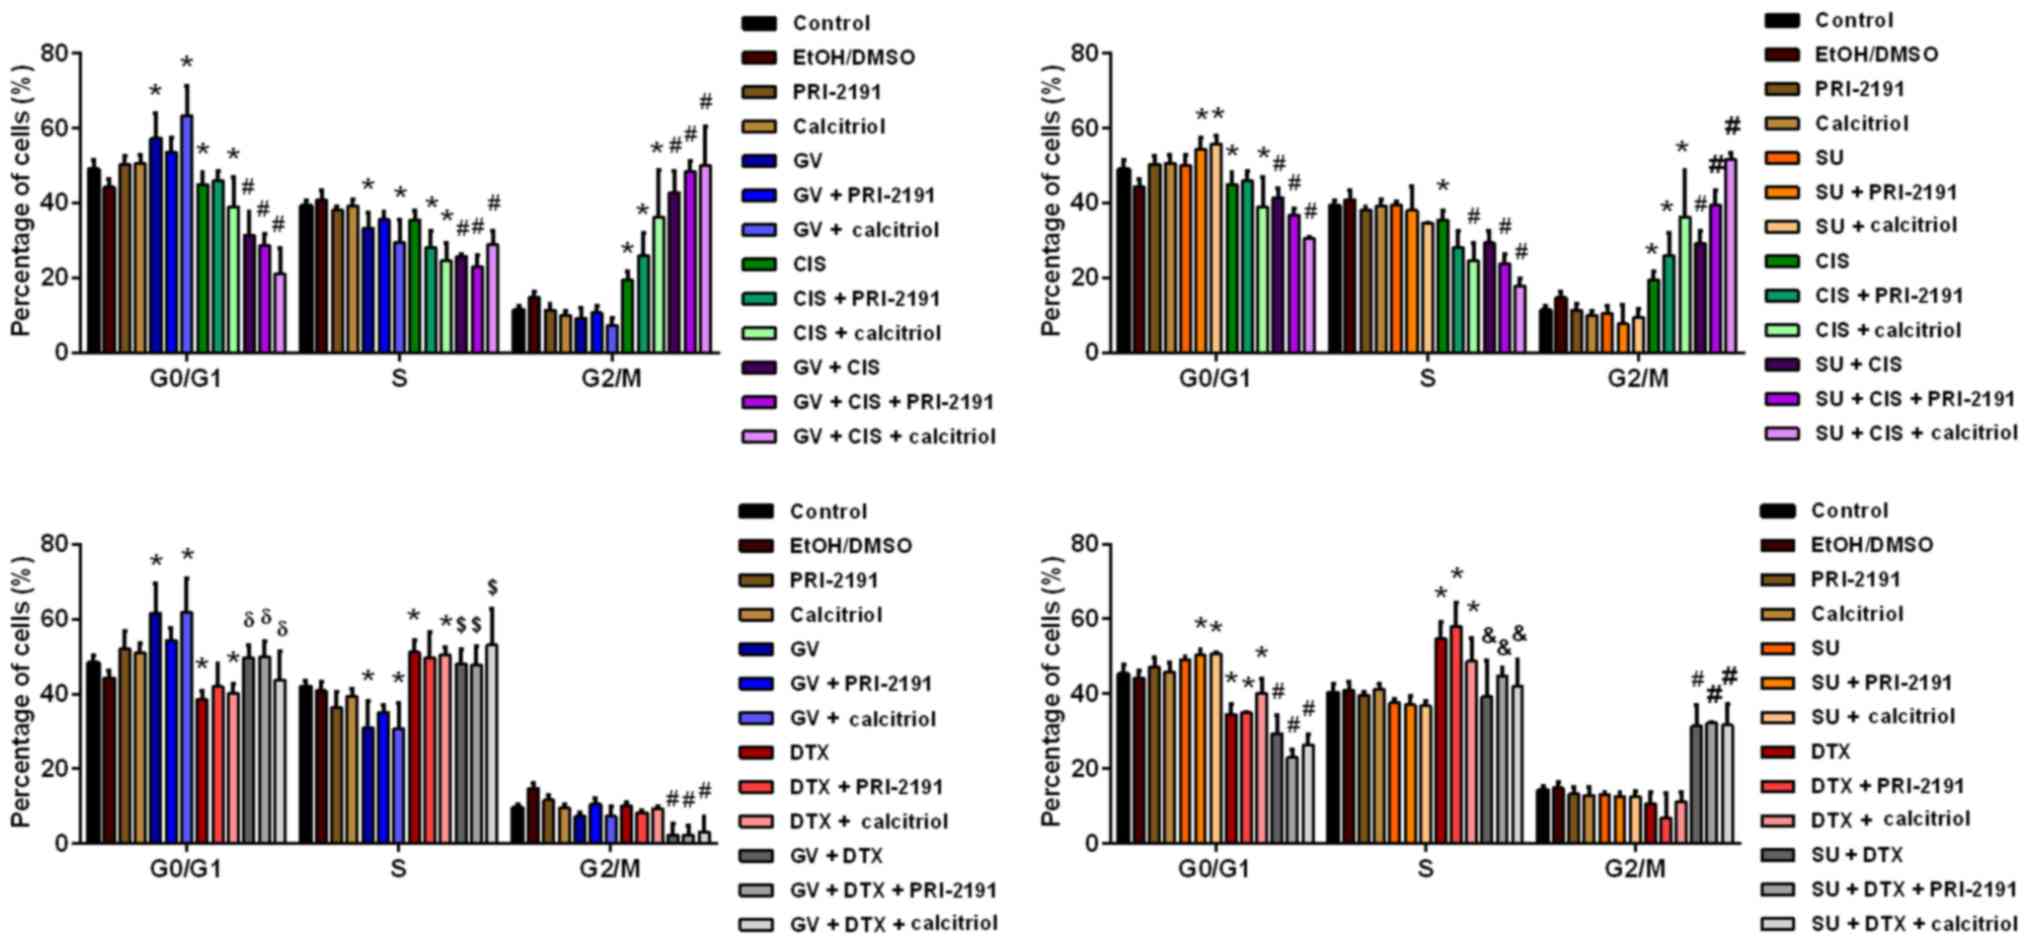 | Figure 4Cell cycle analysis of A549 lung
cancer cells after 72 h of incubation with GV, SU, CIS, DTX and/or
PRI-2191 or calcitriol. Bars represent the means ± SD.
*p<0.05 compared with control; #p<0.05,
compared with control and CIS or DTX and GV or SU;
δp<0.05, compared with GV and DTX;
$p<0.05, compared with GV; &p<0.05,
compared with DTX (one-way ANOVA, Fisher's test). GV, imatinib; SU,
sunitinib; CIS, cisplatin; DTX, docetaxel; PRI-2191,
1,24(OH)2D3; Calcitriol,
1,25(OH)2D3. |
1,24(OH)2D3 or
1,25(OH)2D3 or SU treatment of the HLMECs
resulted in a slight increase in the percentage of cells in the
G0/G1 phase. When SU was used together with
one of the vitamin D analogs, the increase in the cell percentage
in the G0/G1 phase was statistically
significant compared to the controls or to treatment with SU and
vitamin D compounds alone. GV had no effect on the cell cycle of
the HLMECs. CIS treatment increased the percentage of cells in the
S phase and decreased that of cells in the
G0/G1 phase compared with the controls. The
increase in the percentage of cells in the G2/M phase
was observed when CIS was applied together with
1,24(OH)2D3 or
1,25(OH)2D3 (Fig. 5).
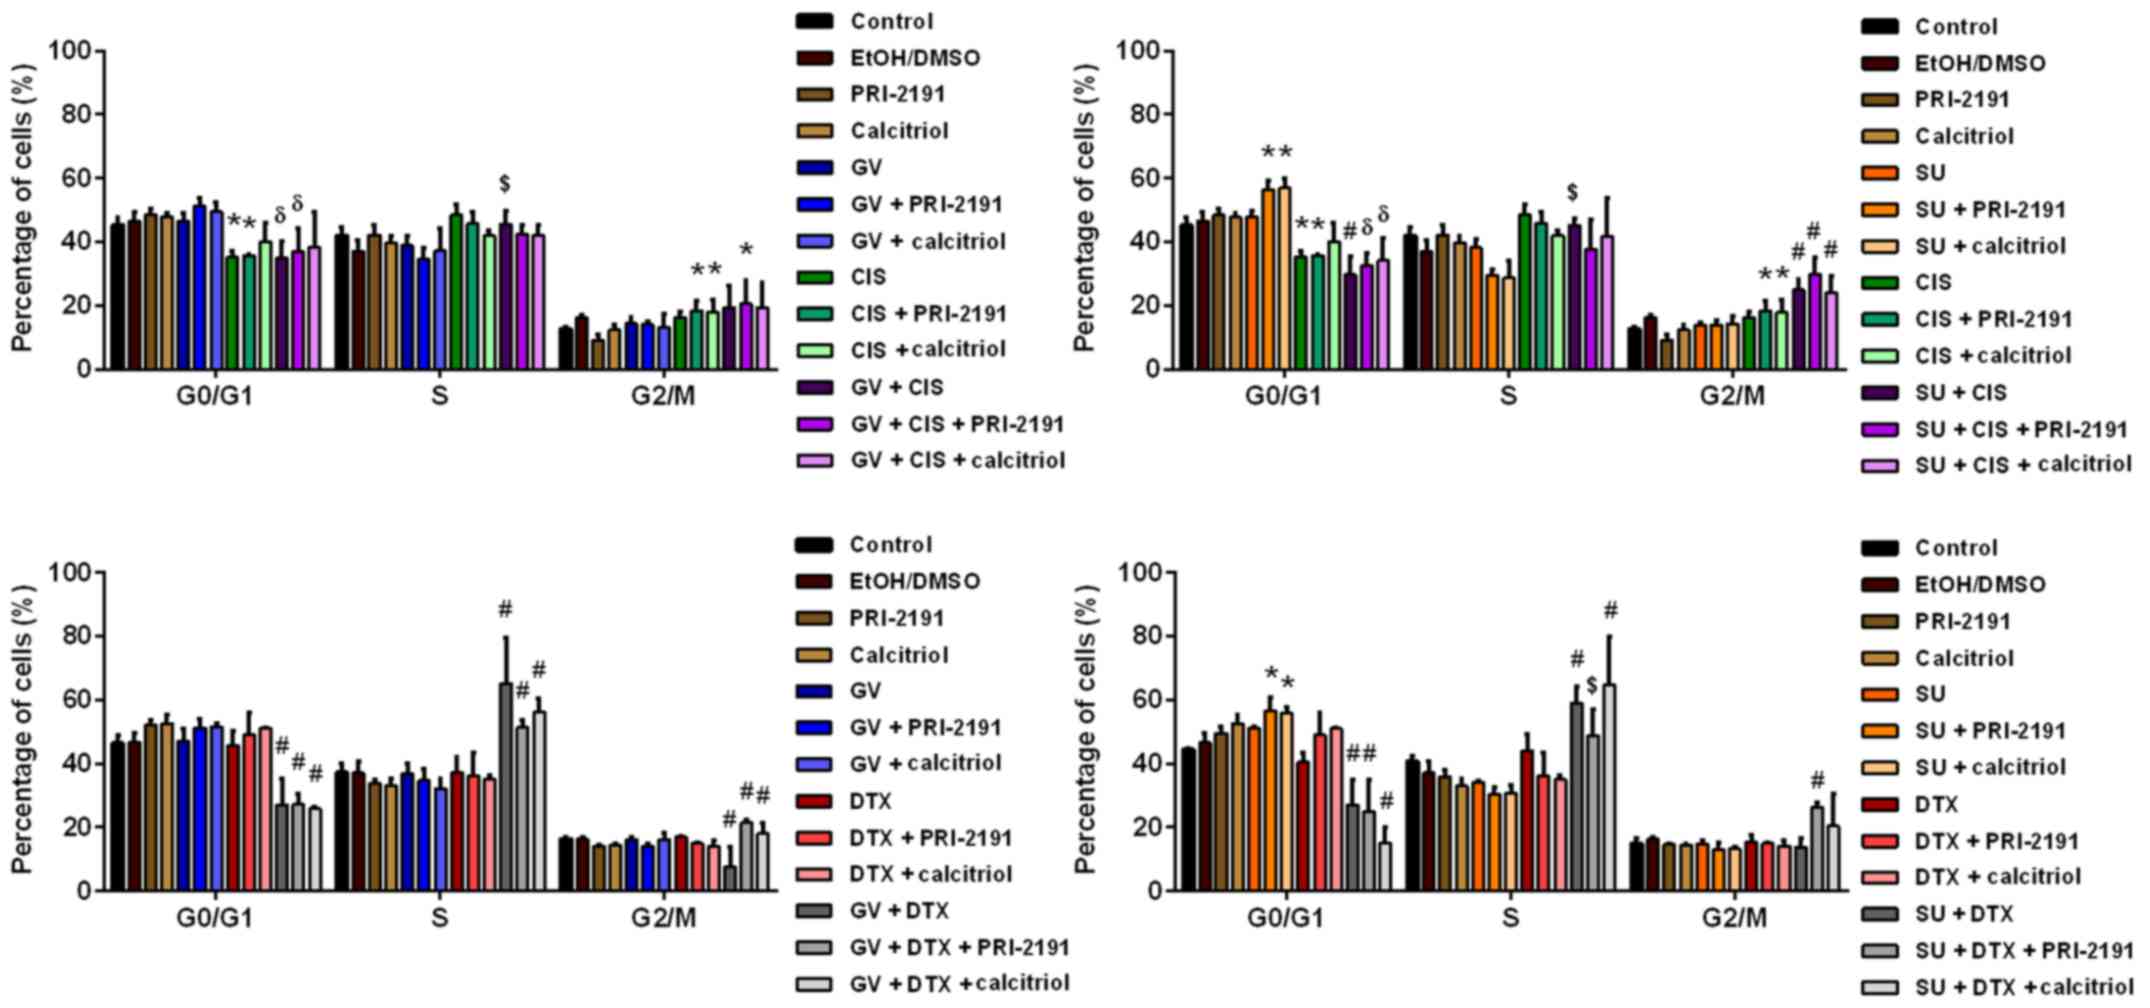 | Figure 5Cell cycle analysis of human lung
microvascular endothelial cells (HLMECs) after 72 h of incubation
with GV, SU, CIS, DTX and/or PRI-2191 or calcitriol. Bars represent
the means ± SD. *p<0.05, compared with control;
#p<0.05, compared with control and CIS or DTX and GV
or SU; δp<0.05, compared with control and GV or SU;
$p<0.05, compared with GV or SU (one-way ANOVA,
Fisher's test). GV, imatinib; SU, sunitinib; CIS, cisplatin; DTX,
docetaxel; PRI-2191, 1,24(OH)2D3; Calcitriol,
1,25(OH)2D3. |
Treatment of the HLMECs with the combination of SU
and CIS resulted in a lower percentage of cells in the
G0/G1 phase and in an increase in the
percentage of cells in the G2/M phase compared to the
controls, or to treatment with SU and CIS alone. The percentage of
cells in G2/M phase was even higher when
1,24(OH)2D3 or
1,25(OH)2D3 was added. In the case of GV
treatment together with CIS, the percentage of cells in the
G0/G1 phase decreased and the percentage of
cells in the S phase increased compared to the controls and to
treatment with GV alone. An increase in the percentage of cells in
the G2/M phase was observed when the HLMECs were exposed
to GV, CIS and 1,24(OH)2D3 (Fig. 5).
GV in combination with DTX resulted in a decrease
in the percentage of cells in the G0/G1 and
G2/M phases, and in an increase in the percentage of
cells in the S phase compared to the controls, or to treatment with
GV and DTX alone. The percentage of cells in the G2/M
phase increased compared with the combination of GV and DTX when
the HLMECs were exposed to GV and DTX in combination with
1,24(OH)2D3 or
1,25(OH)2D3. SU with DTX decreased the
percentage of cells in the G0/G1 phase and
increased that of cells in the S phase compared to the controls, or
to treatment with SU and DTX alone, while the addition of
1,24(OH)2D3 to SU and DTX resulted in a small
decrease in the percentage of cells in the S phase compared to SU
in combination with DTX, and in an increase in the percentage of
cells in the G2/M phase compared to the controls, SU
alone, DTX alone, and SU with DTX (p<0.05, one-way ANOVA,
Fisher's test) (Fig. 5).
Cell death analysis using propidium iodide staining
and flow cytometric analysis revealed that treatment of the A549
cells and HLMECs with a combination of TKIs (GV or SU) with
cytostatic drugs (CIS or DTX) resulted in an increase in the
percentage of cells in the subG1 population compared to the
controls, or to TKIs and CYT used alone. The test vitamin D
compounds, such as 1,24(OH)2D3 and
1,25(OH)2D3 did not further augment the
effects of TKIs and CYT in the case of A549 cells, but did increase
the percentage of HLMECs in the subG1 population. The highest
induction of cell death was observed upon treatment with SU in
combination with CIS or DTX and 1,24(OH)2D3
or 1,25(OH)2D3 (p<0.05, one-way ANOVA,
Fisher's test) (Table IV).
| Table IVThe percentage of A549 and human lung
microvascular endothelial cells (HLMECs) in the subG1 population
(cell death) after 72 h of incubation with TKI, CYT and vitamin D
compounds. |
Table IV
The percentage of A549 and human lung
microvascular endothelial cells (HLMECs) in the subG1 population
(cell death) after 72 h of incubation with TKI, CYT and vitamin D
compounds.
| Group | A549
| HLMEC
|
|---|
| – | PRI-2191 | Calcitriol | – | PRI-2191 | Calcitriol |
|---|
| Control | 5.7±2.9 | 6.3±5.6 | 6.5±2.8 | 6.7±2.4 | 15.2±5.3a | 14.9±4.2a |
| GV | 13.4±4.5a | 12.3±4.3 | 13.9±2.8 | 8.9±2.8 | 16.2±7.7a | 18.1±7.6a |
| SU | 9.5±6.5 | 11.0±8.2 | 7.1±3.1 | 8.6±3.5 | 28.0±6.0a | 19.9 ±11.1a |
| DTX | 17.9±3.5a | 19.7±5.3a | 18.3±3.7a | 9.0±3.1 | 18.3±3.2b | 15.2±2.9a |
| GV + DTX | 31.7±5.7b | 35.1±4.1b | 38.5±7.3b | 24.8±6.0b | 36.5±6.2d | 34.6±4.0d |
| SU + DTX | 27.9±5.0b | 28.4±7.9b | 29.4±4.7b | 29.7±5.6b | 55.4±7.3d | 50.9±7.5d |
| CIS | 25.0±6.2a | 27.8±4.6a | 20.4±9.1a | 15.8±9.8 | 24.4±13.6a | 26.3±12.2a |
| GV + CIS | 36.3±3.6c | 39.9±5.0b | 42.4±16.1b | 20.0±15.0 | 30.3±16.7c | 31.0±25.4c |
| SU + CIS | 32.0±7.3c | 21.0±2.9a | 38.2±22.8c | 32.9±18.0b | 64.7±8.1d | 52.3±14.8d |
Caspase-3 activity in A549 lung cancer
cells and HLMECs
We measured caspase-3 activity to determine whether
the observed increase in the percentage of dead cells was a result
of apoptosis. Compared to the untreated cells, treatment of the
A549 cells with GV resulted in a significant increase in caspase-3
activity. The addition of the vitamin D compounds to GV decreased
caspase-3 activity induced by GV alone. SU slightly decreased the
activity of protease compared to its basal level observed in the
untreated cells, and in the cells treated with combinations of SU
with 1,24(OH)2D3 or
1,25(OH)2D3, the activity of caspase-3 was
even lower. GV in combination with CIS caused a significantly
higher enzyme activity compared with the untreated cells and cells
incubated with GV or CIS alone. However, when
1,24(OH)2D3 or
1,25(OH)2D3 was added to the combination of
GV with CIS, a decreased activity of caspase-3 was observed. The
increase in caspase-3 activity was also observed for SU in
combination with CIS, but only when compared to SU alone (Fig. 6).
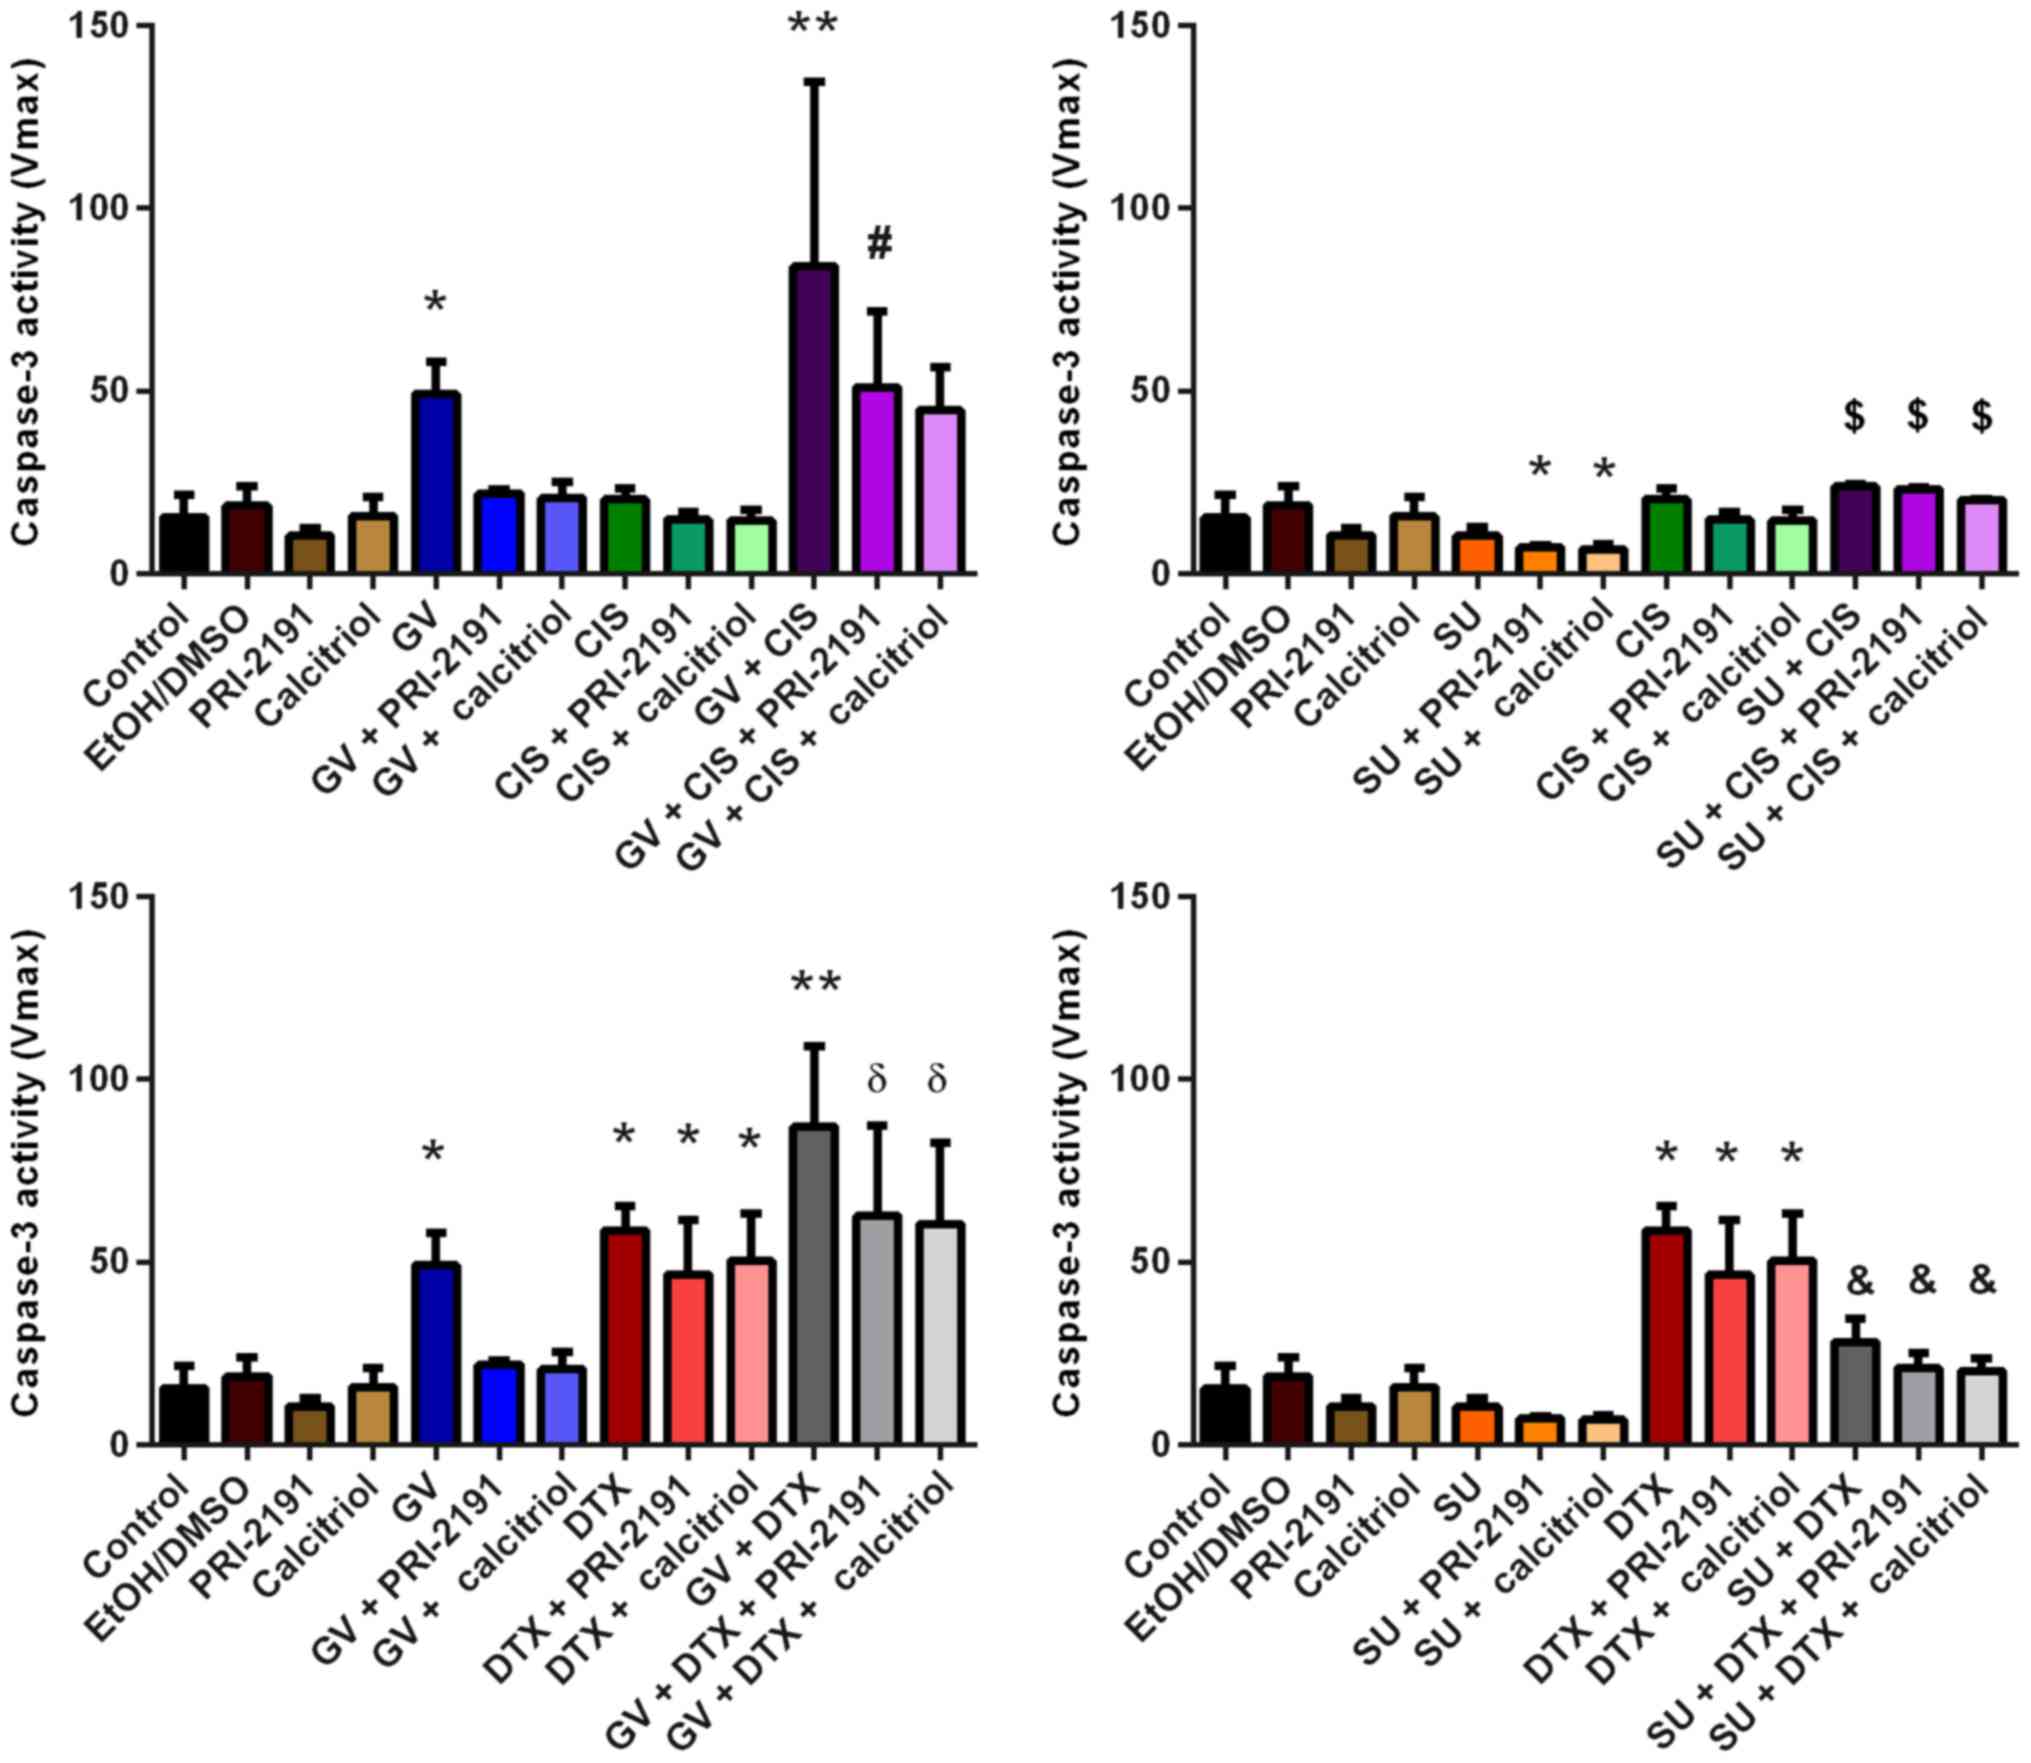 | Figure 6Caspase-3 activity in A549 cells
after 72 h of incubation with the tested combinations of TKIs, CYT
and vitamin D compounds. Bars represent the means ± SD.
*p<0.05, compared with control;
**p<0.05, compared with control, TKI, and CYT;
#p<0.05, compared with control and CYT + vit;
δp<0.05, compared with control and TKI + vit;
$p<0.05, compared with TKI;
&p<0.05, compared with TKI and CYT (one-way
ANOVA, Fisher's test). GV, imatinib; SU, sunitinib; CIS, cisplatin;
DTX, docetaxel; TKI, tyrosine kinase inhibitor; CYT, cytostatic
drug; vit, vitamin D compound [PRI-2191,
1,24(OH)2D3; Calcitriol,
1,25(OH)2D3]. |
Upon treatment with DTX, a significant increase in
caspase-3 activity was also observed. A further increase in enzyme
activity was observed when DTX was used together with GV. However,
the addition of 1,24(OH)2D3 or
1,25(OH)2D3 to GV with DTX resulted in a
decrease in protease activity compared with a previously achieved
increase using the double combination of GV and DTX. A significant
decrease in caspase-3 activity was observed using SU in combination
with DTX compared to DTX alone (p<0.05, one-way ANOVA, Fisher's
test) (Fig. 6).
Caspase-3 activity in the HLMECs was not affected
by GV and SU alone. A significant increase in enzyme activity was
noted upon treatment of the HLMECs with CIS or DTX together with
1,24(OH)2D3 or
1,25(OH)2D3. No additional changes in
caspase-3 activity were observed when GV was added to CIS or DTX in
combination with 1,24(OH)2D3 or
1,25(OH)2D3. The highest increase in
caspase-3 activity in the HLMECs was observed following incubation
with SU in combination with CIS or DTX and
1,24(OH)2D3 or
1,25(OH)2D3, which was statistically
significant compared with the untreated and SU- or CIS- or
DTX-treated cells (p<0.05, one-way ANOVA, Fisher's test)
(Fig. 7).
 | Figure 7Caspase-3 activity in human lung
microvascular endothelial cells (HLMECs) after 72 h of incubation
with the tested combinations of TKIs, CYT and vitamin D compounds.
Bars represent the means ± SD. *p<0.05, compared with
control and TKI; **p<0.05, compared with control, TKI
and CYT (one-way ANOVA, Fisher's test). GV, imatinib; SU,
sunitinib; CIS, cisplatin; DTX, docetaxel; TKI, tyrosine kinase
inhibitor; CYT, cytostatic drug; PRI-2191,
1,24(OH)2D3; Calcitriol,
1,25(OH)2D3. |
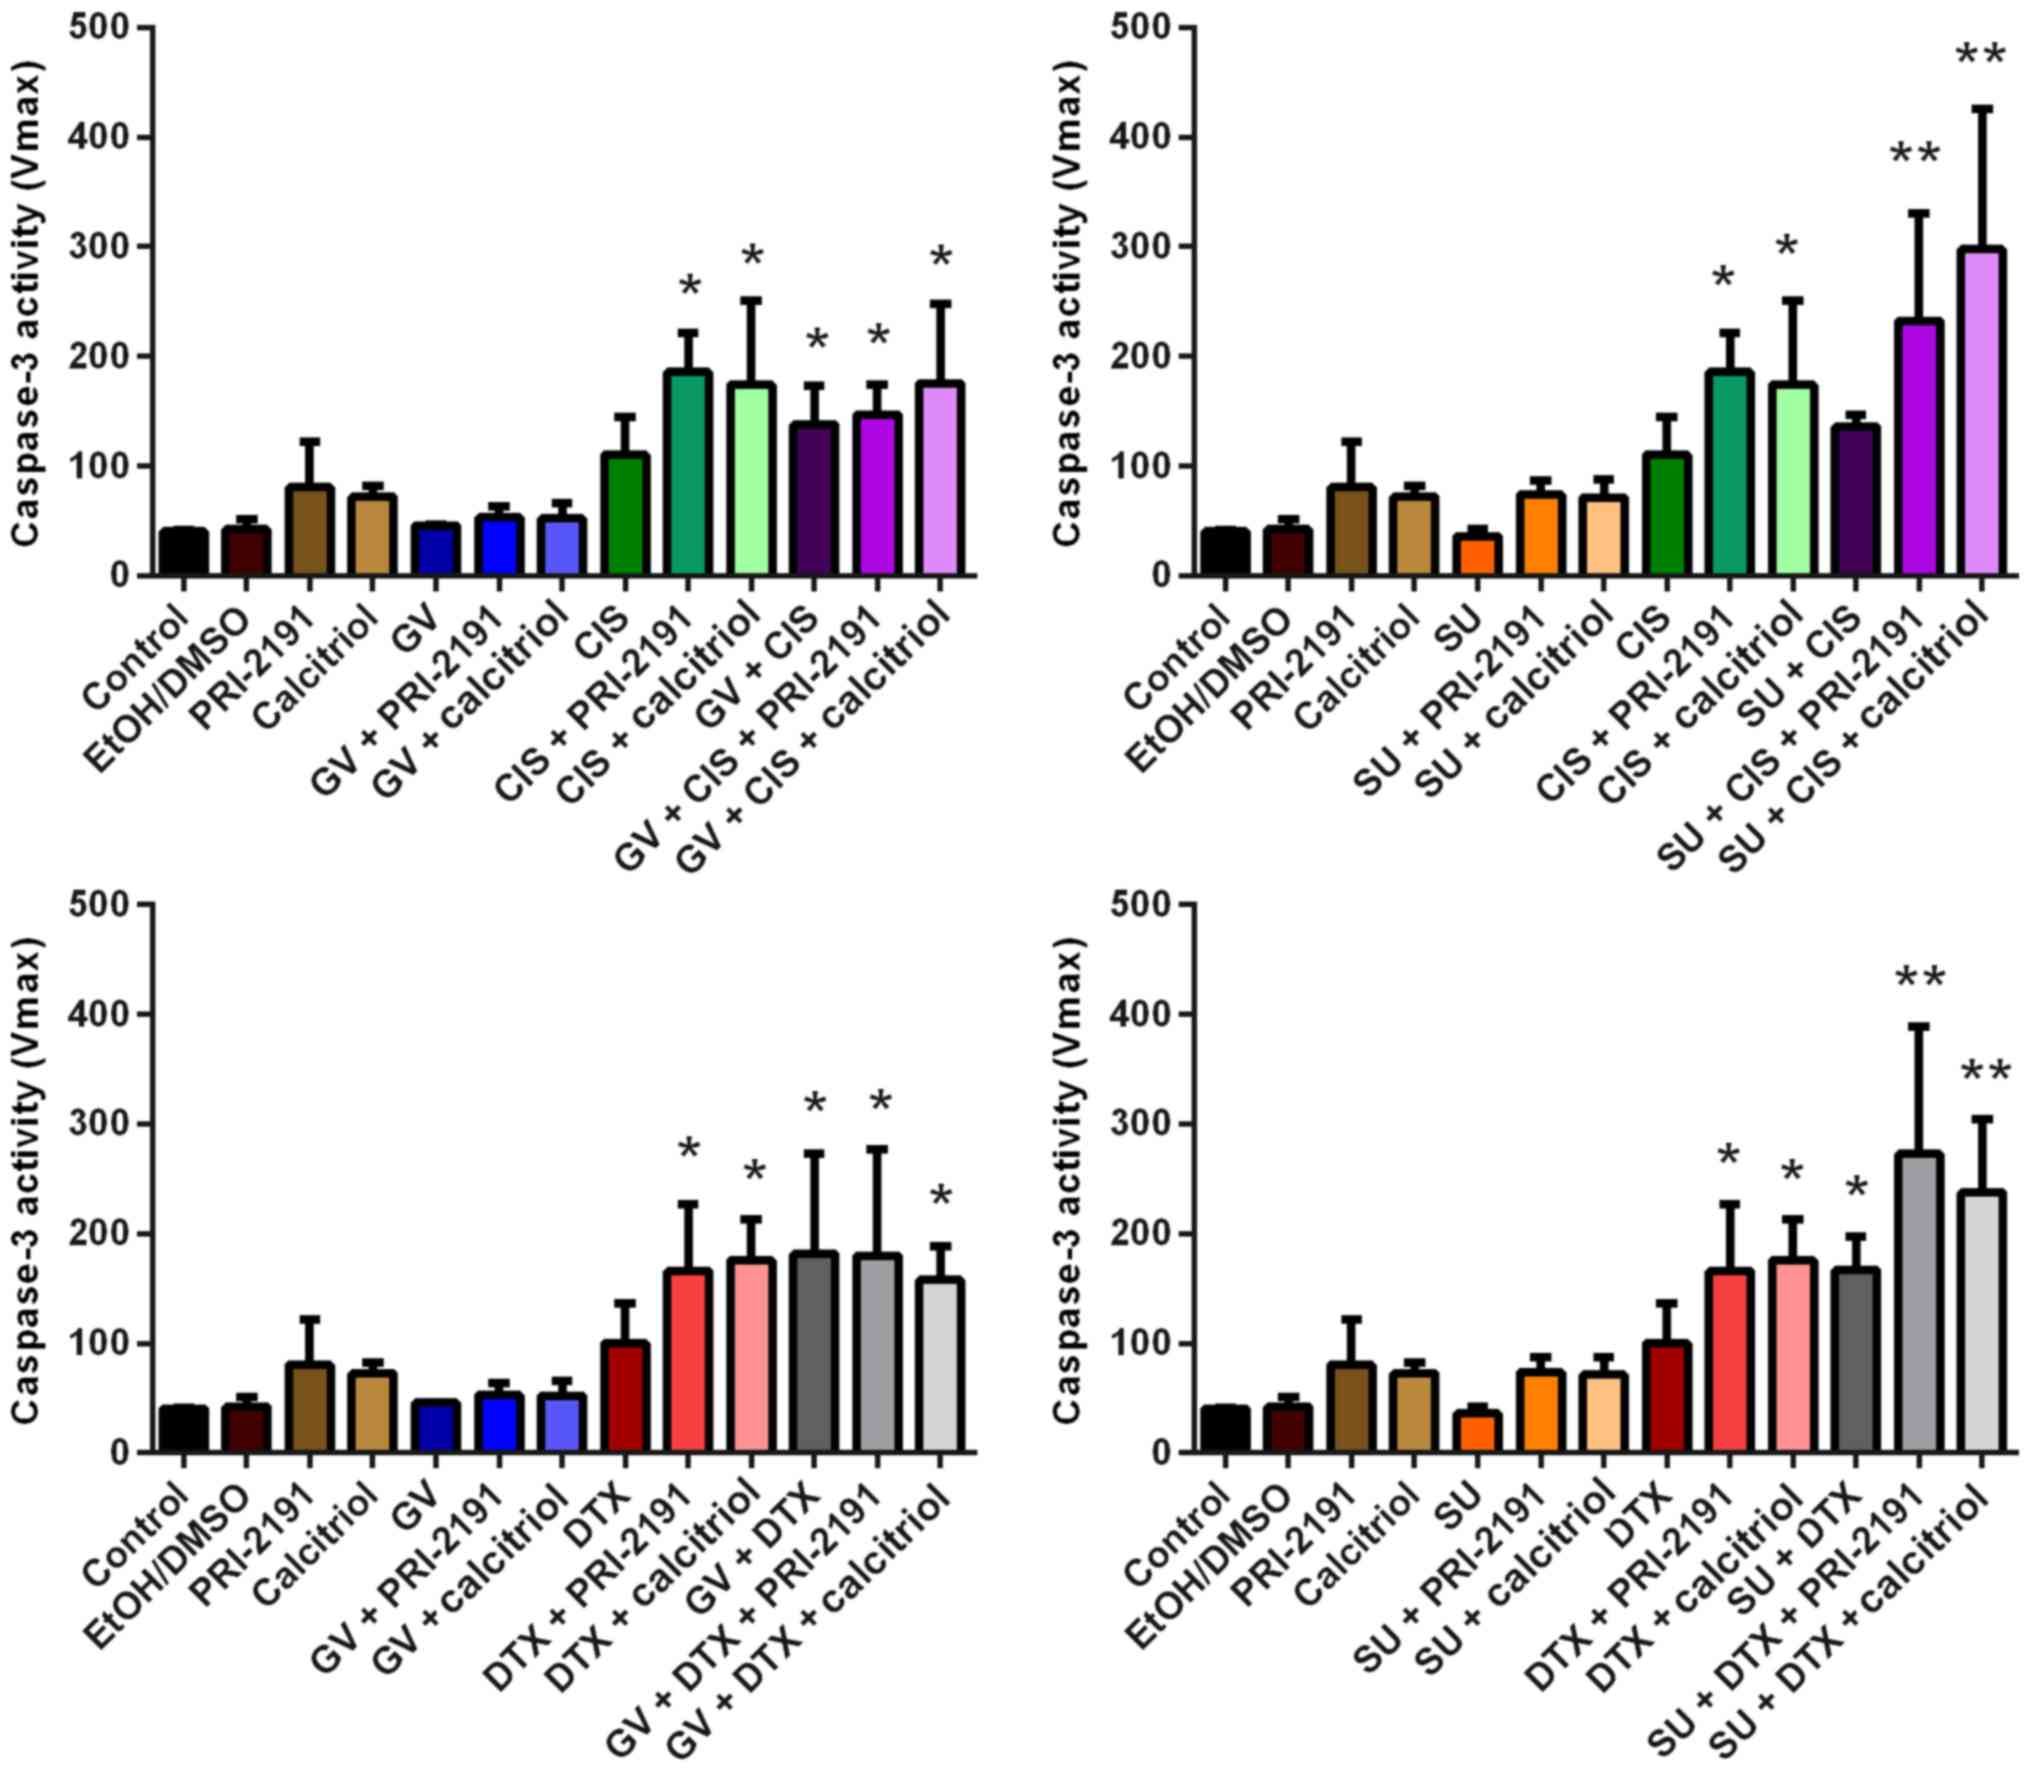
Sunitinib and cisplatin decrease VEGF-A
secretion by A549 lung cancer cells
Using ELISA, the effects of the test compounds on
VEGF-A secretion by A549 lung cancer cells were analyzed in
conditioned medium. The A549 cells exposed to SU alone or in
combination with 1,24(OH)2D3 or
1,25(OH)2D3 secreted significantly less
VEGF-A into the conditioned medium compared to the untreated cells.
In addition, treatment of the A549 cells with CIS alone or in
combination with vitamin D compounds resulted in a decrease in
VEGF-A levels compared with the untreated cells. The addition of GV
to CIS did not augment the effect achieved by CIS alone. However,
the most prominent inhibition of VEGF-A was observed when the A549
cells were exposed to SU and CIS, which was statistically
significant compared with the untreated and SU- or CIS-treated
cells. 1,24(OH)2D3 or
1,25(OH)2D3 did not further augment such an
effect. DTX in combination with GV or SU had no effect on VEGF-A
production (p<0.05, one-way ANOVA, Fisher's test) (Fig. 8).
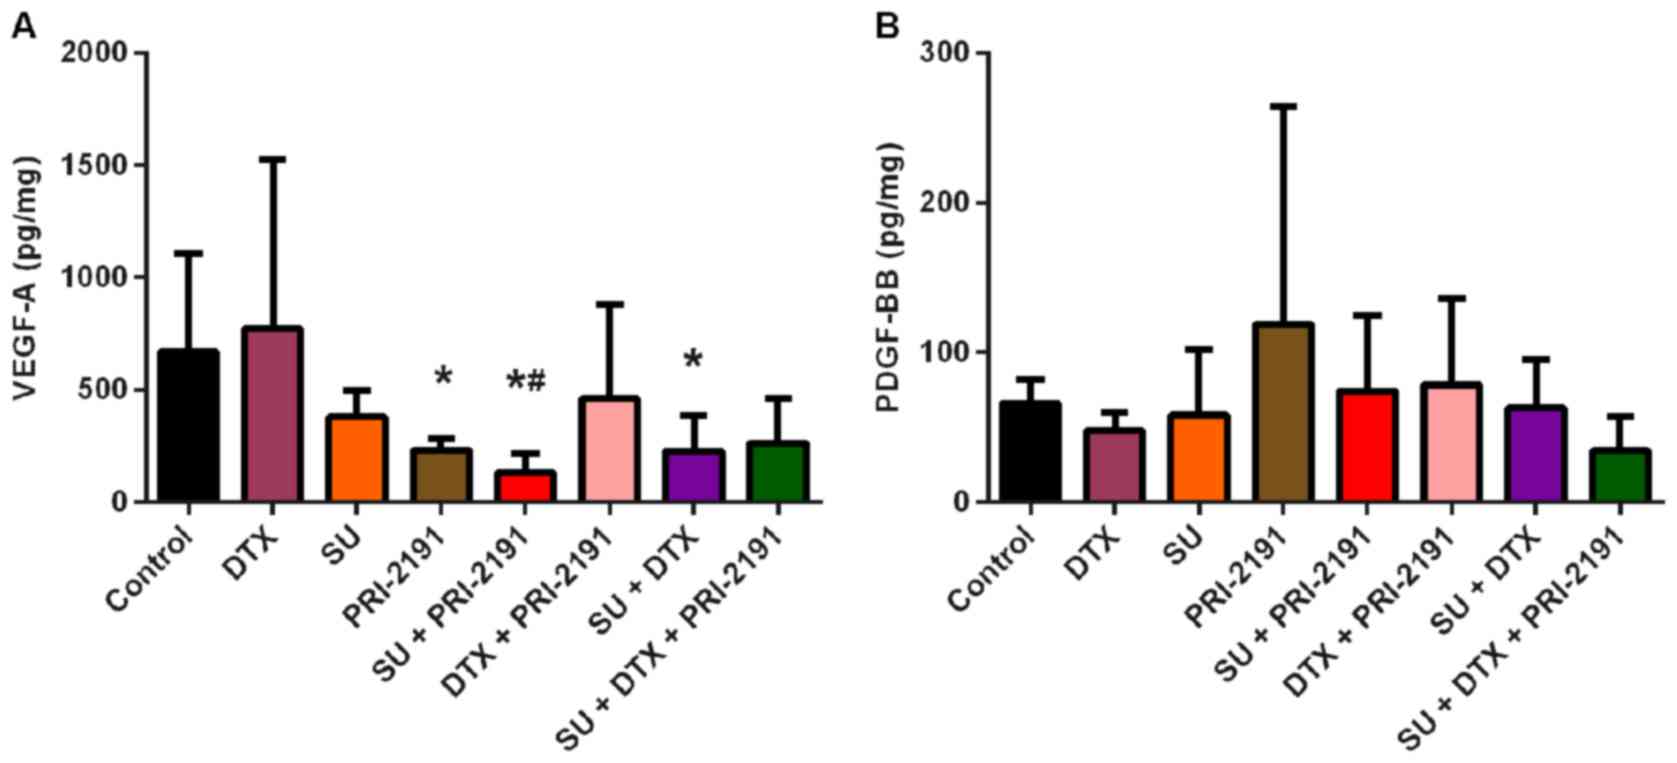
 | Figure 8VEGF-A secretion by A549 lung cancer
cells in vitro following treatment with GV, SU, CIS, DTX,
PRI-2191 and/or calcitriol. Bars represent the means ± SD. VEGF-A
level was normalized to the number of cells assessed indirectly
using sulforhodamine B (SRB) assay. *p<0.05, compared
with control; **p<0.05, compared with control and
TKI; &p<0.05, compared with TKI;
#p<0.05, compared with control and CYT;
δp<0.05, compared with control, TKI, and CYT (one-way
ANOVA, Fisher's test). GV, imatinib; SU, sunitinib; CIS, cisplatin;
DTX, docetaxel; TKI, tyrosine kinase inhibitor; CYT, cytostatic
drug; PRI-2191, 1,24(OH)2D3; Calcitriol,
1,25(OH)2D3. |
The results of the inhibition of the proliferation
of the A549 cells resulting from 72 h of incubation with GV, SU,
CIS, DTX, 1,24(OH)2D3 and/or
1,25(OH)2D3 and their combinations, followed
by 48 h of culture in medium without FBS are presented in Fig. 9. After the conditioned media were
collected for ELISA, SRB assay was performed on the A549 cells
present in 96-well plates.
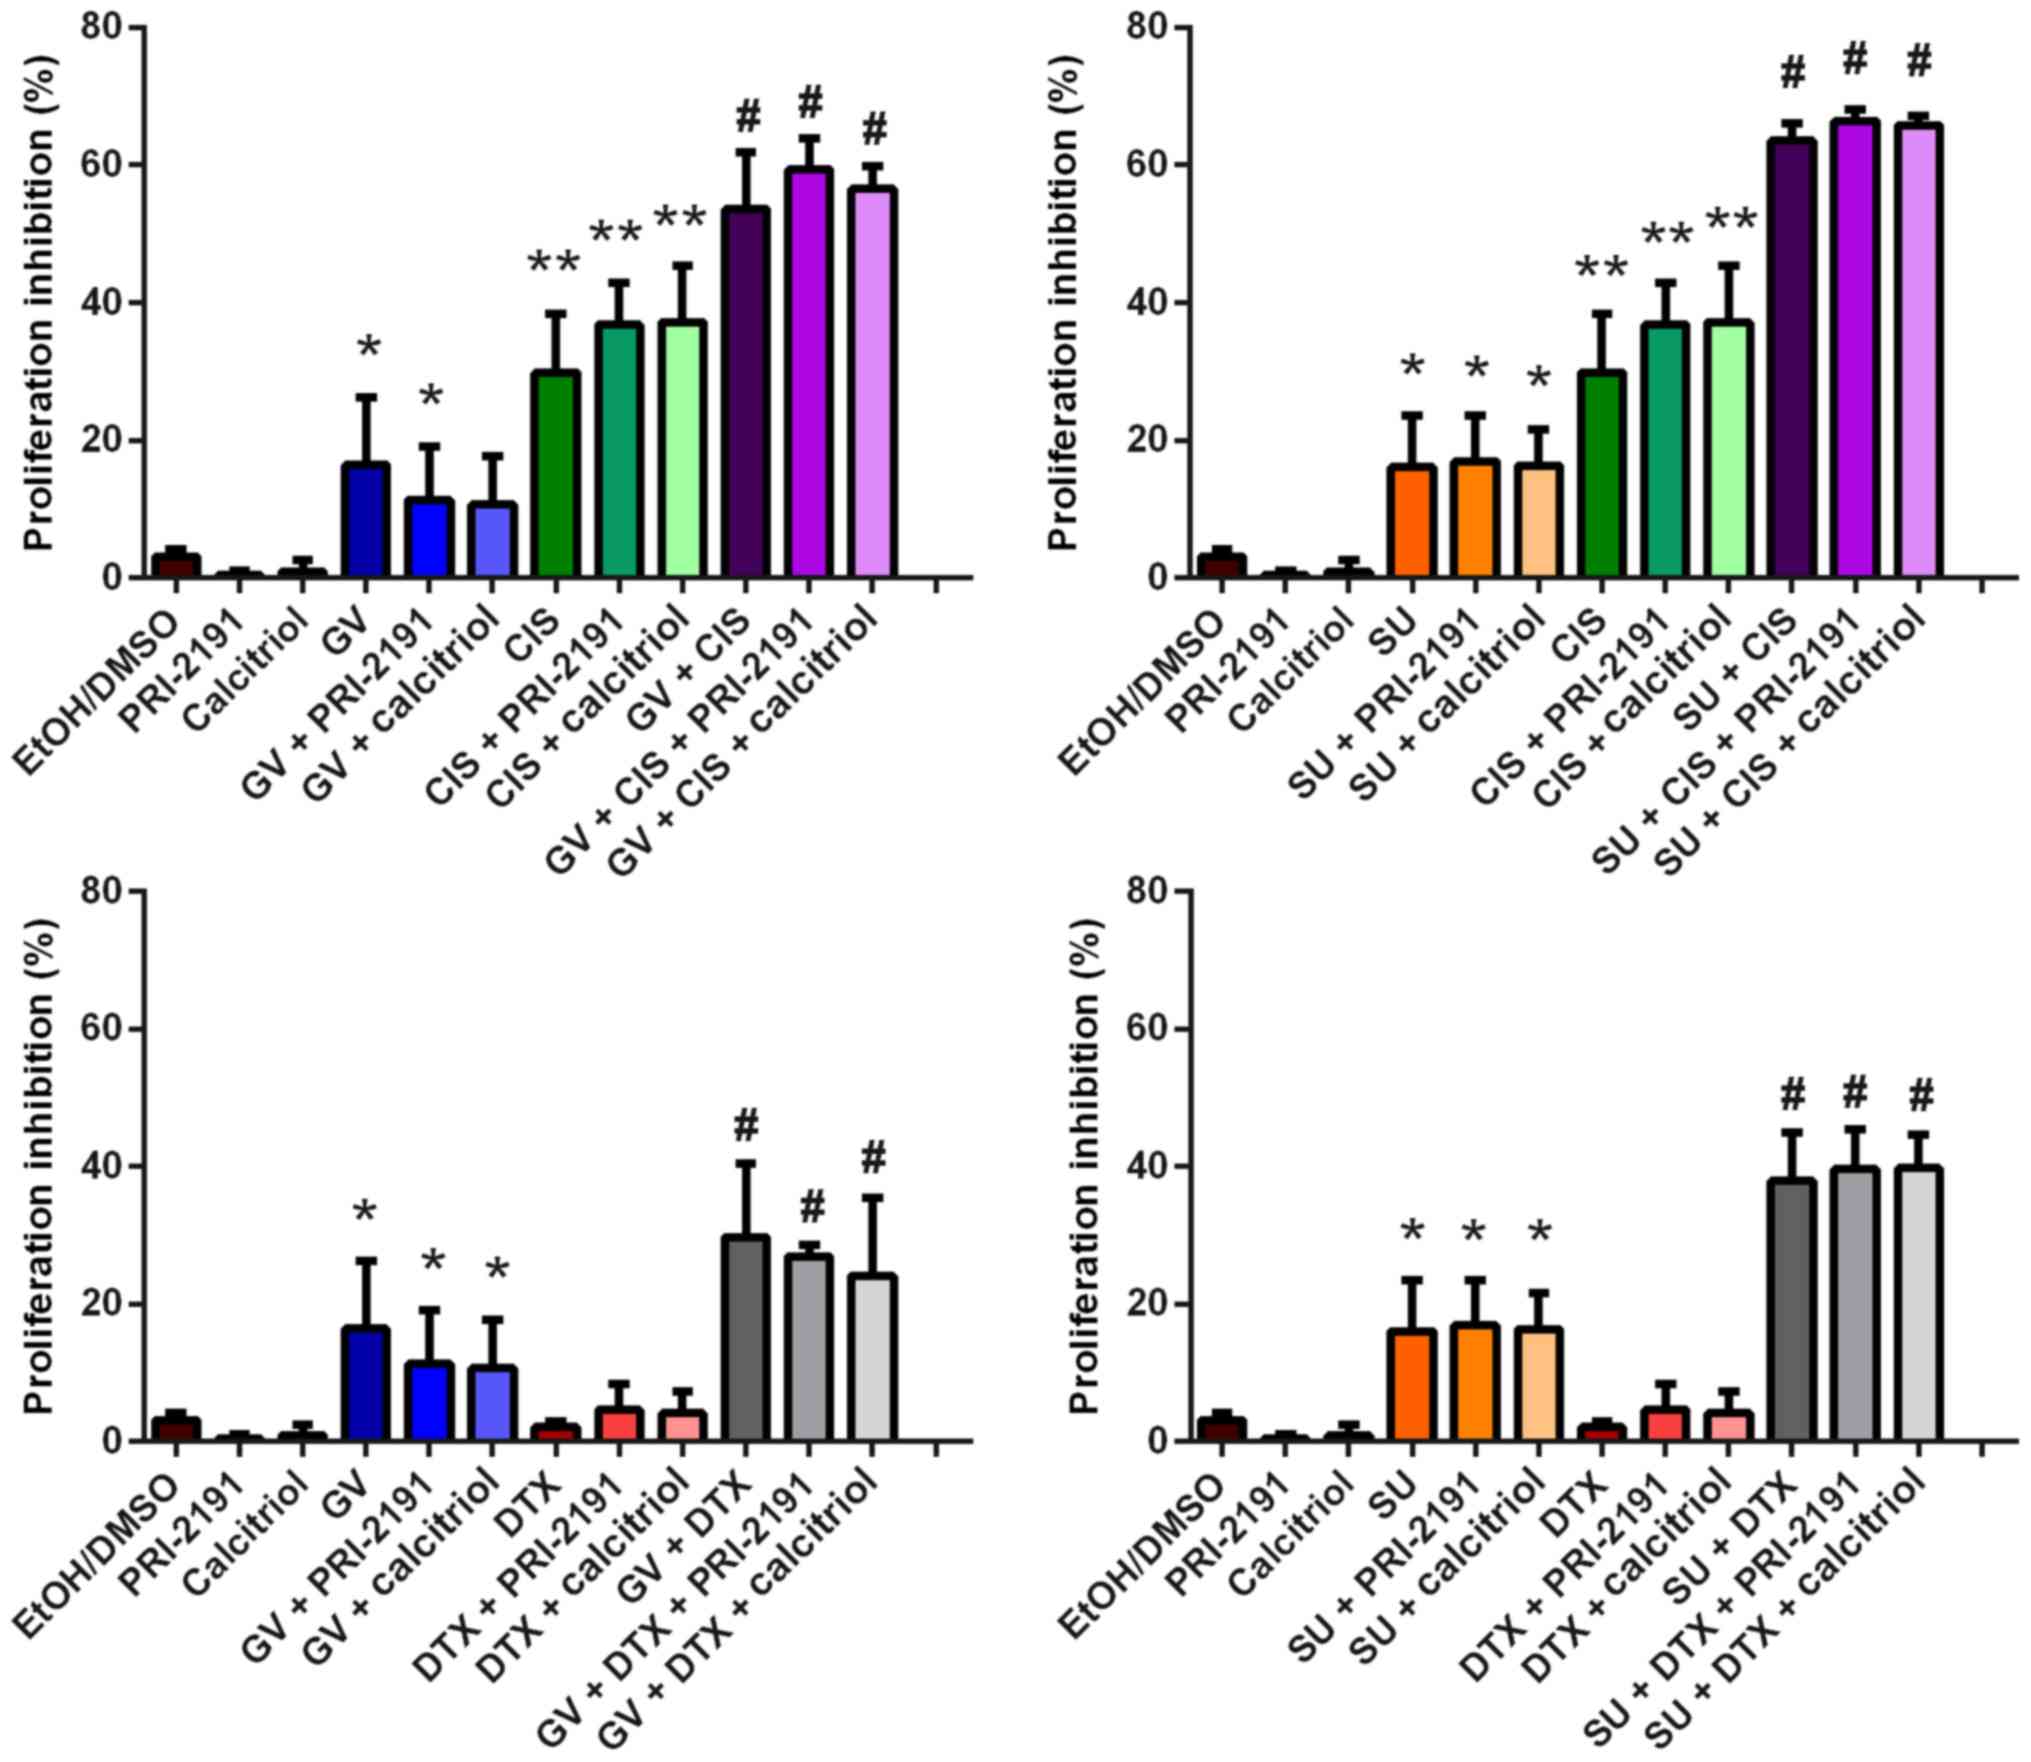 | Figure 9Inhibition of the proliferation of
A549 cells after 72 h of incubation with GV, SU, CIS, DTX, PRI-2191
and/or calcitriol, followed by 48 h of culture in medium without
FBS. Bars represent the means ± SD. *p<0.05, compared
with EtOH/DMSO and vitamin D compounds; **p<0.05,
compared with EtOH/DMSO, vitamin D compounds, and TKI;
#p<0.05, compared with EtOH/DMSO, vitamin D
compounds, TKI, and CYT (one-way ANOVA, Fisher's test). GV,
imatinib; SU, sunitinib; CIS, cisplatin; DTX, docetaxel; TKI,
tyrosine kinase inhibitor; CYT, cytostatic drug; PRI-2191,
1,24(OH)2D3; Calcitriol,
1,25(OH)2D3 |
Effects of GV, SU, CIS, DTX,
1,24(OH)2D3 and
1,25(OH)2D3 on p53 and p21 expression in A549
cells
One of the functions of the p53 pathway is the
regulation of the process of angiogenesis, for example, the
downregulation of the expression of the pro-angiogenic factor,
VEGF-A (25). In this study, we
examined the effects of the test compound combinations on the
protein expression of p53 and its target protein, p21, in A549
cells, in order to determine whether the changes in VEGF-A levels
upon treatment with the test agents are the result of the
upregulation of the p53 pathway. Densitometric analysis revealed
that 72 h of incubation of the A549 cells with GV, SU, or vitamin D
compounds did not affect p53 and p21 expression, while CIS and DTX
induced p53 and p21 protein expression. The addition of GV or SU to
CIS did not augment the level of p53 compared to treatment with CIS
alone (Fig. 10). It was observed
that the level of p53 protein expression was higher than that
observed for DTX alone or DTX with
1,24(OH)2D3 or
1,25(OH)2D3 following treatment of the A549
with DTX in combination with GV or with SU and/or with
1,24(OH)2D3 or
1,25(OH)2D3 (Fig. 10A). Together with the induction of
p53 expression by the test compounds, the upregulation of p21
expression was observed (Fig.
10B) (p<0.05, one-way ANOVA, Fisher's test).
 | Figure 10Effect of GV, SU, CIS, DTX, PRI-2191
and calcitriol on (A) p53 and (B) p21 expression in A549 cells.
Densitometric analysis was performed using ImageJ 1.46v software;
the results were normalized to actin; bars represent the means ±
SD, n=2–3 repeats. *p<0.05, compared with control
cells and TKI; **p<0.05, compared with control cells,
TKI, and CYT (one-way ANOVA, Fisher's test). Beneath the bar
charts, representative immunoblots are presented. Note that not all
the data samples were run continuously in adjacent lanes in the
same gel, as portrayed in the figure. GV, imatinib; SU, sunitinib;
CIS, cisplatin; DTX, docetaxel; PRI-2191,
1,24(OH)2D3; Calcitriol,
1,25(OH)2D3. |
In order to visualize the localization of p53 in
the A549 cells (nucleus vs. cytoplasm), p53 expression was
additionally analyzed using indirect immunofluorescence. As
assessed by using A549 staining with anti-p53 antibody followed by
anti-IgG-FITC conjugated antibody, green fluorescence with nuclear
localization was observed in the A549 cells treated with CIS, DTX
alone or in combination with GV, SU, and/or vitamin D compound
(Fig. 11). Thus, p53 was
localized in the nucleus where it revealed the activity as a
transcription factor; for example, it induced p21 expression as
assessed by western blot analysis.
Analysis of expression of proteins
involved in the activity and metabolism of vitamin D in A549 lung
cancer cells
Vitamin D reveals its activity through binding with
VDR, while the availability of vitamin D is regulated by
24-hydroxylase (CYP24), the enzyme that inactivates it (7). In this study, the expression level of
VDR, as well as that of CYP24, was examined by western blot
analysis to determine the possible cause of the weak activity of
vitamin D compounds in A549 cells. Densitometric analysis revealed
that 1,24(OH)2D3 (p<0.05) and
1,25(OH)2D3 increased the expression of VDR
in A549 cells. DTX when used alone, in turn, resulted in the
downregulation of VDR compared to the untreated cells, but when
1,24(OH)2D3 or
1,25(OH)2D3 was used in combination with DTX,
the level of VDR increased compared to treatment with DTX alone. A
lower level of VDR expression was observed following incubation of
the A549 cells with SU, DTX and vitamin D compounds compared to
treatment with SU alone. No significant changes in VDR expression
were observed in the cells treated with CIS used alone or in
different combinations (Fig.
12A).
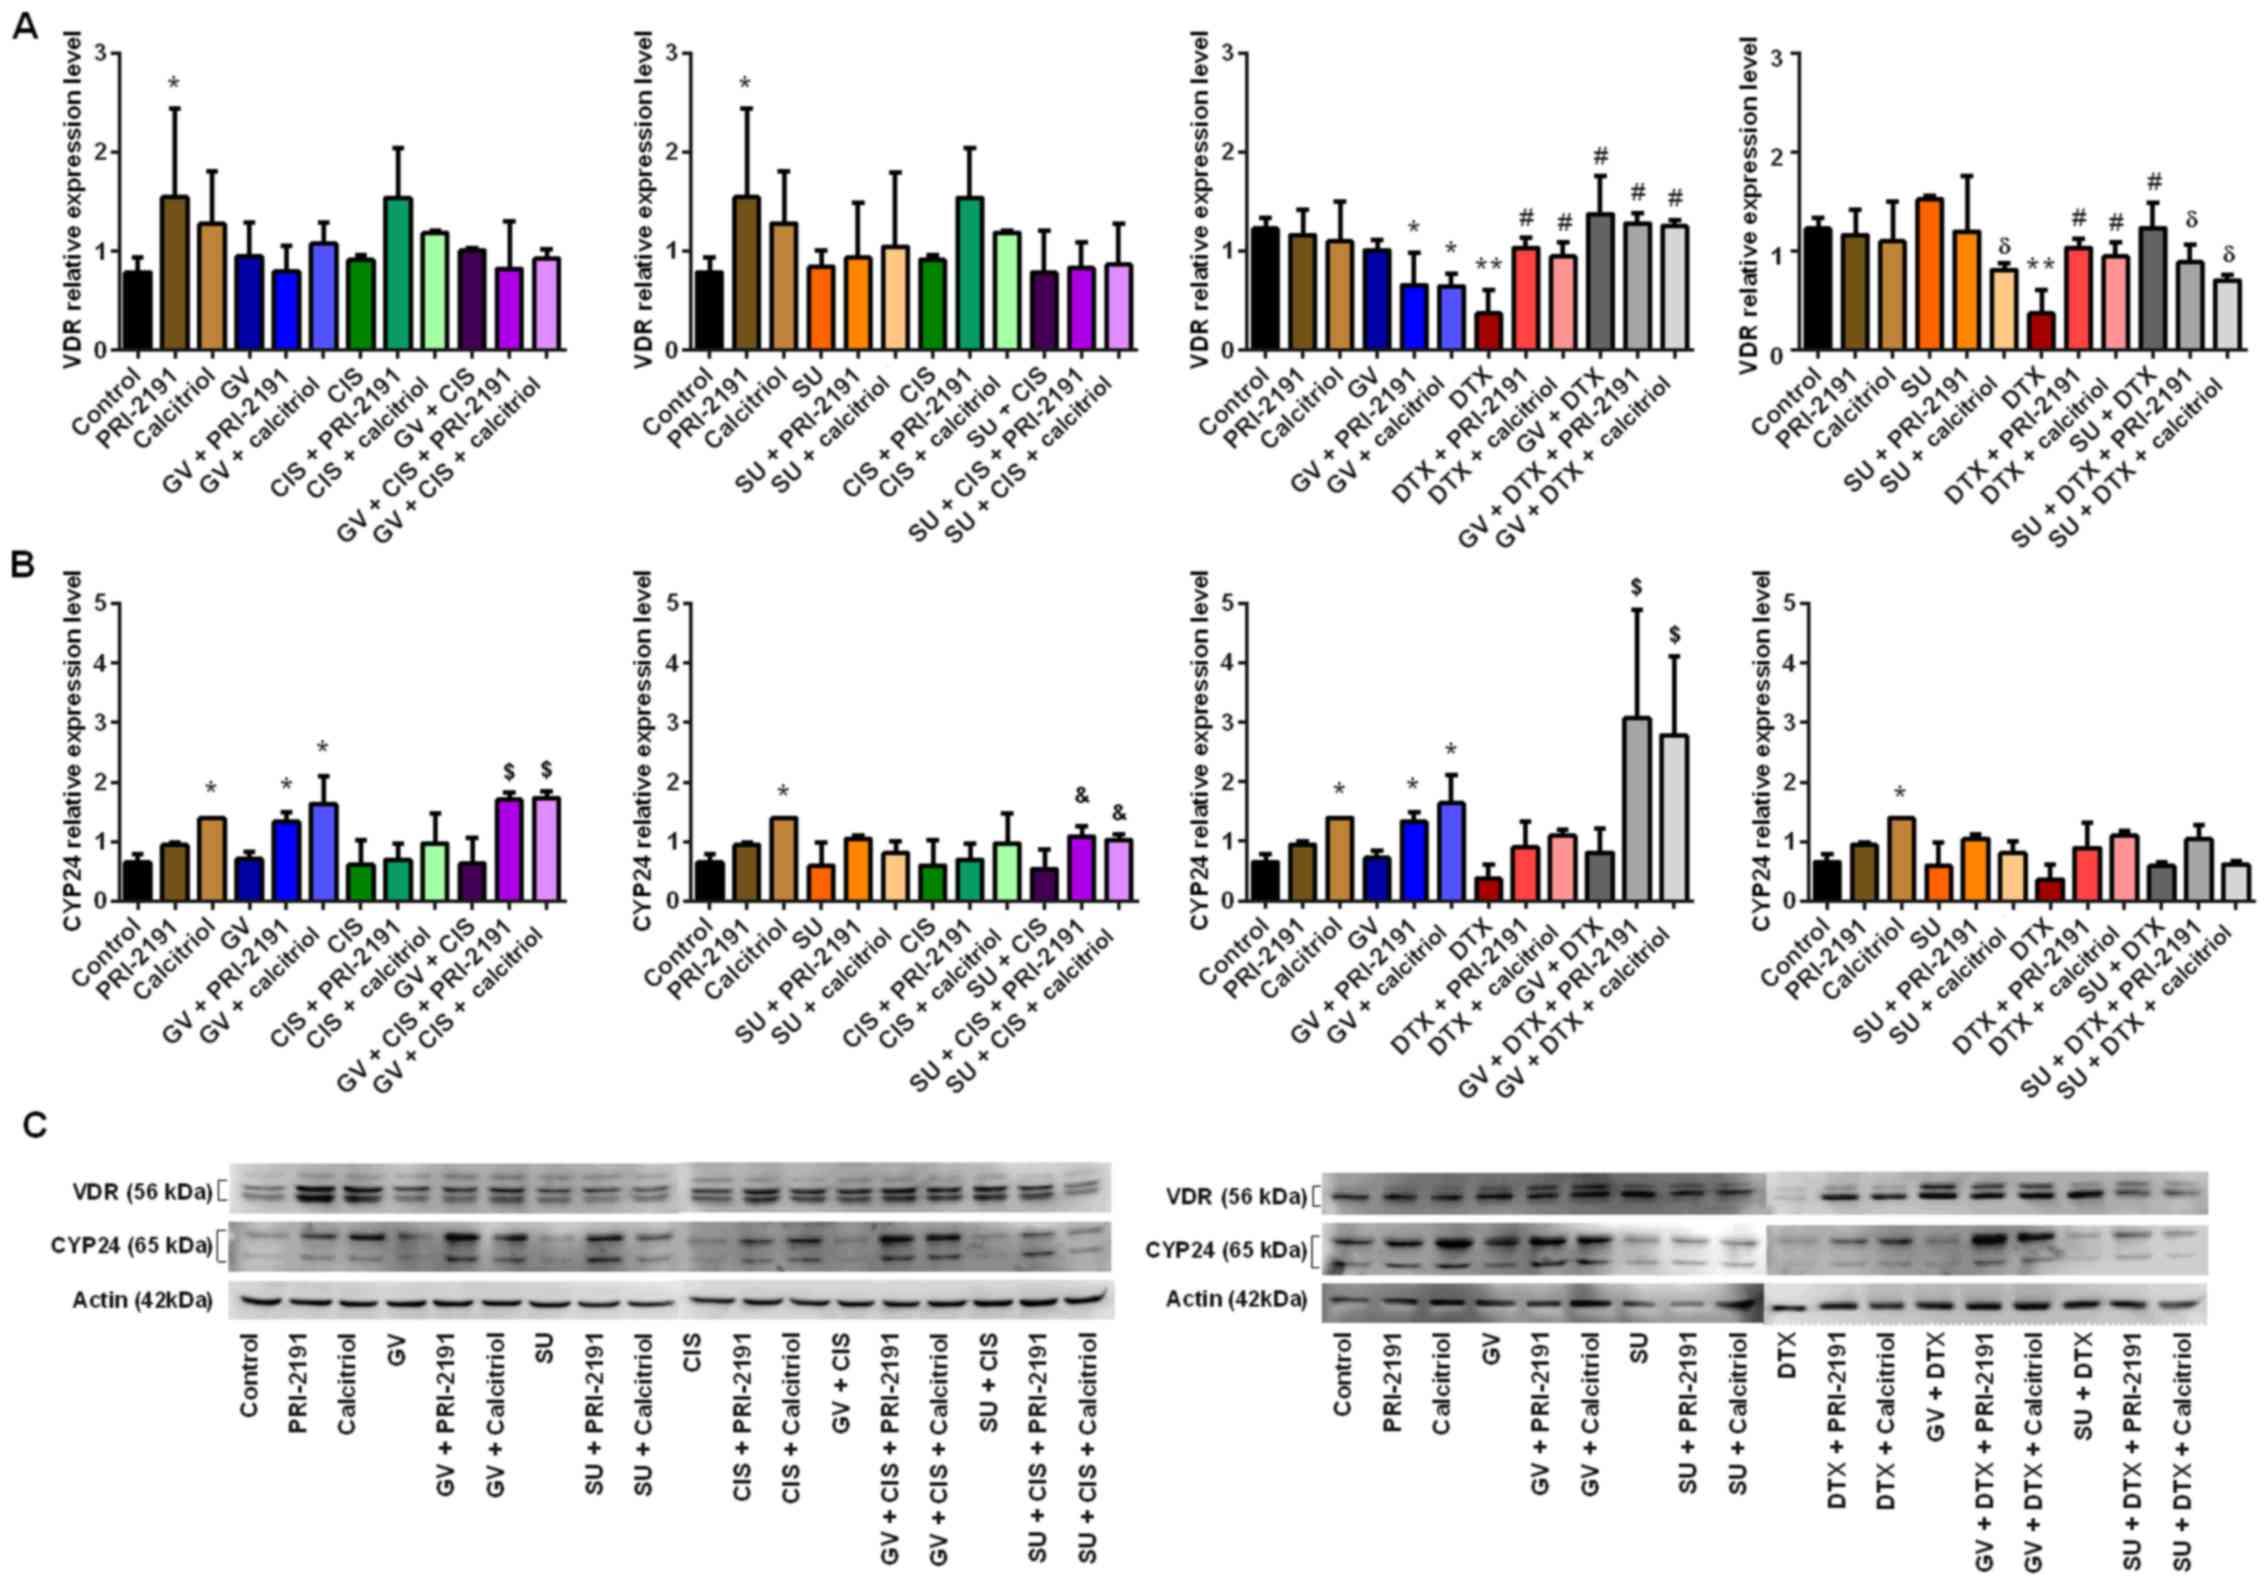 | Figure 12Effect of GV, SU, CIS, DTX, PRI-2191
and calcitriol on (A) VDR and (B) CYP24 expression in A549 cells.
Densitometric analysis was performed using ImageJ 1.46v software;
the results were normalized to actin; bars represent the means ±
SD, n=3 repeats. *p<0.05, compared with control;
**p<0.05, compared with control and TKI;
#p<0.05, compared with CYT; δp<0.05,
compared with TKI; &p<0.05, compared with TKI +
CYT; $p<0.05, compared with, TKI, CYT, and TKI + CYT
(one-way ANOVA, Fisher's test). (C) Beneath the bar charts,
representative immunoblots are presented. Note that not all the
data samples were run continuously in adjacent lanes in the same
gel, as portrayed in the figure. PRI-2191,
1,24(OH)2D3; Calcitriol,
1,25(OH)2D3. |
Treatment of the A549 cells with
1,24(OH)2D3 or
1,25(OH)2D3 resulted in the upregulation of
CYP24 expression [statistically significant for
1,25(OH)2D3]. The upregulation of CYP24 in
the A549 cells was also observed following incubation with GV in
combination with 1,24(OH)2D3 or
1,25(OH)2D3, and with GV together with CIS or
DTX and vitamin D compounds. 1,24(OH)2D3 and
1,25(OH)2D3 in combination with CIS did not
increase the level of CYP24. When used in combination with SU and
DTX, vitamin D compounds caused a small, but not significant
increase in the CYP24 expression level. The highest induction of
CYP24 protein expression was observed when the A549 cells were
incubated with GV in combination with CIS or DTX and with
1,24(OH)2D3 or
1,25(OH)2D3. Vitamin D compounds in
combination with SU together with CIS significantly increased the
CYP24 protein level compared to the cells treated with SU in
combination with CIS (Fig.
12B).
1,24(OH)2D3 and
1,25(OH)2D3 also increased the expression of
VDR in the HLMECs. A statistically significant increase in the VDR
protein expression level was observed following incubation of the
HLMECs with the test vitamin D compounds in combination with SU or
CIS or DTX or SU + CIS, SU + DTX or GV + CIS or GV + DTX (GV + DTX
+ 1,25(OH)2D3 was not significant) (Fig. 13A). Treatment of the HLMECs with
1,24(OH)2D3 or
1,25(OH)2D3 also resulted in an increase in
the CYP24 expression level compared to the untreated cells.
However, the expression level of CYP24 was lower when the
endothelial cells were treated with the vitamin D compounds in
combination with GV or GV + CIS compared to the cells treated with
the vitamin D compounds alone. An increase in CYP24 expression was
observed in the HLMECs following incubation with
1,24(OH)2D3 or
1,25(OH)2D3 in combination with SU, CIS, DTX
or their combinations compared to the untreated cells and SU alone
or CIS or DTX alone (Fig.
13B).
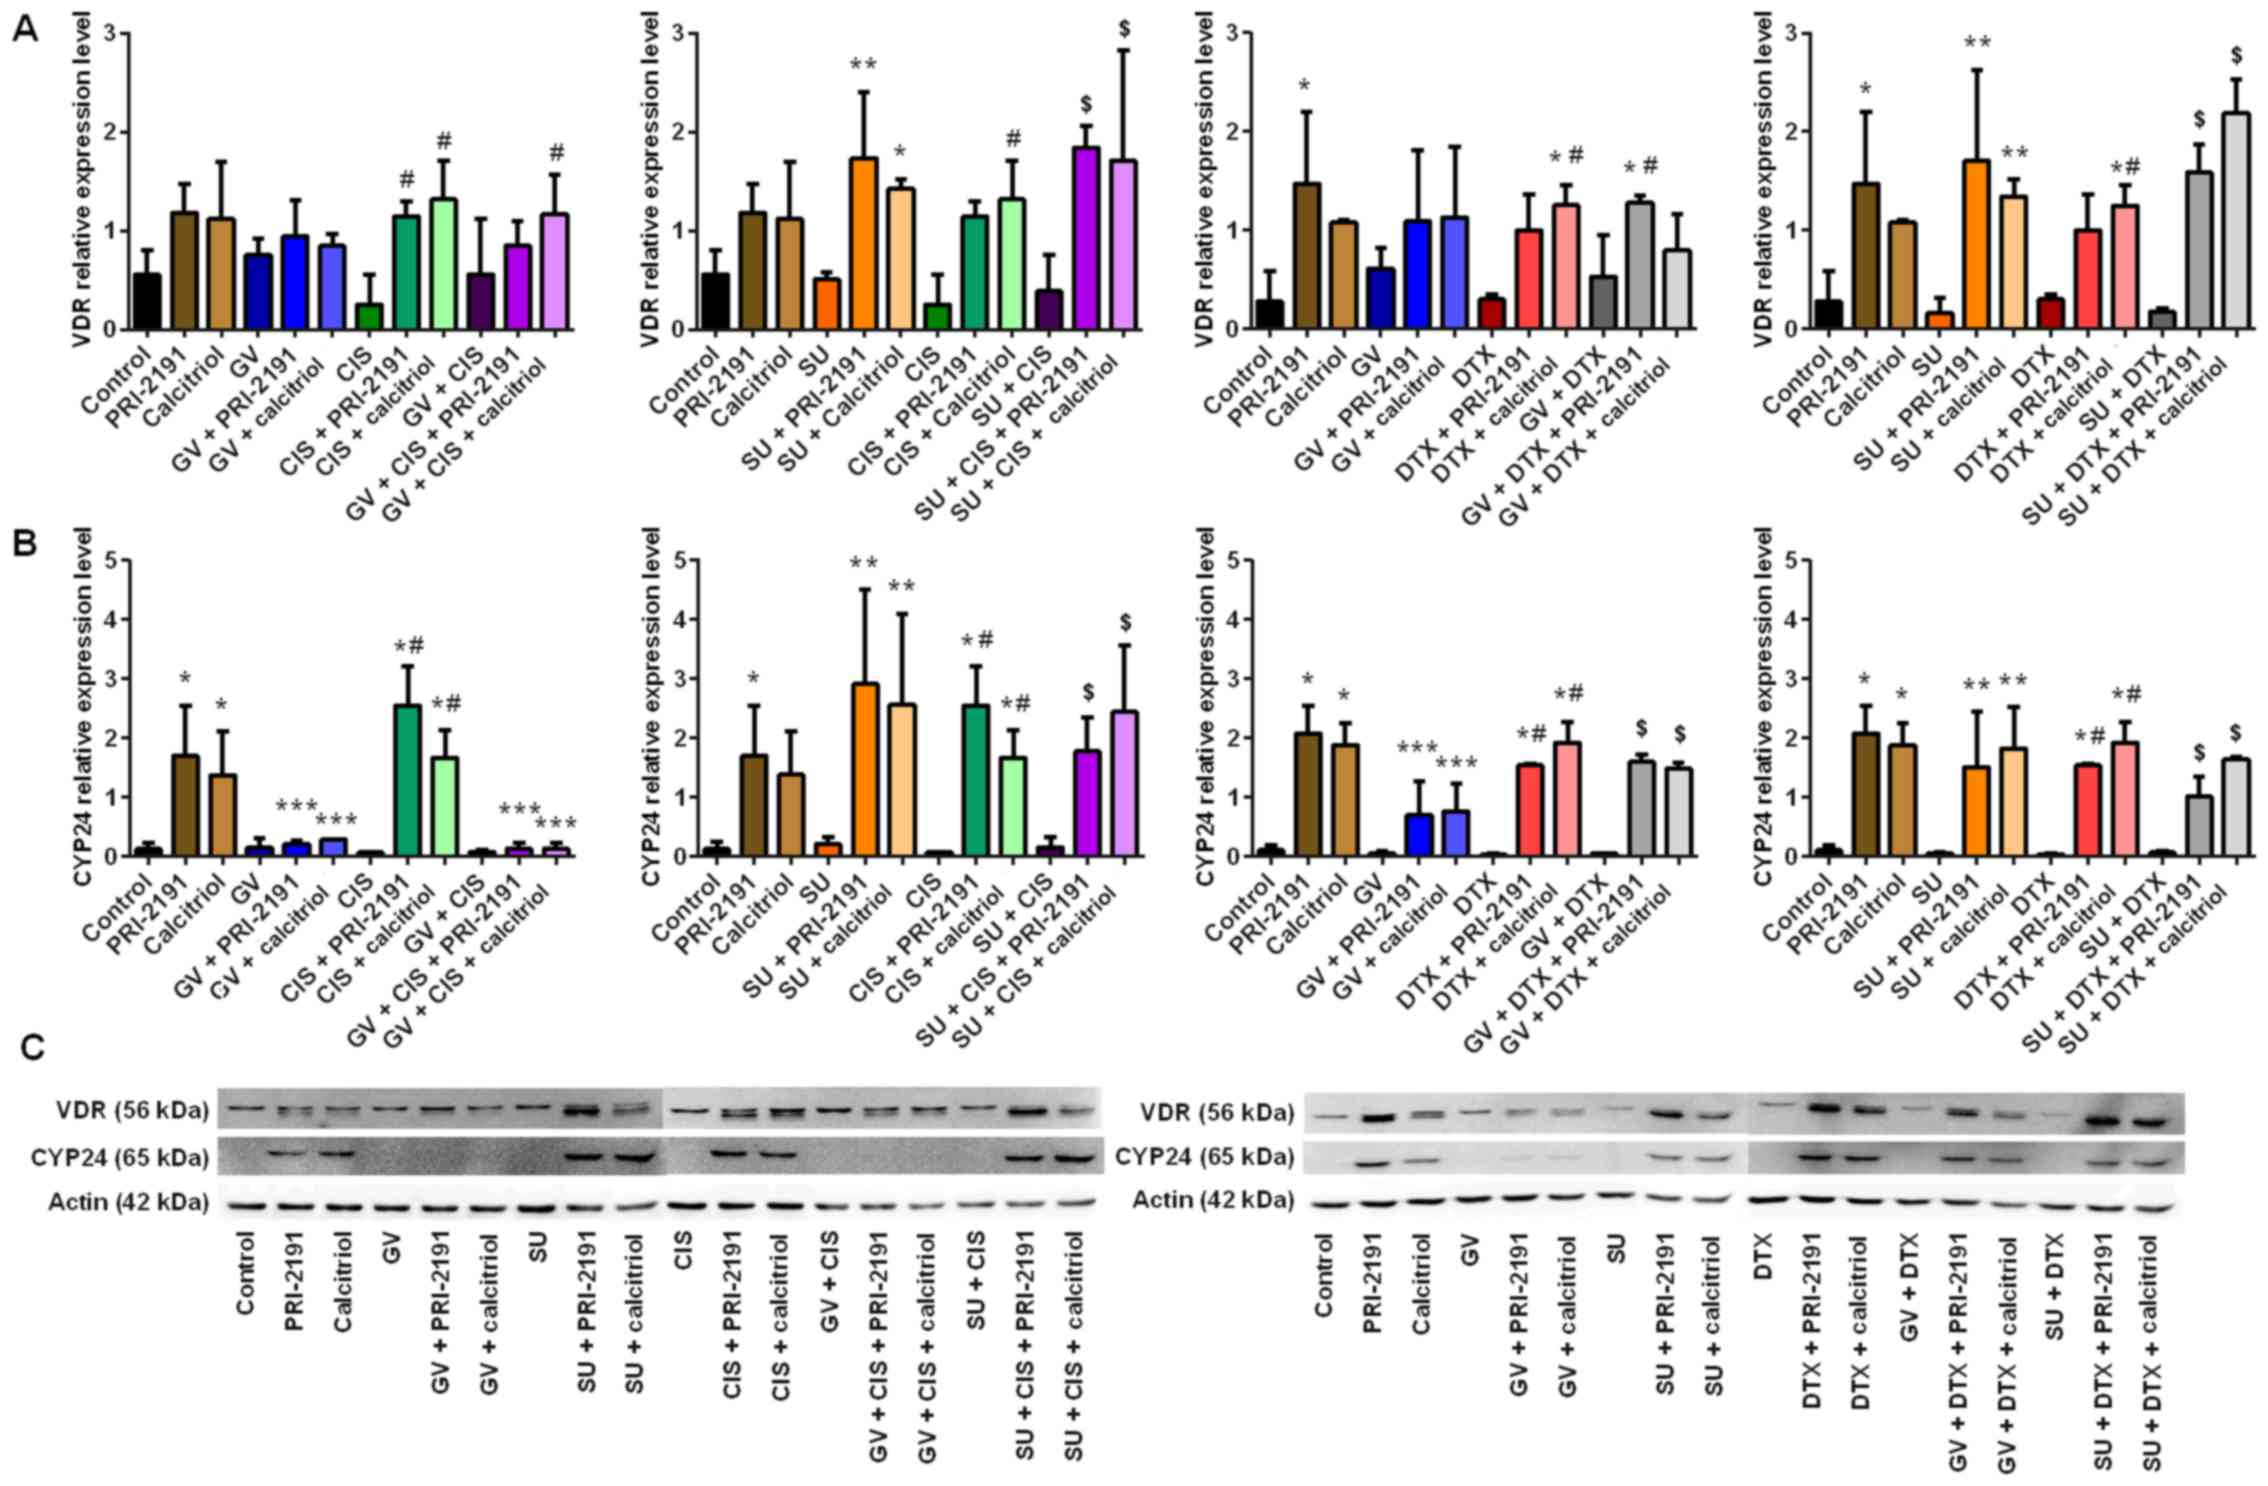 | Figure 13Effect of GV, SU, CIS, DTX, PRI-2191
and calcitriol on (A) VDR and (B) CYP24 expression in human lung
microvascular endothelial cells (HLMECs). Densitometric analysis
was performed using ImageJ 1.46v software; the results were
normalized to actin; bars represent the means ± SD, n=3 repeats.
*p<0.05, compared with control;
**p<0.05, compared with control and TKI;
***p<0.05, compared with vitamin D compounds;
#p<0.05, compared with CYT; $p<0.05,
compared with, TKI, CYT and TKI + CYT (one-way ANOVA, Fisher's
test). (C) Beneath the bar charts, representative immunoblots are
presented. Note that not all the data samples were run continuously
in adjacent lanes in the same gel, as portrayed in the figure.
PRI-2191, 1,24(OH)2D3; Calcitriol,
1,25(OH)2D3. |
Analysis of the expression levels of
TP53, VEGFA and MYC
The mRNA expression levels of TP53, VEGFA
and MYC in the A549 cells following incubation with GV, SU,
CIS, DTX, 1,24(OH)2D3 and
1,25(OH)2D3 and their combinations were
analyzed by real-time PCR with the ΔΔCt method. The expression
level of each studied mRNA was normalized to the expression level
of RPLP0 (selected as the most stable endogenous control
gene, based on the screening analysis of 16 endogenous control
candidates with the TaqMan Array Human Endogenous Control Panel
array). GV, CIS and DTX did not affect the expression of TP53,
VEGFA and MYC in the A549 cells, while SU significantly
upregulated the expression of all the tested genes. The
downregulation of TP53 in the A549 cells was observed
following combined treatment with GV, CIS and
1,24(OH)2D3 compared with the untreated and
CIS-treated cells. When SU was used in combination with CIS and the
vitamin D compounds or with DTX and
1,25(OH)2D3, the level of TP53 was
lower compared with that in the cells treated with SU used alone
(Fig. 14A). Similarly, CIS
combined with SU prevented the increase in the VEGFA or
MYC mRNA level caused by SU (p<0.05, one-way ANOVA,
Fisher's test) (Fig. 14B and
C).
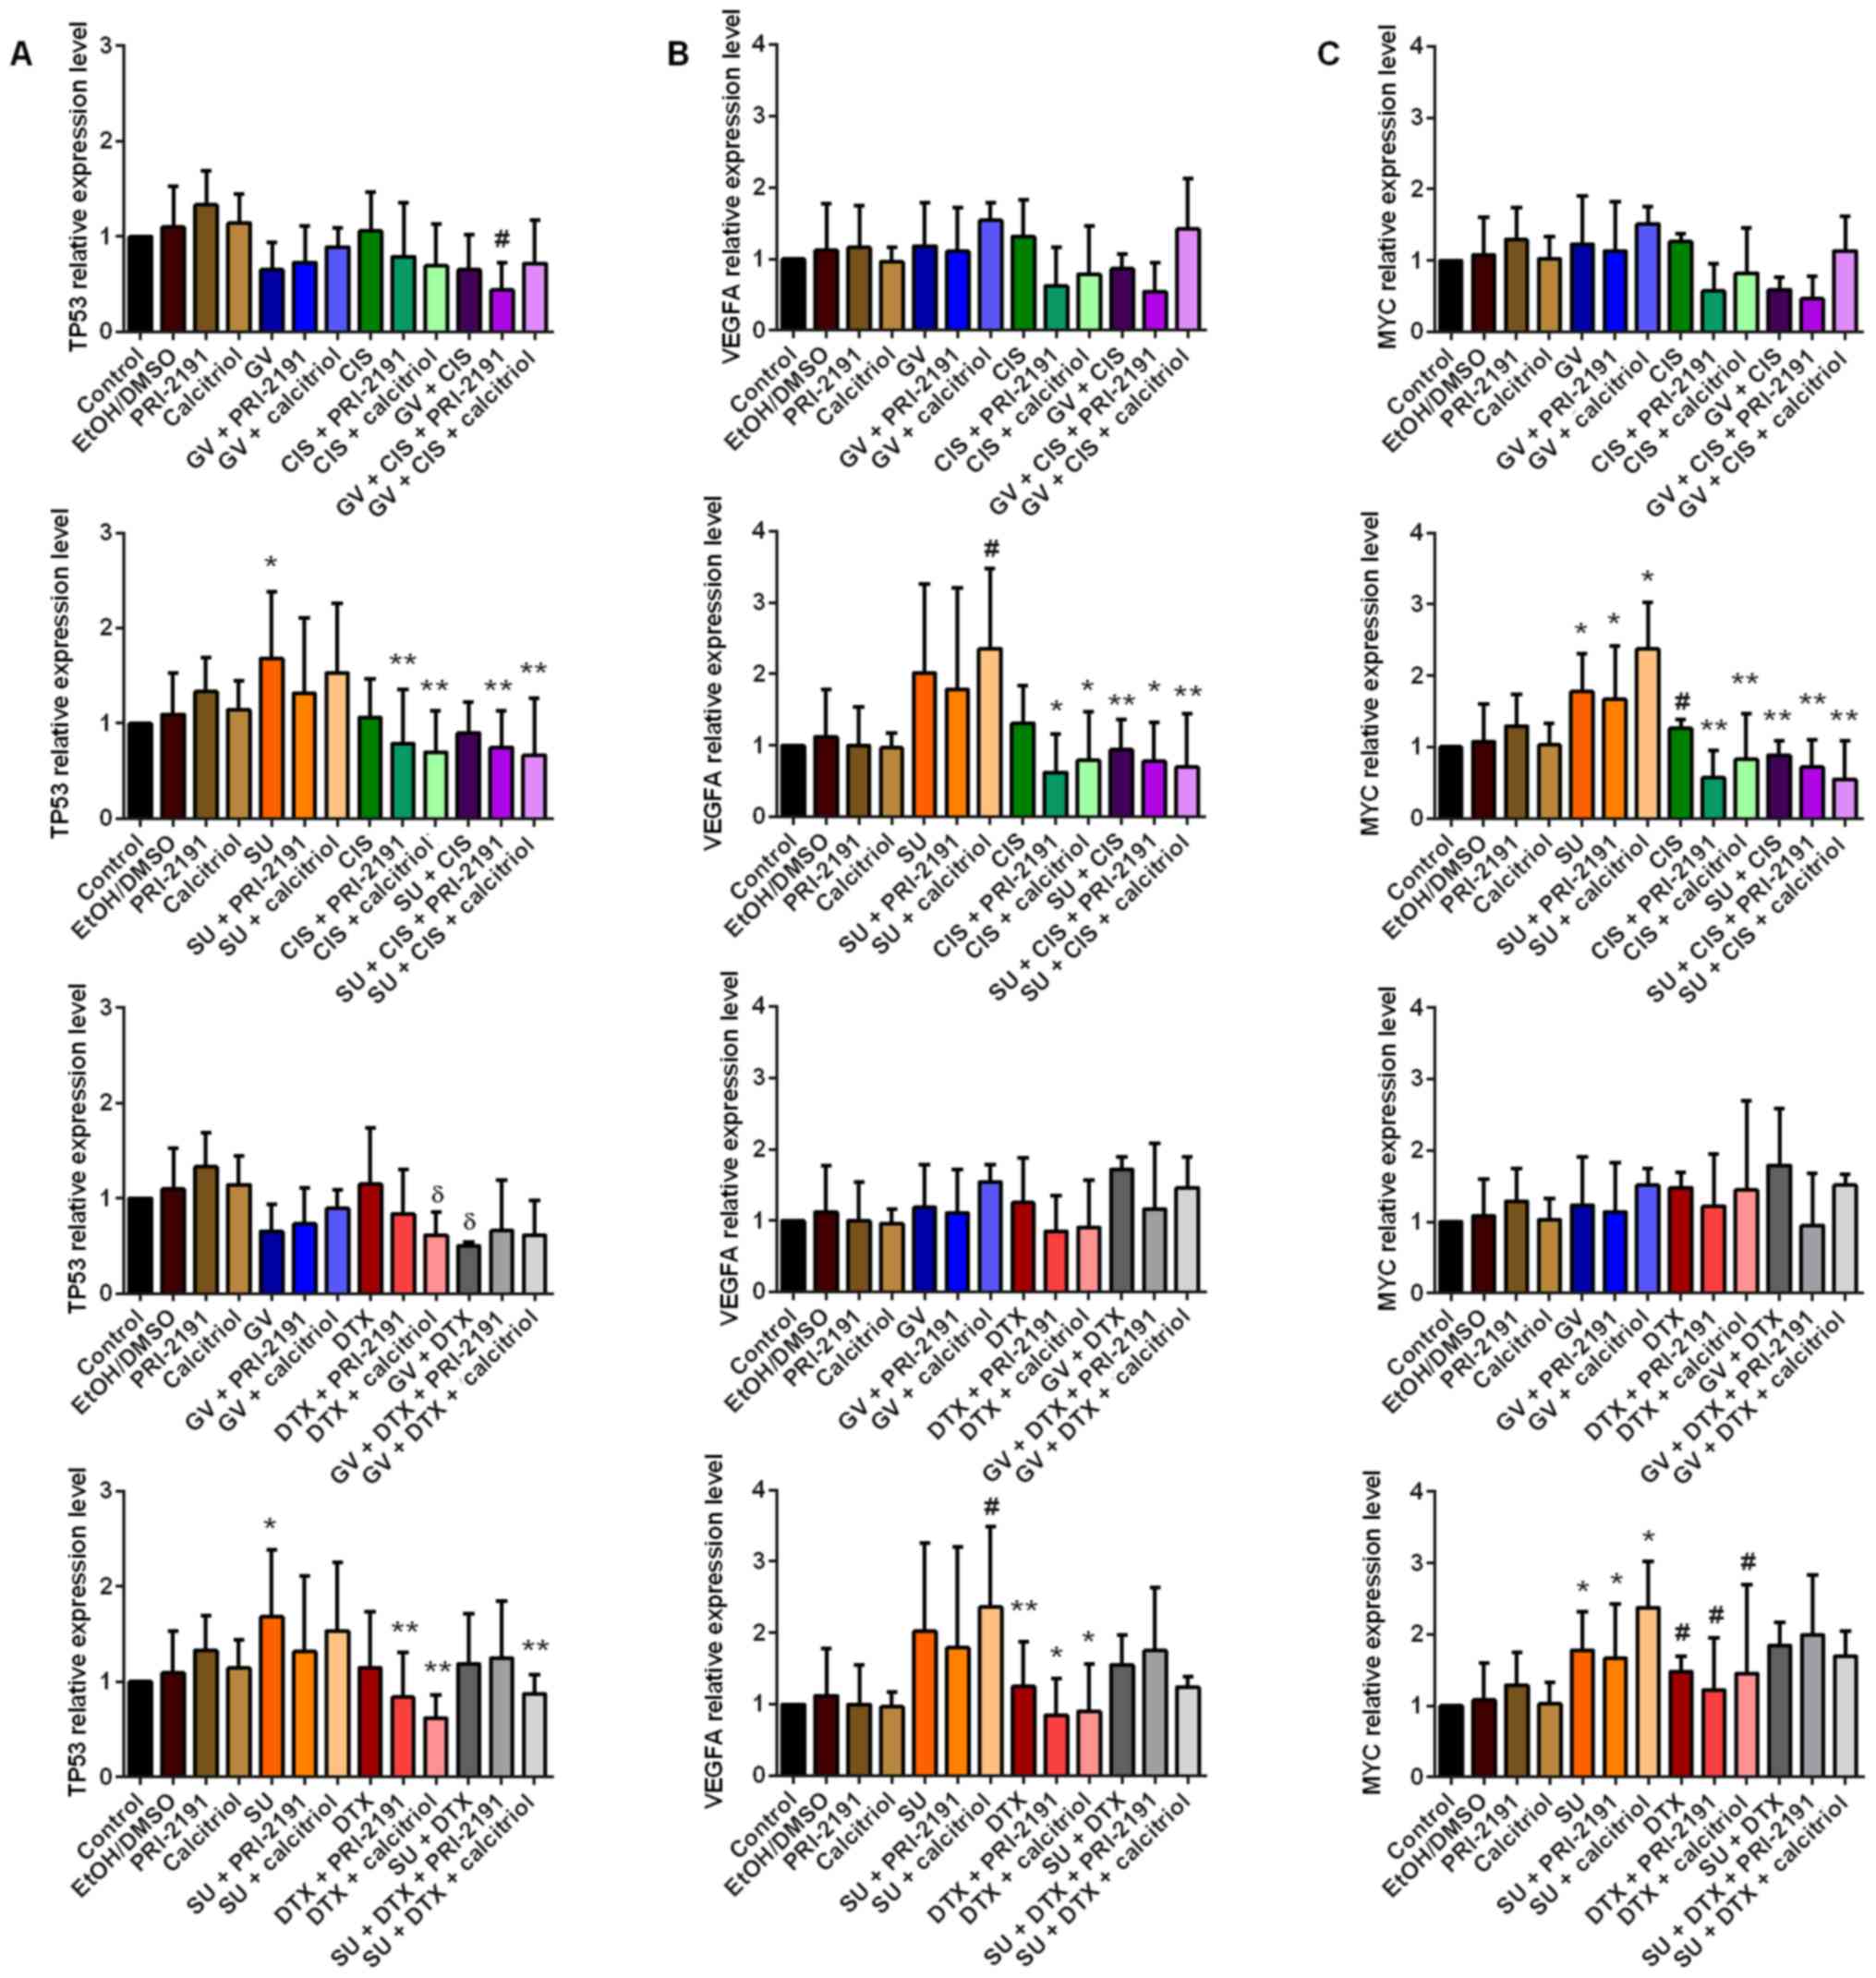 | Figure 14Real-time PCR analysis of (A)
TP53, (B) VEGFA and (C) MYC levels in A549
cells after 72 h of incubation with GV, SU, CIS, DTX, PRI-2191 and
calcitriol and their combinations. Bars represent relative
quantification (RQ) calculated in Expression Suite v1.0.3 software
with the ΔΔCt method. (A) *p<0.05, compared with
control; **p<0.05, compared with TKI;
#p<0.05, compared with control and CYT;
δp<0.05, compared with CYT; (B)
#p<0.05, compared with control;
*p<0.05, compared with SU and SU + calcitriol;
**p<0.05, compared with SU + calcitriol; (C)
*p<0.05, compared with control;
**p<0.05, compared with SU and SU + vit;
#p<0.05, compared with SU + calcitriol (one-way
ANOVA, Fisher's test). GV, imatinib; SU, sunitinib; CIS, cisplatin;
DTX, docetaxel; TKI, tyrosine kinase inhibitor; CYT, cytostatic
drug; vit, vitamin D compound (PRI-2191,
1,24(OH)2D3; Calcitriol,
1,25(OH)2D3). |
Sunitinib alone or in combination with
docetaxel and 1,24(OH)2D3 inhibits A549 tumor
growth in vivo
Mice treated with SU and DTX with or without
1,24(OH)2D3 from D23 of the experiment had
significantly smaller tumors than those in the control group mice
and mice treated with 1,24(OH)2D3 alone. From
D26, the mean tumor volume in the SU +
1,24(OH)2D3-treated mice was significantly
lower than that of the mice in the control group and mice treated
with 1,24(OH)2D3 alone. Mice treated with SU
alone had significantly smaller tumors than those of the control
group mice on D23 and between D28 and D47, and compared with
1,24(OH)2D3 from D26 to the end of
experiment. In addition, the mice treated with the triple
combination of SU, DTX and 1,24(OH)2D3 were
found to have significantly smaller tumors that the mice treated
with DTX and DTX + 1,24(OH)2D3 from D23 of
the experiment till the end. The mean tumor volume in the SU +
DTX-treated group was significantly lower than that of the
DTX-treated mice between D26 and D44 of the experiment (except for
D42) and compared with DTX + 1,24(OH)2D3 from
D23 to the final day of the experiment. In the case of the SU +
1,24(OH)2D3-treated mice, the mean tumor
volume was found to be significantly lower than that of the
DTX-treated mice (D26 and D30) and the DTX +
1,24(OH)2D3-treated mice (D26-D30 and D35-D49
of the experiment), whereas the mean tumor volume of the SU-treated
mice was significantly lower than that of the DTX +
1,24(OH)2D3-treated mice between D23 and D49
of the experiment (except for D33) (p<0.05, Kruskal-Wallis test)
(Fig. 15A).
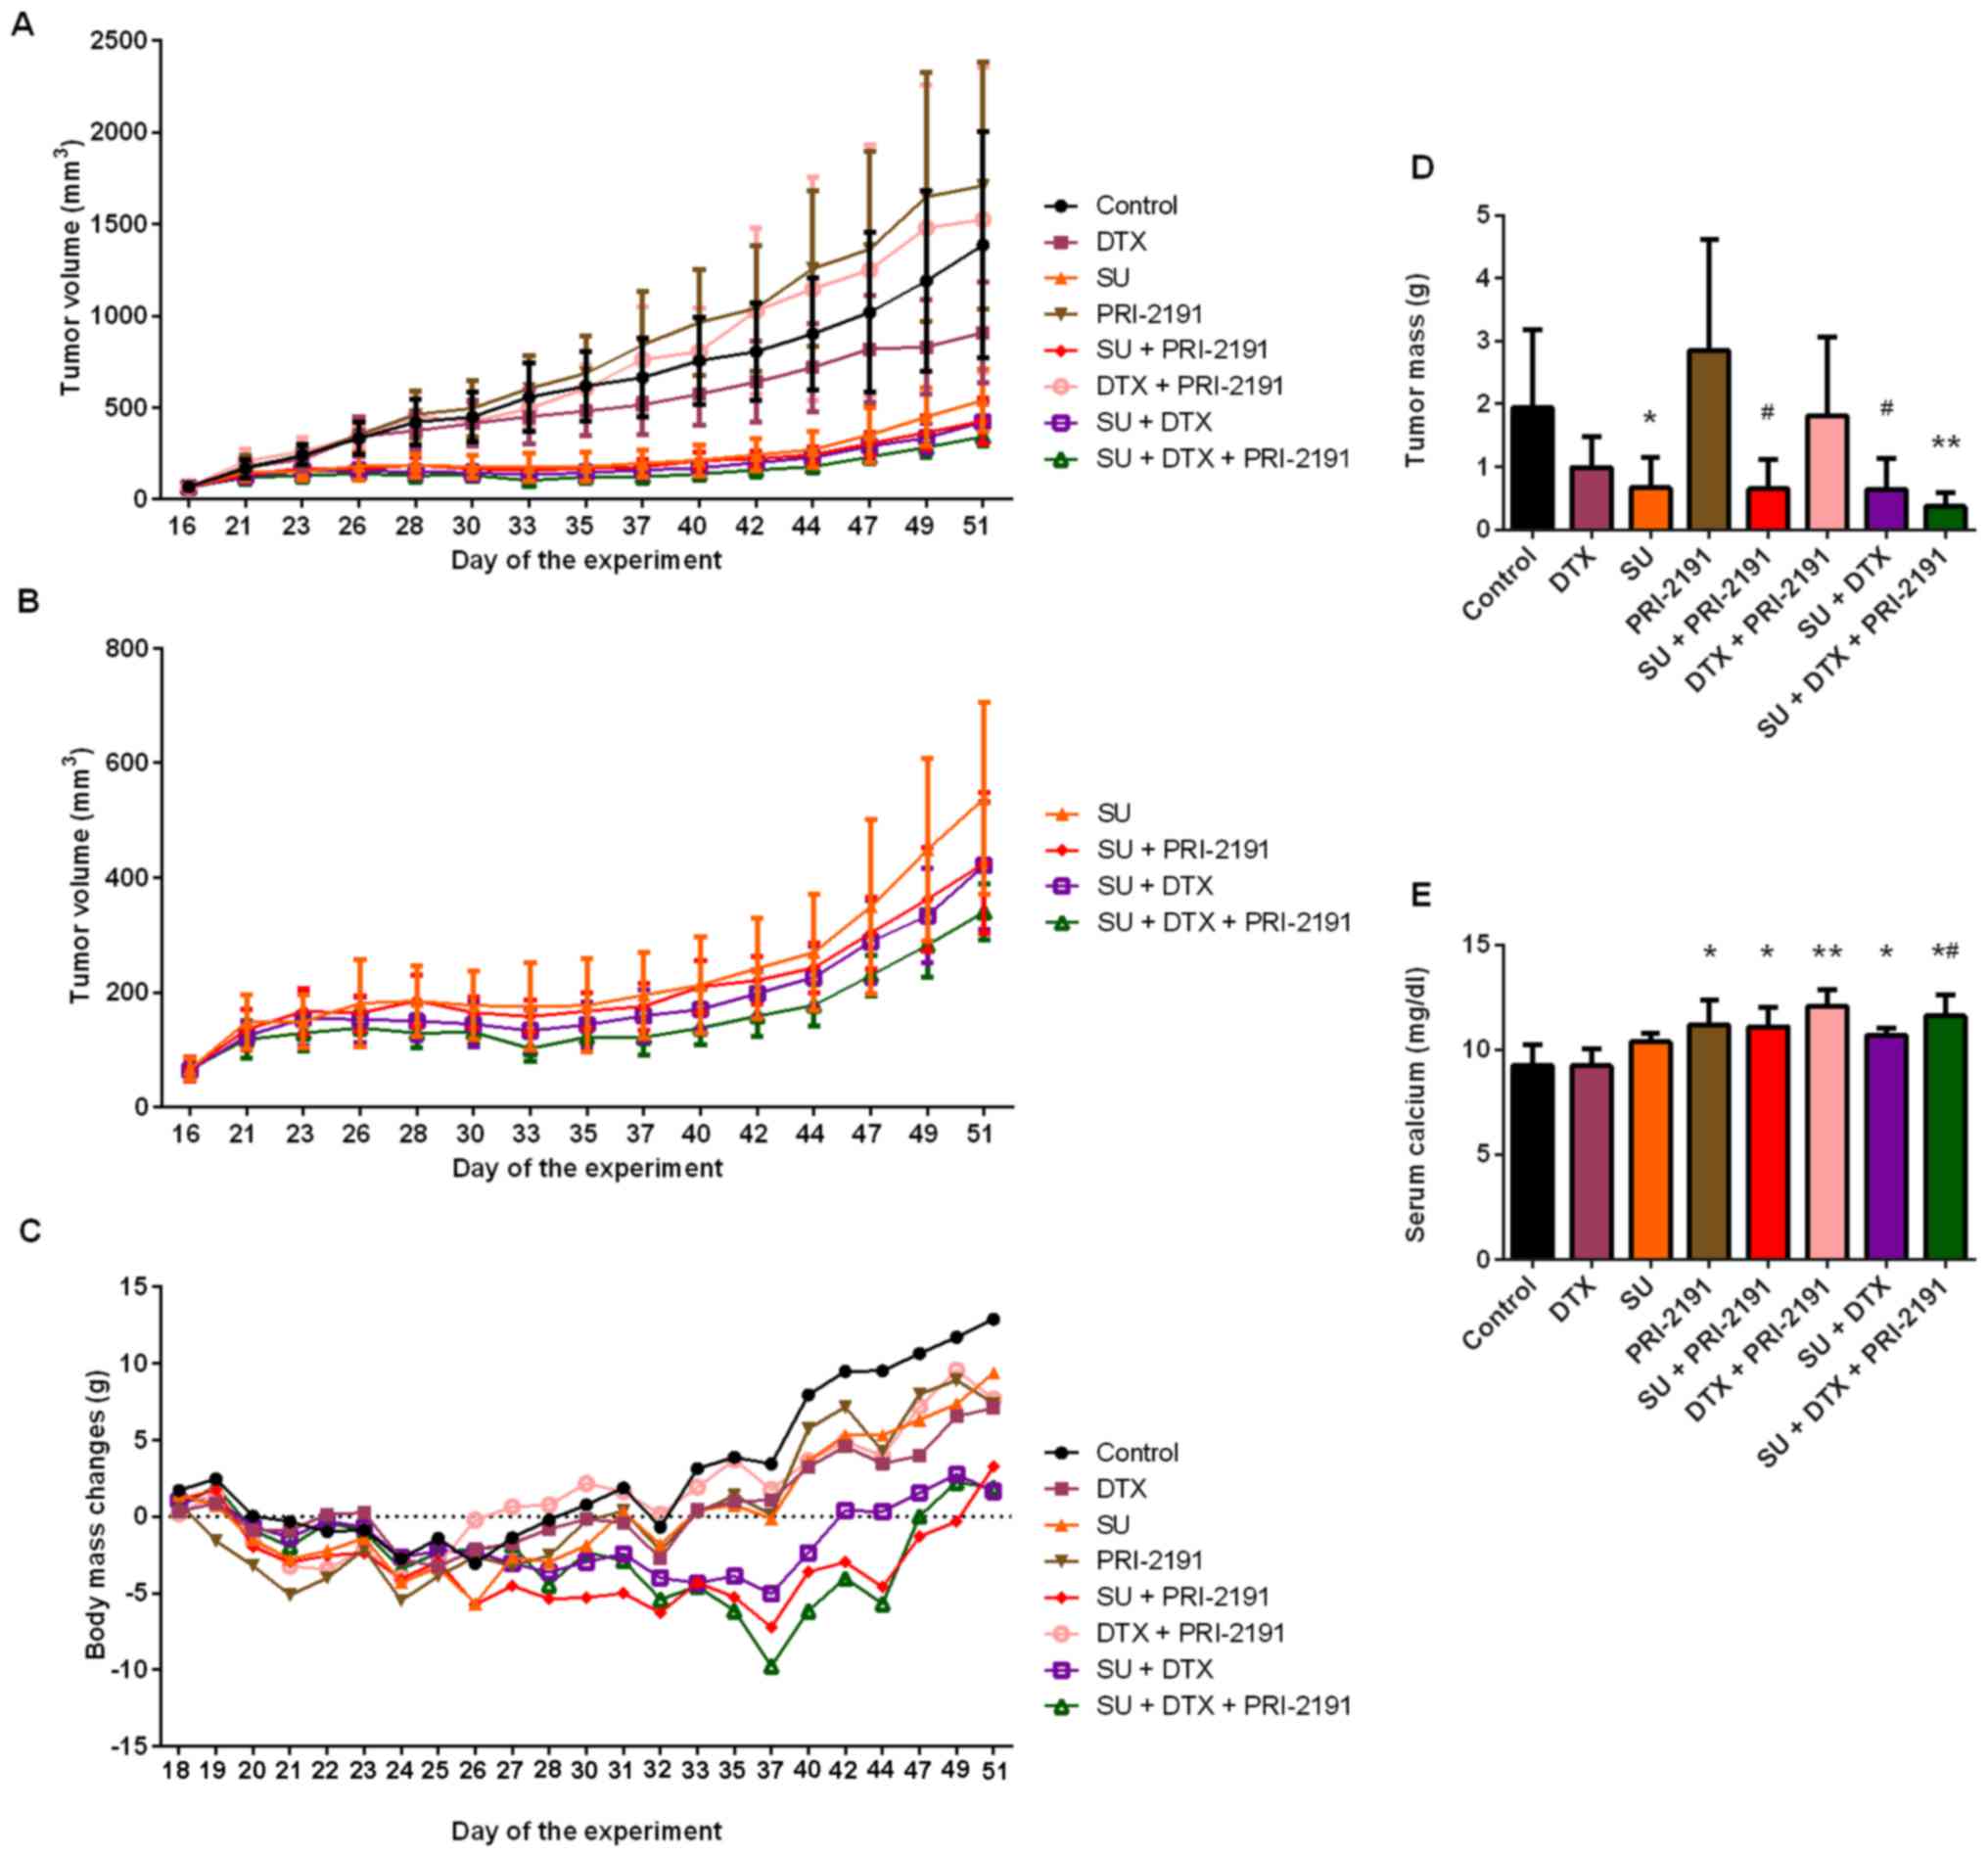 | Figure 15Antitumor activity of SU, DTX and
vitamin D analog PRI-2191 in an A549 lung cancer model in vivo. SU
was administered at the dose of 40 mg/kg/body weight daily, DTX at
5 mg/kg/body weight once a week, and PRI-2191 at 1
μg/kg/body weight 3 times a week. (A) Kinetics of A549 tumor
growth in all experimental groups; (B) comparison of groups
receiving SU alone or in combination with DTX and/or PRI-2191; (C)
body weight loss of mice bearing A549 tumors treated with SU, DTX,
and/or vitamin D analog PRI-219; (D) comparison of tumor mass on
the final day of the experiment [day (D)51]; *p<0.05,
compared to PRI-2191; #p<0.05, compared to control
and PRI-2191 group; **p<0.05, compared to control,
PRI-2191, DTX + PRI-2191, and DTX (Kruskal-Wallis test); (E)
comparison of calcium concentration in serum collected from mice
bearing A549 tumors on the final day of the experiment (D51)
treated with SU, DTX, and/or vitamin D analog PRI-2191 alone or in
combinations, *p<0.05, compared to control group and
DTX; **p<0.05, compared to control group, DTX, SU and
SU + DTX, #p<0.05, compared to SU (Tukey's test). SU,
sunitinib; DTX, docetaxel; PRI-2191,
1,24(OH)2D3. |
We also performed a comparative statistical
analysis of the 4 groups of mice treated with SU (alone or with
different combinations). According to the results, the mean tumor
volume in the SU + DTX + 1,24(OH)2D3-treated
mice was significantly lower than that of the mice receiving SU
alone on D33, D37-D42, D49 and D51; and it was significantly lower
than that of the SU + 1,24(OH)2D3-treated
mice on D28 and D33-D40 of the experiment (p<0.05,
Kruskal-Wallis test) (Fig.
15B).
On D51 of the experiment, tumors were harvested and
weighted on a scale. Mice receiving SU + DTX +
1,24(OH)2D3 had the smallest tumors with a
mean tumor mass of 0.271±0.065 g, which was significantly lower
than that of the mice in the control group, and the
1,24(OH)2D3, DTX +
1,24(OH)2D3 (p<0.01) and DTX-treated mice
(p<0.05). The mean tumor mass in mice treated with SU + DTX and
SU + 1,24(OH)2D3 was 0.510±0.225 and
0.412±0.152 g, respectively, and was significantly lower than that
of the mice in the control group (p<0.05) and
1,24(OH)2D3 (p<0.01). The mean tumor mass
in the mice treated with SU alone (0.565±0.326 g) was significantly
lower than that of the 1,24(OH)2D3-treated
mice (p<0.01) (Kruskal-Wallis test) (Fig. 15D).
Analysis of body weight loss during the
experiment
To evaluate the possible toxic effects of the
studied compounds, we measured the body mass of all mice during the
experiment and performed hematological and biochemical analysis of
the blood collected at the end of the experiment. The loss of body
weight was observed during the experiment, but it did not exceed
10%. In the mice treated with SU or
1,24(OH)2D3 alone, loss of body weight ranged
from 3 to 6% (D24-D28). For the mice treated with SU +
1,24(OH)2D3, loss of body weight was between
3–7% from D21 and D44. Treatment with SU + DTX was well-tolerated;
maximal body weight loss was found to be 5% on D37, whereas for the
mice treated with SU + DTX + 1,24(OH)2D3, it
was between 3–10% from D28 and D40. From D37, the administration of
SU and DTX was terminated, and the mice began to recover with a
gain in body weight (Fig.
15C).
Analysis of internal organs
We did not observe any splenomegaly and
hepatomegaly during the dissection of the animals at the end of the
experiment or any macroscopic changes in the internal organs.
However, there were some differences in liver mass between the
following treatment groups: SU vs. control,
1,24(OH)2D3, and DTX +
1,24(OH)2D3 and SU + DTX vs. DTX +
1,24(OH)2D3. The mean kidneys mass in the SU
+ DTX-treated mice was lower than that of the control group mice
(p<0.05, multiple comparison Kruskal-Wallis test) (Table V).
| Table VAnalysis of the mass of different
internal organs (g) harvested from mice treated with SU, DTX and
vitamin D analog PRI-2191 at the end of the experiment [day
(D)51]. |
Table V
Analysis of the mass of different
internal organs (g) harvested from mice treated with SU, DTX and
vitamin D analog PRI-2191 at the end of the experiment [day
(D)51].
| Group/tissue | Liver (g) | Spleen (g) | Kidneys (g) | Heart (g) | Body mass on
D51a (g) |
|---|
| Control | 1.22±0.10 | 0.100±0.061 | 0.222±0.022 | 0.274±0.033 | 0.127±0.025 |
| DTX | 1.16±0.09 | 0.089±0.042 | 0.193±0.029 | 0.263±0.019 | 0.121±0.021 |
| SU | 1.05±0.07b | 0.083±0.030 | 0.175±0.015d | 0.245±0.025 | 0.111±0.013 |
| PRI-2191 | 1.23±0.14 | 0.160±0.071 | 0.184±0.034 | 0.255±0.042 | 0.116±0.035 |
| SU + PRI-2191 | 1.15±0.14 | 0.104±0.069 | 0.189±0.031 | 0.238±0.035 | 0.105±0.016 |
| DTX + PRI-2191 | 1.27±0.16 | 0.129±0.041 | 0.198±0.045 | 0.257±0.025 | 0.107±0.028 |
| SU + DTX | 1.02±0.17c | 0.105±0.026 | 0.174±0.032d | 0.220±0.031d | 0.100±0.019 |
| SU + DTX +
PRI-2191 | 1.05±0.10 | 0.098±0.028 | 0.194±0.019 | 0.240±0.031 | 0.102±0.009 |
Hematological analysis of blood harvested
from mice treated with SU, DTX and
1,24(OH)2D3
We performed hematological analysis of blood
collected from all mice. No significant changes in red blood cell
(RBC) count were observed between the treatment groups. The mean
hemoglobin (Hgb) concentration and hematocrit (Ht) were found to be
the highest in the DTX-treated mice and differed significantly from
those of the 1,24(OH)2D3-treated mice: Hgb,
13.25±0.57 g/dl; and Ht, 36.34±1.92% for DTX-treated mice; and Hgb,
11.05±1.58 g/dl; and Ht, 30.57±4.76% for
1,24(OH)2D3-treated mice. Furthermore,
statistical analysis revealed that the mean corpuscular volume
(MCV) and mean corpuscular hemoglobin (MHC) in the
1,24(OH)2D3-treated mice were significantly
lower than those of the SU-, SU +
1,24(OH)2D3- and SU + DTX-treated mice. In
addition, the MCV in the SU- and SU + DTX-treated mice was
significantly higher than that of the DTX +
1,24(OH)2D3-treated mice. In case of MCH,
statistically significant difference was found between SU and DTX +
1,24(OH)2D3-treated mice. Moreover,
hematological analysis indicated that the red blood cell
distribution width (RDW) in the SU-, SU + DTX- and SU + DTX +
1,24(OH)2D3-treated mice was higher than that
of the mice in the control group, and the DTX- and
1,24(OH)2D3-treated mice (p<0.05,
Kruskal-Wallis test). No significant differences were found in the
case of the mean corpuscular hemoglobin concentration (MCHC)
between the experimental groups (Table VI).
| Table VIAnalysis of red blood cell parameters
in blood collected from mice treated with SU, DTX and/or vitamin D
analog PRI-2191. |
Table VI
Analysis of red blood cell parameters
in blood collected from mice treated with SU, DTX and/or vitamin D
analog PRI-2191.
|
Group/parameter | RBC
(×106/μl) | Hgb
(g/dl) | Ht
(%) | MCV
(fl) | MCH
(pg) | MCHC
(g/dl) | RDW
(%) |
|---|
| Control | 7.0±1.3 | 12.6±1.4 | 34.9±6.1 | 50.2±3.4 | 18.6±4.2 | 37.2±8.7 | 16.9±1.6 |
| DTX | 7.4±0.4 | 13.3±0.6 | 36.3±1.9 | 49.1±1.0 | 17.9±0.7 | 36.5±0.8 | 17.0±0.6 |
| SU | 6.6±1.7 | 12.1±1.7 | 34.3±3.7 | 51.7±1.7b | 18.2±0.9d | 35.1±1.9 | 19.3±1.0e |
| PRI-2191 | 6.6±1.0 | 11.0±1.6a | 30.6±4.8a | 46.5±2.0c | 16.8±0.6c | 36.3±1.2 | 16.8±1.1 |
| SU + PRI-2191 | 6.5±0.7 | 11.9±1.4 | 33.3±3.7 | 51.1±2.1 | 18.3±0.9 | 35.8±0.6 | 18.8±0.7 |
| DTX + PRI-2191 | 7.5±1.3 | 12.8±2.1 | 35.9±5.7 | 47.9±1.5 | 17.1±0.4 | 35.7±1.2 | 17.7±1.0 |
| SU + DTX | 6.6±0.7 | 12.0±1.3 | 33.7±3.6 | 50.8±1.2b | 18.1±0.3 | 35.6±0.4 | 19.8±1.5e |
| SU + DTX +
PRI-2191 | 6.7±0.7 | 12.1±1.0 | 33.5±2.7 | 49.8±1.8 | 17.9±0.7 | 36.1±0.4 | 19.1±0.7e |
In the case of the white blood cell (WBC) count, we
found that treatment with 1,24(OH)2D3
resulted in a higher count than that of the control group and
SU-treated mice, and also resulted in a higher number of
lymphocytes (Lymph) compared with the control group. Moreover,
treatment with 1,24(OH)2D3 resulted in a
significantly higher number of granulocytes (Gran) and monocytes
(Mono) in peripheral blood compared with the SU and SU +
1,24(OH)2D3-treated mice. Treatment with
1,24(OH)2D3 also resulted in a significantly
higher number of granulocytes compared to the control group and DTX
group (p<0.05, Kruskal-Wallis test). A significantly higher
percentage of lymphocytes and lower percentage of granulo-cytes was
observed in blood collected from mice treated with a combination of
SU and 1,24(OH)2D3 with or without DTX
compared with the mice in the control group and mice treated with
1,24(OH)2D3 alone [Gran only in the case of
triple combination of SU + DTX +
1,24(OH)2D3]. The percentage of Gran in the
1,24(OH)2D3-treated mice was significantly
higher than that of the SU-treated mice. No significant differences
were observed in the percentage of monocytes between the treatment
groups (p<0.05, Kruskal-Wallis test) (Table VII).
| Table VIIAnalysis of white blood cell
parameters in blood collected from mice treated with SU, DTX and/or
vitamin D analog PRI-2191. |
Table VII
Analysis of white blood cell
parameters in blood collected from mice treated with SU, DTX and/or
vitamin D analog PRI-2191.
|
Group/parameter | WBC
(×103/μl) | Lymph
(×103/μl) | Mono
(×103/μl) | Gran
(×103/μl) | Lymph
(%) | Mono
(%) | Gran
(%) |
|---|
| Control | 6.5±3.7 | 2.4±1.2 | 1.0±0.4 | 3.2±2.4 | 37.4±8.1 | 16.8±4.1 | 45.8±8.9 |
| DTX | 7.7±4.6 | 3.5±1.8 | 1.1±0.8 | 3.1±2.5 | 47.9±15.9 | 15.0±4.0 | 37.1±12.9 |
| SU | 5.6±2.3 | 2.7±1.2 | 0.8±0.4 | 2.1±1.0 | 48.9±9.1 | 14.7±3.8 | 36.5±6.8 |
| PRI-2191 | 13.6±5.7a | 4.9±1.8a | 2.1±1.1b | 6.7±3.1b | 36.9±6.0 | 14.9±2.6 | 48.2±6.2d |
| SU + PRI-2191 | 6.8±2.6 | 3.7±1.7 | 0.9±0.4 | 2.2±1.2 |
53.9±10.8c | 13.9±4.5 | 32.2±9.2 |
| DTX + PRI-2191 | 9.4±2.2 | 3.7±1.0 | 1.3±0.5 | 4.3±1.7 | 40.2±9.1 | 14.3±3.4 | 45.6±10.5 |
| SU + DTX | 7.1±1.5 | 3.0±0.5 | 1.2±0.3 | 2.9±0.8 | 42.5±4.4 | 16.8±1.5 | 40.7±3.9 |
| SU + DTX +
PRI-2191 | 7.9±2.3 | 3.9±1.0 | 1.3±0.5 | 2.7±0.9 | 50.6±5.5c | 16.1±2.2 | 33.2±3.4c |
The analysis of platelet parameters revealed no
significant changes in the number of platelets (PLT) and
plateletcrit (PCT) between the experimental groups. However, we
found that the mean platelet volume (MPV) in the SU + DTX-,
1,24(OH)2D3- and DTX +
1,24(OH)2D3-treated mice was significantly
higher than that of the control group mice and DTX-treated mice
(DTX only in case of DTX + 1,24(OH)2D3). In
addition, the 1,24(OH)2D3- and DTX +
1,24(OH)2D3-treated mice were characterized
by a higher platelet distribution width (PDW), the parameter
reflecting how uniform the platelets are in size, than that of the
control group mice, and SU- and SU +
1,24(OH)2D3-treated mice (only for DTX +
1,24(OH)2D3) (p<0.05, Kruskal-Wallis test)
(Table VIII).
| Table VIIIAnalysis of platelets parameters in
blood collected from mice treated with SU, DTX and/or vitamin D
analog PRI-2191. |
Table VIII
Analysis of platelets parameters in
blood collected from mice treated with SU, DTX and/or vitamin D
analog PRI-2191.
|
Group/parameter | PLT
(×103/μl) | MPV (fl) | PDW (fl) | PCT (%) |
|---|
| Control | 1270.9±233.4 | 5.1±0.4 | 14.8±1.6 | 0.65±0.12 |
| DTX | 1202.2±186.6 | 5.1±0.3 | 15.2±1.8 | 0.61±0.11 |
| SU | 1142.5±184.0 | 5.2±0.2 | 14.4±1.7 | 0.59±0.09 |
| PRI-2191 | 1345.9±183.9 | 5.5±0.2a | 18.3±2.5c | 0.74±0.10 |
| SU + PRI-2191 | 1181.3±176.8 | 5.2±0.3 | 14.6±1.9 | 0.62±0.11 |
| DTX + PRI-2191 | 1010.1±292.2 | 5.5±0.2b | 19.5±4.1d | 0.55±0.15 |
| SU + DTX | 1260.5±212.5 | 5.5±0.2a | 16.2±1.7 | 0.69±0.12 |
| SU + DTX +
PRI-2191 | 1301.1±224.8 | 5.4±0.2 | 16.0±2.0 | 0.70±0.12 |
Biochemical analysis of blood harvested
from mice treated with SU, DTX and
1,24(OH)2D3
The lowest serum calcium level was found to be in
the control group and DTX-treated mice, 9.25±1.00 and 9.25±0.82
mg/dl, respectively, whereas the highest concentration (12.09±0.76
mg/dl) was found to be in the DTX +
1,24(OH)2D3-treated mice and was
significantly higher than the control group mice and DTX-, SU-, or
SU + DTX-treated mice. The mean serum calcium concentration was
found to be in mice treated with 1,24(OH)2D3,
SU + 1,24(OH)2D3, SU + DTX, and SU + DTX +
1,24(OH)2D3, which was significantly higher
than the control group and DTX-treated mice. In addition, mice
treated with the triple combination of SU, DTX and
1,24(OH)2D3 had a significantly higher level
of serum calcium than that of the SU-treated mice (11.62±1.00 and
10.38±0.40 mg/dl, respectively) (p<0.05, Tukey's test) (Fig. 15E). No significant changes were
observed in the phosphate levels between the treatment groups
(Table IX). In addition, no
significant changes were observed for alanine (ALT) and aspartate
(AST) aminotransferase activity, as well as the total bilirubin
content. The highest alkaline phosphatase (ALP) activity was noted
in the mice treated with SU and SU + DTX +
1,24(OH)2D3 (57.8±15.7 and 59.0±15.9 U/l,
respectively), which differed significantly compared to that of the
1,24(OH)2D3-treated mice (34.5±10.0 U/l)
(p<0.05, Kruskal-Wallis test). The mice treated with SU + DTX
had a significantly higher plasma urea concentration (8.15±1.33
mmol/l) than that of the DTX-treated mice (p<0.05,
Kruskal-Wallis test). In the case of uric acid, the statistically
significant higher level of plasma uric acid was observed in the
1,24(OH)2D3-treated mice compared with the
control group mice (196.6±28.3 and 274.1±48.6 μmol/l,
respectively) (p<0.05, Tukey's test) (Table IX). No significant changes were
observed in the case of the creatinine concentration.
| Table IXBiochemical analysis of blood
harvested from mice bearing A549 tumor treated with SU, DTX, and/or
vitamin D analog PRI-2191 alone or in combinations. |
Table IX
Biochemical analysis of blood
harvested from mice bearing A549 tumor treated with SU, DTX, and/or
vitamin D analog PRI-2191 alone or in combinations.
|
Parameter/group | Control | DTX | SU | PRI-2191 | SU + PRI-2191 | DTX + PRI-2191 | SU + DTX | SU + DTX +
PRI-2191 |
|---|
| ALT (U/l) | 26.3±6.7 | 27.7±4.9 | 33.9±6.6 | 25.8±3.0 | 27.3±2.5 | 30.8±11.4 | 28.3±8.1 | 28.2±4.6 |
| AST (U/l) | 161.6±38.1 | 177.2±51.4 | 221.4±68.5 | 157.7±27.9 | 162.1±31.9 | 160.5±34.8 | 177.0±58.0 | 175.7±43.8 |
| Bilirubin
(μmol/l) | 1.69±0.59 | 1.53±0.29 | 2.29±0.68 | 1.63±0.43 | 1.98±0.76 | 1.77±0.41 | 2.32±0.55 | 2.26±0.60 |
| ALP (U/l) | 50.1±12.5 | 52.8±13.4 |
57.8±15.7a | 34.5±10.0 | 52.8±18.1 | 41.4±17.3 | 50.9±11.6 |
59.0±15.9a |
| Cholesterol
(mmol/l) | 2.19±0.30 | 2.41±0.38 | 2.20±0.23 | 1.96±0.39 | 2.16±0.57 | 2.35±0.47 | 2.34±0.24 |
2.52±0.21a |
| Phosphates
(mmol/l) | 3.15±0.31 | 3.41±0.30 | 3.73±0.52 | 3.44±0.44 | 3.45±0.29 | 3.65±0.29 | 3.53±0.40 | 3.34±0.30 |
| Glucose
(mmol/l) | 3.50±0.69 | 3.07±0.92 | 3.70±0.43 | 3.75±0.96 | 3.95±1.11 | 3.80±1.06 | 3.36±1.13 | 3.83±0.80 |
| Creatinine
(μmol/l) | 12.15±5.68 | 7.68±2.10 | 15.11±7.07 | 10.16±2.36 | 13.25±2.62 | 11.38±4.30 | 13.27±3.89 | 12.67±4.73 |
| Uric acid
(μmol/l) | 274.1±48.6 | 223.9±61.5 | 227.7±36.4 |
196.6±28.3b | 216.2±30.2 | 217.0±60.0 | 240.4±63.0 | 238.5±25.2 |
| LDH (U/l) | 1863±159 | 1914±227 | 1938±209 | 1594±226 | 1851±186 | 1928±303 | 1857±372 | 1742±269 |
| Urea (mmol/l) | 6.55±0.78 | 5.96±0.77 | 7.51±1.04 | 7.52±1.23 | 5.91±1.51 | 7.05±0.92 |
8.15±1.33c | 7.50±1.24 |
The lowest total cholesterol concentration was
found to be in the 1,24(OH)2D3-treated mice
(1.96±0.39 mmol/l), which was significantly lower than that of the
mice treated with the triple combination of SU, DTX, and
1,24(OH)2D3 (2.52±0.21 mmol/l) (p<0.05,
Kruskal-Wallis test). No significant changes were observed in the
case of the plasma glucose concentration and lactate dehydrogenase
(LDH) activity between the experimental groups (Table IX).
SU and 1,24(OH)2D3
downregulate VEGF-A expression in A549 tumors
The analysis of VEGF-A expression in A549 tumor
lysates using ELISA revealed that treatment with
1,24(OH)2D3 alone or in combination with SU,
as well as SU and DTX resulted in the downregulation of VEGF-A
expression. The mean VEGF-A level in these A549 tumor homogenates
was significantly lower than that of the DTX-treated mice and
control group mice [only SU + 1,24(OH)2D3]
(one-way ANOVA followed by Fisher's test). In addition, the mice
treated with SU alone and SU + DTX +
1,24(OH)2D3 had a lower mean VEGF-A level in
their tumors compared with the control group and DTX-treated mice,
although the difference was not statistically significant (Fig. 16A).
We performed ELISA to detect the levels of PDGF-BB
in the tumor homogenates. The lowest level of PDGF-BB was found to
be in tumors harvested from the mice treated with SU + DTX +
1,24(OH)2D3 (34.4±22.7 pg/mg total protein);
however, this was not statistically significant when compared to
the other experimental groups (one-way ANOVA followed by Fisher's
test) (Fig. 16B).
Western blot analysis of tumor
lysates
We performed western blot analysis to detect the
expression of VDR and enzymes involved in the metabolism of vitamin
D, such as 1α-hydroxylase CYP27B1 and 24-hydroxylase CYP24.
Densitometric analysis revealed no significant differences in VDR
levels in the A549 tumor homogenates between the experimental
groups (Fig. 17A). In the case of
proteins involved in the metabolism of vitamin D, we observed that
the levels of CYP27B1 were significantly upregulated in tumor
lysates obtained from the DTX +
1,24(OH)2D3-treated mice when compared to
those from mice treated with SU, 1,24(OH)2D3
and SU + DTX + 1,24(OH)2D3 (Fig. 17B). However, the expression of
CYP24 was downregulated in the tumors harvested from the mice
treated with SU + DTX + 1,24(OH)2D3, which
was statistically significant when compared to the mice treated
with DTX, SU + 1,24(OH)2D3, DTX +
1,24(OH)2D3 and SU + DTX (Fig. 17C) (p<0.05, one-way ANOVA
followed by Fisher's test).
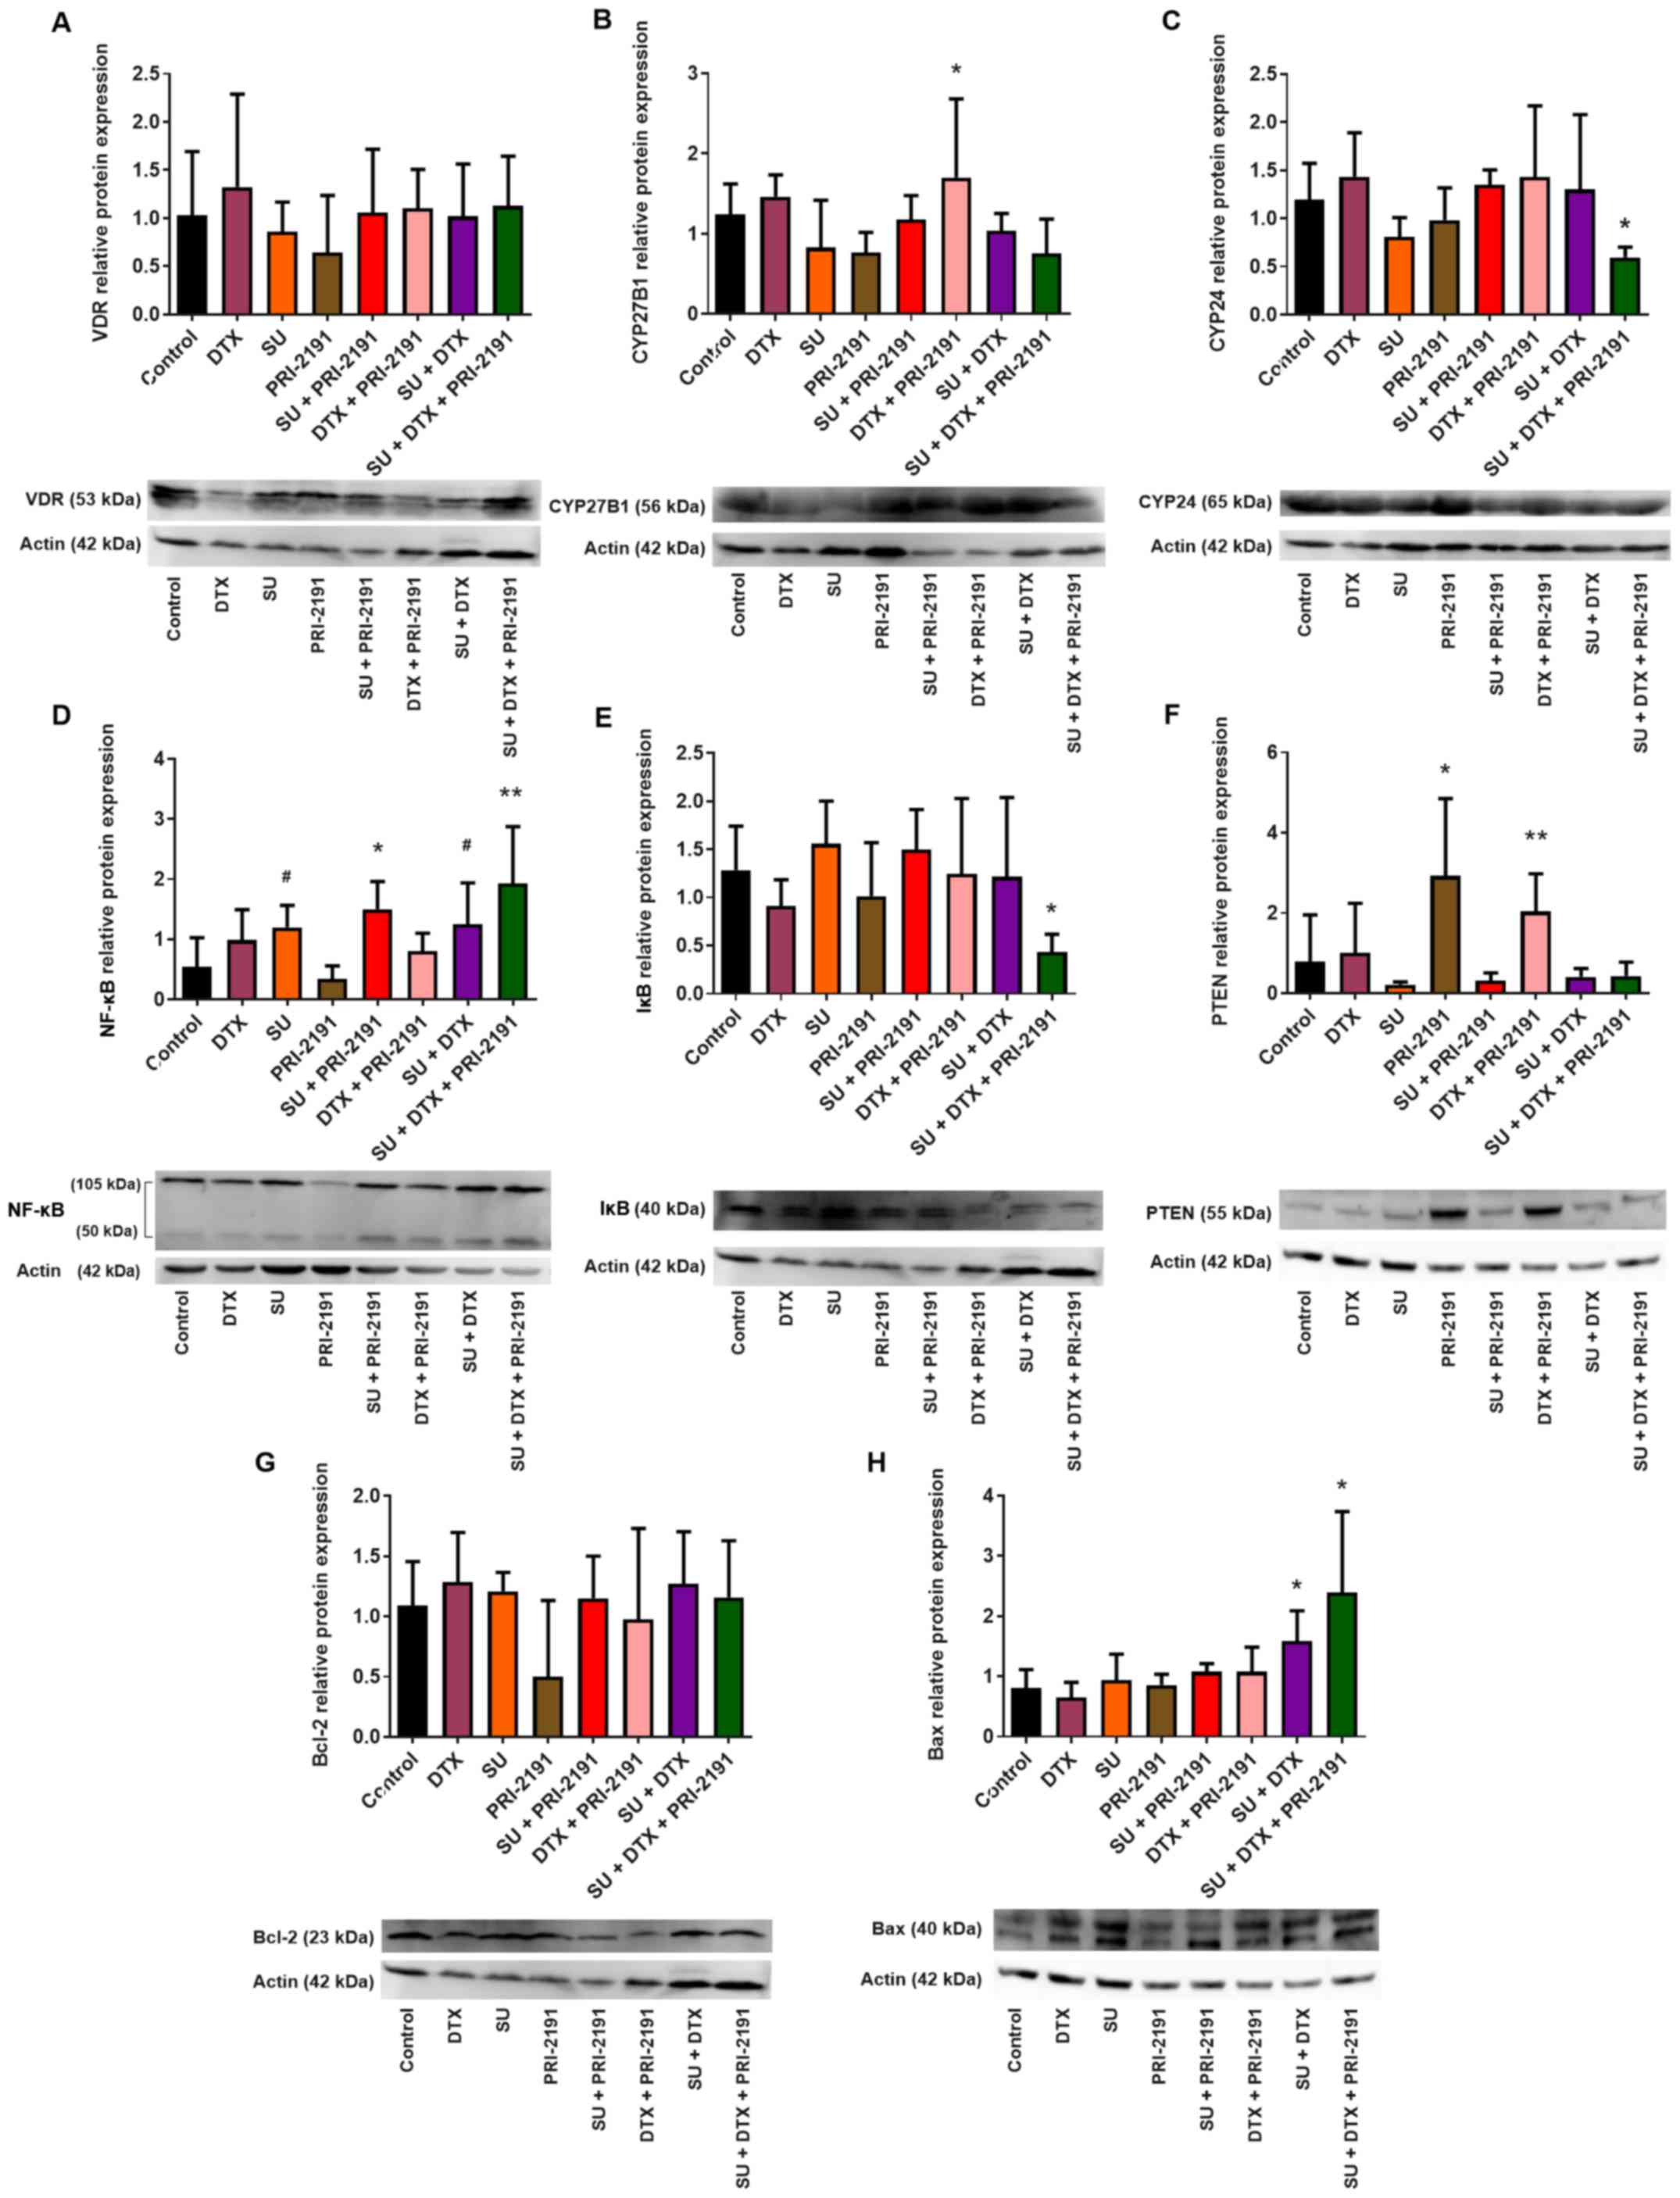 | Figure 17(A) Vitamin D receptor (VDR), (B)
1α-hydroxylase (CYP27B1), (C) 24-hydroxylase of vitamin D (CYP24),
(D) NF-κB, (E) IκB, (F) PTEN, (G) Bcl-2 and (H) Bax expression in
A549 tumor lysates harvested from mice treated with SU, DTX and
vitamin D analog PRI-2191 at the end of experiment (D51).
Densitometric analysis was performed in ImageJ 1.46v software;
blots were normalized to actin; means ± SD, n=3–4 lysates in each
group; (B) *p<0.05, compared to SU, PRI-2191, and SU
+ DTX + PRI-2191; (C) *p<0.05, compared to DTX, SU +
PRI-2191, DTX + PRI-2191 and SU + DTX; (D) #p<0.05,
compared to PRI-2191; *p<0.05, compared to control
and PRI-2191; **p<0.05, compared to control, DTX,
PRI-2191 and DTX + PRI-2191; (E) *p<0.05, compared to
control, SU, SU + PRI-2191 and DTX + PRI-2191; (F)
*p<0.05, compared to control, DTX, SU, SU + PRI-2191,
SU + DTX and SU + DTX + PRI-2191; **p<0.05, compared
to all groups receiving SU (alone or in combinations with DTX and
PRI-2191); (H) *p<0.05, compared to control, DTX, SU
and PRI-2191, DTX + PRI-2191 and SU + PRI-2191 (only for SU + DTX +
PRI-2191) (one-way ANOVA followed by Fisher's test). Beneath the
bar charts representative immunoblots are presented. SU, sunitinib;
DTX, docetaxel; PRI-2191, 1,24(OH)2D3. |
We also analyzed the expression of NF-κB and IκB in
A549 tumor lysates. Densitometric analysis revealed that NF-κB was
downregulated in the 1,24(OH)2D3-treated mice
when compared to the control group mice, although this difference
was not statistically significant. However, the upregulation of
NF-κB was observed in the SU-, SU + DTX [compared to
1,24(OH)2D3]- and SU + DTX +
1,24(OH)2D3-treated mice [compared to the
control, DTX, 1,24(OH)2D3 and DTX +
1,24(OH)2D3-treated mice] (p<0.05, one-way
ANOVA followed by Fisher's test) (Fig. 17D). In addition, treatment with SU
+ DTX + 1,24(OH)2D3 resulted in the
downregulation of IκB when compared with the control, SU-, SU +
1,24(OH)2D3-, and DTX +
1,24(OH)2D3-treated mice (p<0.05, one-way
ANOVA followed by Fisher's test) (Fig. 17E).
Treatment with 1,24(OH)2D3
alone or in combination with DTX resulted in the upregulation of
PTEN expression in the A549 tumor lysates. The administration of
1,24(OH)2D3 alone resulted in a significant
increase in PTEN expression compared to all the experimental groups
except for the DTX + 1,24(OH)2D3-treated
mice, whereas the administration of
1,24(OH)2D3 in combination with DTX caused a
significant upregulation in PTEN expression when compared to the 4
groups treated with SU (p<0.05, one-way ANOVA followed by
Fisher's test) (Fig. 17F).
Western blot analysis of Bcl-2 expression in the
A549 tumor lysates revealed no significant differences between the
experimental groups (Fig. 17G).
However, it was observed that treatment with SU + DTX with or
without 1,24(OH)2D3 upregulated Bax
expression (bands running at approximately 40 kDa probably
corresponding to a Bax dimer) compared to control, DTX, SU,
1,24(OH)2D3, and DTX +
1,24(OH)2D3-treated mice and when compared to
SU + 1,24(OH)2D3 for SU + DTX +
1,24(OH)2D3 (p<0.05, one-way ANOVA
followed by Fisher's test) (Fig.
17H).
Discussion
Studies regarding the use of vitamin D in the
prevention and treatment of malignant diseases began when it was
discovered that 1,25(OH)2D3 exhibits
anti-proliferative activity against cancer cells, and that patients
suffering from cancer often have a decreased level of serum
25-hydroxyvitamin D3 (an indicator of nutritional status
of vitamin D). In vitro studies have demonstrated that
1,25(OH)2D3 inhibits the proliferation of
different types of cancer cells, including lung cancer cells, and
in vivo studies have indicated that
1,25(OH)2D3 inhibits tumor growth and
metastasis. Vitamin D also potentiates the anticancer activity of
several known cytostatic drugs. These data indicate vitamin D may
be a promising agent for use in anticancer therapies (13,40).
In this in vitro study, we observed that the
addition of 1,24(OH)2D3 to the combination of
imatinib with cisplatin to the A549 cell culture resulted in the
transformation of an additive effect into synergism, while for
combinations with docetaxel, only additive or antagonistic effects
were observed. In a previous study using HL-60 promyelocytic
leukemia cells, 1,24(OH)2D3 was shown to
enhance the activity of imatinib alone and imatinib in combination
with cisplatin or docetaxel, and 1,24(OH)2D3
also transformed the additive effect of imatinib and cytostatic
interaction to synergism (41). In
the case of sunitinib in combination with cisplatin and vitamin D
compounds, synergistic interaction was observed, but with
docetaxel, similar to the case of imatinib, the interaction was
additive or antagonistic. Pan et al demonstrated that the
interaction of sunitinib with docetaxel on A549 cells depends on
the order in which the drugs are applied to the cells. They also
assessed that synergism can be achieved when docetaxel is applied
24 h prior to the addition of sunitinib (42).
The potentiation of the anticancer activity of
different drugs by vitamin D compounds has also studied in other
cancer models; for example, 1,25(OH)2D3 was
shown to increase the anti-metastatic activity of vaccine
consisting of murine beta-defensin-2 (mBD-2) and 3LL cell lysate in
a murine model of LLC. Vitamin D analogs also potentiated the
anticancer activity of cisplatin in an LLC model or 5-fluorouracil
(5-FU) in a murine and human colon cancer model (26,29,30,43).
However, the combination of vitamin D analogs with cisplatin in a
murine model of LLC was shown to result in toxicity that manifested
in body weight loss, leucopenia and hypercalcemia (26). Therefore, in this in vivo
study using a A549 lung cancer model, we decided to explore
docetaxel as a third agent in triple-combination therapy.
In lung cancer, the signaling pathways of VEGF and
PDGF are often dysregulated, which is associated with a worse
prognosis. In a preclinical study, it was demonstrated that the
simultaneous inhibition of receptors for both VEGF and PDGF by
sunitinib was beneficial in anticancer treatment (44). In this study, we demonstrated that
sunitinib significantly inhibited A549 tumor growth, and the effect
of sunitinib was potentiated by 1,24(OH)2D3,
which is concurrent to the results of our previous study on
imatinib using a A549 lung cancer model (31). Chemotherapy with sunitinib, similar
to other drugs aimed at multiple targets, is often accompanied by
certain adverse effects (19). In
turn, combining sunitinib at low doses with other chemotherapeutic
agents can prevent undesirable side-effects and can simultaneously
achieve synergism in the drug-drug interaction (24). In this study, to the best of our
knowledge, we demonstrate for the first time the use of a triple
treatment scheme in a NSCLC A549 model, in which sunitinib,
docetaxel and 1,24(OH)2D3 were employed
together. Cytotoxic drugs, such as docetaxel, that have been used
typically in anticancer therapy at the maximum tolerated dose
(MTD), are also toxic to normal healthy cells. However, when the
drug is administered more frequently and at lower doses, the
so-called metronomic doses, it causes an 'anti-angiogenic side
effect'. Moreover, such a therapy scheme appears to be more
effective than the MTD schedule (45–47).
Therefore, in this study, we decided to use docetaxel at 3-fold
lower doses in our experiments. In addition, the type of
interaction between sunitinib and docetaxel depends on the sequence
in which agents are added to culture cells, and that synergism can
be observed when docetaxel is applied 24 h prior to sunitinib
(42). Therefore, in this study,
we administered docetaxel first, followed by sunitinib and then
1,24(OH)2D3. Triple combination therapy,
consisting of sunitinib, docetaxel and
1,24(OH)2D3 revealed a more potent A549 tumor
growth inhibitory effect than that of single- or double-drug
scheme.
In order to achieve the therapeutic effect of
sunitinib or other small molecule kinase inhibitors,
chemotherapeutic agents must be administered daily for an extended
period of time as terminating TKI administration may result in a
rapid relapse. However, the continuous usage of TKIs may result in
adverse effects, such as fatigue, body weight loss, neutropenia,
hepatotoxicity, neurotoxicity, cardiotoxicity and others (48,49).
The toxicity of the triple combination of sunitinib, docetaxel and
1,24(OH)2D3, as assessed by body weight loss,
was not found to be higher than that of sunitinib in combination
with 1,24(OH)2D3 or with docetaxel. In
addition, the toxicity of the triple combination did not differ
from the toxicity of sunitinib used alone, particularly at the
beginning of the experiment. The application of triple-compound
therapy did not influence the serum calcium level in comparison to
1,24(OH)2D3 used alone, as well as no
significant changes in main biochemical or morphological parameters
of blood, which also suggests that some toxicity of tested
treatment scheme was observed. The toxicity of
1,24(OH)2D3 in comparison to that of
1,25(OH)2D3 in terms of calcium deposits was
analyzed previously (50).
Histological analysis then revealed that the injection of
1,24(OH)2D3 or
1,25(OH)2D3 at a dose of 10 μg/kg/day
s.c. resulted in moderate calcification of the kidneys and heart
(50), while in the present study,
1,24(OH)2D3 was administered at a lower dose
of 1 μg/kg/day.
1,25(OH)2D3 and vitamin D
derivatives may induce apoptosis through interaction with
pro-apoptotic and anti-apoptotic pathways; for example,
1,25(OH)2D3 has been shown to increase the
level of the pro-apoptotic protein, Bak, which belongs to the Bcl-2
family, or to decrease the activity of anti-apoptotic β-catenin
(51,52). In this study, no changes in the
Bcl-2 protein level in A549 tumor lysates between the treatment
groups were observed, although a significant increase in Bax
expression was observed in tumor lysates harvested from mice
treated with sunitinib in combination with docetaxel or with
docetaxel and 1,24(OH)2D3. Sunitinib has been
shown to induce the expression of pro-apoptotic proteins (Bax, Bak
and PUMA) and to inhibit the expression of anti-apoptotic proteins
(Bcl-2) in HL-60 and KG-1 leukemia cells (53). Nishikawa et al demonstrated
that PC3 prostate cancer cells, with a decreased expression of
Akt1, were more sensitive to sunitinib and expressed higher levels
of Bax (54). Uzu et al
demonstrated that sunitinib activated Bax in H28-T mesothelioma
cells transfected with the C×43 conexin gene (transmembrane protein
involved in rapid intercellular communication), which resulted in
the induction of apoptosis in those cells (55). Therefore, the influence of
sunitinib on the expression of proteins engaged in apoptosis
differs depending on the cell type and other additional
factors.
Differential mechanisms involved in the
effects of vitamin D analogs in combination with TKIs and
cytostatic drugs on cell death
According to the results of this study, a more
potent anti-proliferative activity of TKIs combined with
cytostatics against A549 cells correlated mostly with an increased
percentage of cells in the G2/M phase of the cell cycle
and with an increased percentage of cells in the sub-G1
phase. Cells arrested at a specific phase of the cell cycle could
then be directed towards cell death. Apoptosis, one of the most
frequently studied types of cell death, is regulated by many
factors and can proceed primarily through intrinsic or extrinsic
pathways. The common elements of these pathways are initiator
caspases (caspase-2, caspase-8, caspase-9, or caspase-10) and
executioner caspases (caspase-3, caspase-6, and caspase-7).
Caspase-3 is the most important executioner caspase, activated by
any of the initiator caspases (56,57).
In this study, incubation of the A549 lung cancer cells with
imatinib and docetaxel alone or in combination resulted in an
increase in caspase-3 activity. The tested vitamin D compounds
decreased the activity of the protease that was induced by imatinib
or imatinib in combination with cisplatin or docetaxel. Koren et
al demonstrated that 1,25(OH)2D3
decreased caspase-3 activity in HT-29 colon cancer cells treated
with H2O2, whereas it increased
caspase-independent cytotoxicity (58). In turn,
1,25(OH)2D3 has been shown to protect
keratinocytes against osmotic shock-, oxidative stress-, or
TNFα-induced apoptosis (59). In
this study, despite the decreased activity of caspase-3 in A549
cells by vitamin D compounds used in combination with imatinib, we
did not find a decrease in the percentage of dead cells (as
assessed by the analysis of the sub-G1 population). This
indicates that vitamin D did not reduce the cytotoxicity of
imatinib; therefore, following incubation with imatinib in
combination with 1,24(OH)2D3 or
1,25(OH)2D3 there was caspase-independent
cell death, which was not due to apoptosis.
In this study, sunitinib and cisplatin did not
influence caspase-3 activity. Furthermore, we found that caspase-3
activity was lower when sunitinib was combined with docetaxel than
when the cells were exposed to docetaxel alone. In this case, cell
death was found to be caspase-independent. Lavallard et al
demonstrated that imatinib induced the apoptosis of
Bcr-Abl-positive leukemia cells by increasing caspase-3 activity.
They also demonstrated that despite the inhibition of caspase with
specific caspase inhibitor using imatinib, there was excessive cell
death, which suggests that it was caspase-independent cell death
(60). Costa et al
demonstrated using neuroblastoma cells that the silencing of miR-21
expression sensitized the cells to the cytotoxicity of sunitinib.
After the expression of miR-21 was silenced, treatment with
sunitinib resulted in an increase in caspase-3 activity compared to
the cells treated with sunitinib without miR-21 silencing. In
addition, as a result of miR-21 silencing, the upregulation of p21
expression, and therefore p53 activation were observed (61). Moreover, miR-21 is often
overexpressed in cancer, including NSCLC, for example, in the A549
cell line (62,63). Therefore, the inability of
sunitinib to induce caspase-3 activity in A549 cells may result
from the overexpression of miR-21. In addition, when sunitinib was
used in combination with cisplatin, an increase in caspase-3
activity was observed. Treatment of the A549 cells with cisplatin
has been shown to result in the downregulation of miR-21 expression
(64). In this regard, an increase
in caspase-3 activity after combined use with sunitinib with
cisplatin may be associated with a decreased level of miR-21.
Following inappropriate mitosis of the cell
(incorrect chromosomal segregation, invalid centrosome duplication)
in response to DNA damage, mitotic cell death or the so-called
mitotic catastrophe can occur. The examples of mitotic catastrophe
inducers are agents that cause hyperpolarization, for example,
taxanes (docetaxel), or the depolarization of microtubules, for
example, vinca alkaloids (vincristine) and colchicine. Cells that
are formed are larger in size than normally dividing cells and are
multinucleated (56,65). In this study, the death of the A549
lung cancer cells treated with docetaxel alone or with docetaxel in
different combinations with TKIs and vitamin D compounds was a
result of mitotic catastrophe. DAPI staining of the A549 cells
revealed the appearance of multi-nucleated cells. Opinions differ
about the prerequisite of caspases for the occurrence of mitotic
catastrophe. In cells proceeding through mitotic catastrophe, the
final stage of death may occur through apoptosis or necrosis
(65). Therefore, cells treated
with docetaxel in combination with sunitinib, in which we did not
observe caspase-3 activity, may die through necrosis.
Factors determining the sensitivity of
A549 lung cancer cells to vitamin D analogs
A549 lung cancer cells were resistant to the test
vitamin D compounds in vitro: incubation of the A549 lung
cancer cells with 1,24(OH)2D3 or
1,25(OH)2D3 for 72 h did not result in the
inhibition of proliferation. 1,25(OH)2D3
reveals its activity through VDR; therefore, the expression of VDR
was analyzed in different types of normal and cancer cells to
determine whether they are sensitive to the anti-proliferative
activity of 1,25(OH)2D3. It was shown that a
lower level of VDR correlated with cancer progression, whereas a
higher level of VDR and a higher serum 25-hydroxyvitamin
D3 concentration positively correlated with the survival
of patients suffering from lung adenocarcinoma (66). In this study, the A549 lung cancer
cells expressed VDR; however, the level of its expression was not
significantly altered even after treatment with different
combinations of the test compounds, apart from treatment with
docetaxel which resulted in the downregulation of VDR. Even if VDR
is expressed in some cells, the activity of the receptor depends on
its appropriate structure, which in turn, is determined by the gene
sequence. Few polymorphisms of VDR are known, and some of
these can correlate with a greater response for
1,25(OH)2D3; for example, osteoblasts
stimulated with 1,25(OH)2D3 have been shown
to secrete different amounts of osteocalcin depending on the
inherited VDR allele (67,68).
The correlation between VDR polymorphism and the risk of
lung cancer has also been the subject of many studies (69–72);
however, to date, the literature in this field indicates that the
TaqI allele may be the risk factor in lung cancer
development, whereas in other studies, it was assumed that this
allele may be a protective factor. These conflicting data may be
due the different numbers of studied populations, the criteria of
analysis, different genetic backgrounds, and others (69,70).
There are also alternative to the VDR nuclear receptors, that have
been shown to bind derivatives of vitamin D, such as the retinoid
acid-related orphan receptors (RORs) α and γ. RORs have been shown
to regulate a number of physiological processes, such as embryonic
development, differentiation, immune response and metabolism
(73–75). The expression levels of RORs are
downregulated and/or hypoactivated in breast cancer or melanoma
compared to normal tissue and RORs have also been identified as
tumor suppressors (74,76). Vitamin D derivatives have been
shown to act as antagonists or inverse agonists of RORs, but
1,25(OH)2D3 to some degree only. There are
other potent ligands of RORs, that are novel non-calcemic vitamin D
derivatives produced by CYP11A1 hydroxylase, such as 20(OH)D3 and
20,23(OH)2D3, which in turn act as partial
agonists of VDR (77–80). However, to date, at least to the
best of our knowledge, there are no available studies regarding the
role of RORs in the anticancer activity of vitamin D derivatives in
lung cancer.
The lack of the response of A549 cells to the
anti-proliferative activity of 1,24(OH)2D3
and 1,25(OH)2D3 may be due to the
inactivation of vitamin D compounds by 24-hydroxylase CYP24. Zhang
et al demonstrated the correlation between mutation present
in lung cancer cells (KRAS and EGFR) and the level of
VDR and CYP24 expression. Cells with KRAS mutation (e.g.,
A549) expressed low levels of VDR and high levels of CYP24, whereas
cells with EGFR mutation (e.g., HCC827) expressed high
levels of VDR and low levels of CYP24. Therefore, the authors of
that study concluded that patients with lung cancer with
EGFR mutations can be treated with vitamin D (81). In this study, western blot analysis
revealed that A549 cells following incubation with
1,24(OH)2D3 or
1,25(OH)2D3 expressed higher levels of CYP24,
whereas the highest level of CYP24 expression was observed in cells
treated with imatinib in combination with vitamin D compounds
and/or with cisplatin or docetaxel. CYP24 is sometimes
recognized as an oncogene as it is often overexpressed in tumors
and a high level of CYP24 enzyme inactivates
1,25(OH)2D3, which in turn limits its
availability, and as a result its anti-proliferative,
pro-differentiation and pro-apoptotic activity. Therefore, the use
of other compounds, which can inhibit CYP24 activity, together with
1,25(OH)2D3 has also been investigated
(82–84). For example CTA091, an inhibitor of
CYP24, has been shown to enhance the anti-proliferative activity of
1,25(OH)2D3 against H292, A549, and HCC827
lung cancer cells (85). In the
present study, we demonstrated that the use of vitamin D compounds
with sunitinib and/or with docetaxel did not increase the
expression of CYP24 in vitro. Furthermore, in in vivo
A549 mouse model, it was observed that the level of CYP24
expression in tumors harvested from mice treated with sunitinib in
combination with 1,24(OH)2D3 and docetaxel
was the lowest compared to other groups, which could be the reason
for the best antitumor effect achieved.
Anti-angiogenic mechanisms of action of
vitamin D analogs in combination with TKIs and cytostatic
drugs
The improved activity of sunitinib in combination
with 1,24(OH)2D3 in the A549 lung cancer
model may have resulted due to the influence of vitamin D analog on
endothelial cells. A previous study using tumor-derived endothelial
cells (TDECs) demonstrated that 1,25(OH)2D3
arrested cells in the G0/G1 phase of the cell
cycle and induced apoptosis. Following treatment with
1,25(OH)2D3, the expression of VDR in these
cells increased, and the VDR signaling pathway was activated
(86). In in vivo studies,
VDR knockout (KO) mice have been shown to have tumors with
differing vessel structure from VDR wild-type mice. The vessels of
KO-VDR mice were enlarged, surrounded with less pericytes, and
tumors harvested from KO-VDR mice contained higher levels of
pro-angiogenic factors, such as HIF-1α, VEGF, angiopoietin 1 (Ang1)
and PDGF-BB (17). In this study
1,25(OH)2D3 and
1,24(OH)2D3 inhibited the proliferation of
HLMECs and arrested the cells in the G0/G1
phase of the cell cycle. The tested vitamin D compounds enhanced
the cytotoxic activity of imatinib, sunitinib, cisplatin and
docetaxel, shifting the interaction of the test agents towards
synergism.
1,24(OH)2D3 and
1,25(OH)2D3 also improved the induction of
caspase-3 activity by cisplatin or docetaxel in HLMECs. TKIs
(sunitinib or imatinib) used alone did not activate caspase-3 and
did not improve the activity of the tested cytostatics in the
induction of the protease, but when vitamin D compounds were added
to the combination of a given TKI with cytostatic drugs, the
observed caspase-3 activity was higher than that of cytostatic
compounds (cisplatin or docetaxel) used in combination only with
vitamin D compounds. The increased activity of caspase-3 following
incubation of the HLMECs with sunitinib, cytostatic and
1,24(OH)2D3, or
1,25(OH)2D3 correlated with an increased
percentage of cells in the sub-G1 phase, suggesting that
the cell death was a result of apoptosis. The role of VEGF in
endothelial cells is to protect them from apoptosis (87). Therefore, in this study,
suppressing VEGFR activity by sunitinib additionally increased the
response of HLMECs to the cytotoxic effects of cisplatin or
docetaxel in combination with vitamin D compounds.
Role of p53 protein in the regulation of
tumor angiogenesis
Cancer cells, including lung cancer cells, produce
a number of growth factors engaged in tumor angiogenesis, for
example, VEGF (88). Uncontrolled
angiogenesis is in turn associated with cancer progression. One of
the mechanisms involved in the regulation of angiogenesis is p53,
for example, through the regulation of growth factor expression;
the downregulation of pro-angiogenic factors, for example, VEGF;
and the upregulation of anti-angiogenic factor expression. Tumors
with mutant p53 are more vascularized than those of wild-type p53
(25). Kieser et al
demonstratd that murine fibroblasts NIH3T3, expressing mutant p53
constantly, produced high level of VEGF (89), whereas Mukhophadhyay et al
demonstrated that wild-type p53 decreases the activity of
VEGF promoter (90).
Studies have also shown that there is a correlation between mutant
p53 and the level of VEGF in NSCLC (91–93).
A number of studies have aimed at inducing p53 pathway to activate
the processes regulated by p53 protein (cell cycle arrest,
apoptosis, DNA damage repair, autophagy, gene transcription
regulation etc.) (94). In this
study, we assessed the effects of TKIs, cytostatics and vitamin D
compounds and their combinations on VEGF-A production by A549 cells
in vitro and correlated with the changes in p53 expression.
The results demonstrated that sunitinib and cisplatin downregulated
VEGF-A protein expression, and the combination of both even
multiplied the effect. At the mRNA level, treatment with sunitinib
upregulated VEGFA mRNA expression compared to untreated
cells. In addition, the decrease in the protein level may not have
been undergone at the transcription level but may be by the
processes of protein translation, post-translational modification,
or excessive protein degradation. There was also no correlation
between the downregulation of VEGF-A and p53 expression as after
treatment of A549 cells with sunitinib, we did not observe p53
expression. Calero et al demonstrated that sunitinib
downregulated the secretion of VEGF by SK-N-BE(2) neuroblastoma cells. The authors stated
that the decrease in VEGF expression correlated with PI3K/Akt
signaling pathway inhibition by sunitinib followed by increased MYC
protein degradation (24). MYC has
also been shown to regulate the expression of VEGF and other
angiogenic factors. However, according to cell type the regulation
may differ at the level of transcription or post-translational
modifications and also may be determined by different physiological
and pathological factors (95). In
this study, we observed that after sunitinib treatment, the level
of MYC mRNA in A549 cells increased (the expression of MYC at the
protein level was not analyzed yet). Mahalingam et al did
not observe any changes in c-MYC protein level in Caki-1 or 786-O
kidney cancer cells following treatment with sunitinib. However,
after c-MYC expression was silenced by siRNA or PIM-1 kinase
inhibitor (the function of PIM-1 is to stabilize c-MYC protein
through phosphorylation), the cells became more sensitive to
sunitinib (96). In this study, we
observed the downregulation of MYC mRNA expression following
treatment of the A549 cells with cisplatin. In the study by Xie
et al, treatment with cisplatin resulted in a decrease in
MYC protein expression in the A549 cells compared to the control
cells (97). Therefore, the use of
cisplatin in combination with sunitinib may sensitize A549 lung
cancer cells to sunitinib.
The function of p53 protein is regulated at the
level of transcription, translation, stabilization and
post-translational modifications. The other important issue for p53
activity is its localization inside the cell, that is, when a
stress factor affects the cell, p53 protein should be transferred
to the nucleus to induce the transcription of given target genes.
However, in some types of cancer with wild-type p53, its activity
is inhibited by arresting it in the cytoplasm or excessive export
from the nucleus, and thus, it renders cancer cells resistant to
radio- or chemotherapy (98). In
this study, as shown in Fig. 11,
following incubation of the A549 lung cancer cells with cisplatin
or docetaxel alone or with the tested TKIs and/or vitamin D
compounds, p53 protein was localized in the nucleus, where it plays
the role of transcription factor (p21 expression level increased as
assessed by western blot analysis).
The activity of p53 protein is regulated by MDM2
protein (the human protein is often termed HDM2), which inhibits
the transcriptional activity of p53 through binding with N-terminal
domain, or induces p53 export from nucleus, or due to E3 ubiquitin
ligase activity, HDM2 directs p53 to proteasomal degradation.
Moreover, HDM2 and p53 are linked through an autoregulatory
negative feedback loop. One of the concepts in recovering p53
activity is the inhibition of the p53-HDM2 interaction (99,100). In a kidney cancer model,
sunitinib revealed only transient anticancer activity and
temporarily increased the expression of p53 and p21waf1,
and additionally, increased the expression of HDM2, while tumors
developed resistance to sunitinib. Only after using MI-319, a HDM2
antagonist, a better effectiveness of sunitinib was observed
(101). In this study, in A549
lung cancer cells incubated with sunitinib, the expressoin of
TP53 mRNA increased; however, we did not observe an
increased level of p53 protein. Probably, despite of the induction
of TP53 expression, newly formed protein can be rapidly
ubiquitinated by HDM2 and degraded. Only when sunitinib was applied
together with cisplatin or docetaxel, we observed an increase in
the p53 protein level: the cytostatics activated DNA damage
response mechanisms that in turn induced the upregulation of p53
protein expression; p53 was then translocated to the nucleus and
induced p21 protein expression. Gan et al demonstrated that
docetaxel stabilized p53 protein in LNCaP prostate cancer cells.
Treatment of LNCaP cells with docetaxel resulted in the
upregulation of p53 and p21 and the downregulation of HDM2. The
increase in p53 level did not result from elevated TP53
transcription as there was no increase in mRNA observed. When the
authors measured the half-life of p53, they demonstrated that as a
result of docetaxel treatment the half-life increased from 2 h to
more than 8 h (102). In this
study, treatment of the A549 cells with docetaxel also did not
increase TP53 mRNA, whereas the level of p53 protein
increased significantly. In A549 cells, docetaxel may stabilize p53
protein by affecting HDM2 activity.
The analysis of the VEGF-A level in A549 tumor
lysates harvested from mice treated with different combinations of
sunitinib, docetaxel and 1,24(OH)2D3
indicated that sunitinib and 1,24(OH)2D3 used
alone or in combination decreased the VEGF-A level in A549 tumors,
whereas in tumors harvested from mice treated with sunitinib in
combination with docetaxel, the expression was found to be slightly
low compared to that of the control mice. We also analyzed the
expression of the tumor suppressor PTEN, and we observed its
increase in tumor lysates from mice treated with
1,24(OH)2D3 or
1,24(OH)2D3 in combination with docetaxel.
1,25(OH)2D3 and
19-nor-1,25(OH)2D2 (paricalcitol) have been
shown to induce PTEN expression in leukemia cell lines (103). PTEN through the PI3K/Akt pathway
influences the process of angiogenesis. Ma et al
demonstrated that silencing PTEN in pancreatic cancer cells
resulted in the upregulation of VEGF (104). Therefore, a low level of VEGF-A
in tumors harvested from mice treated with
1,24(OH)2D3 may result from the upregulation
of PTEN expression.
Mechanisms of acquired resistance to
anticancer therapy
One of the important obstacles in anticancer
therapy is the acquired resistance of the tumor to the applied
treatment. In case of anti-VEGF therapy, the resistance involves
the activation of alternative signaling pathways engaged in
angiogenesis that are independent of the VEGF pathway. Therefore,
combining drugs with different mechanisms of action and aiming at
multiple signaling pathways may provide a more effective control of
tumor angiogenesis (25,105,106). For example, the use of sunitinib
in the treatment of kidney cancer leads to acquired resistance
after a few months since the therapy is introduced. The suggested
mechanisms of resistance to sunitinib are as follows: the
activation of angiogenic signaling pathways, resistance of cells of
tumor microenvironment, increased invasiveness of cancer cells and
acquisition the ability to metastasis, activation of alternative
signaling pathways, incomplete inhibition of drug targets, or the
changes in expression of some microRNAs (107). Huang et al explored serum
harvested from mice xenografted with kidney cancer sensitive or
resistant to sunitinib and ascertained significantly elevated IL-8
level in serum from mice with sunitinib resistant kidney cancer.
After the application of IL-8 neutralizing antibody, they observed
sensitization of the tumor to sunitinib (108). IL-8 expression is regulated,
among other things, by NF-κB (109,110). In this study using a A549 lung
cancer model, we observed an upregulation in NF-κB expression in
tumors harvested from mice treated with sunitinib, with the highest
level of NF-κB and simultaneously the lowest level of IκB in those
receiving triple combination of sunitinib, docetaxel and
1,24(OH)2D3. Thus, an elevated NF-κB level
may be associated with the activation of alternative signaling
pathways after treatment with sunitinib. NF-κB is an important
mediator of lung carcinogenesis. Efforts are being made to inhibit
the activity of NF-κB or for application in cancer chemoprevention
that can also affect the NF-κB pathway. However, there are some
doubts regarding the validity of this concept due to undesired
side-effects resulting from the violation of immune system
function. In addition, it turned out that NF-κB may reveal distinct
activity depending on the cell or tissue type (111). For example, the increased
survival of neuronal cells has been shown to correlate with the
upregulation of NF-κB expression following treatment with sunitinib
(112). Other studies disclosed
the double role of NF-κB in the regulation of apoptosis. Depending
on the cell type and external stimulus influencing on the cell,
NF-κB may induce or inhibit apoptosis (113). Aoki et al showed that
increased activity of NF-κB may be connected with hypoxia-induced
endothelial cells apoptosis. In these cells authors observed
increase in the ratio of Bax to Bcl-2 and higher level of p53
(114). NF-κB may play a role in
the regulation of p53 expression in response to different stress
factors, as it was discovered that the NF-κB binding region in
TP53 promoter overlaps genotoxic stress response region
(115). NF-κB stimulates the
expression of genes inducing apoptosis for example, Fas and
Fas-ligand. In response to UV-C or daunorubicine, NF-κB
downregulates the expression of anti-apoptotic Bcl-xL, and thus
under some circumstances the activation of NF-κB sensitizes cells
to programmed cell death (116).
Therefore, in this study, the increased NF-κB expression level in
A549 tumors obtained from mice treated with the triple combination
of sunitinib, docetaxel and 1,24(OH)2D3 may
have contributed to the induction of apoptosis in tumors,
particularly since the simultaneously increased expression of
pro-apoptotic Bax was observed.
In this study, 1,24(OH)2D3
used alone slightly decreased NF-κB level in A549 tumors compared
to the controls, but it did not lower the level of NF-κB that was
upregulated by sunitinib. 1,25(OH)2D3 has
been found to modulate the immune response, for example, through
the influence on activity of NF-κB in lymphocytes, fibroblasts and
monocytes. 1,25(OH)2D3 induces the expression
of IκBα in macrophages and peripheral blood mononuclear cells and
also inhibits the expression of pro-inflammatory cytokines, for
example IL-8 in prostate cancer cells through interaction with
NF-κB signaling. The inhibition of NF-κB activity by
1,25(OH)2D3 may be achieved through the
blocking of p65 subunit translocation to nucleus, and in this
manner, the binding with target DNA sequences, for example,
IL-8 promoter, is inhibited. Another possible mechanism of
NF-κB inhibition by 1,25(OH)2D3 is the
induction of the expression of proteins that interfere with NF-κB,
for example, insulin-like growth factor binding protein IGFBP-3
(117). The analysis of the IL-8
level in A549 tumors may clarify if the level of the IL-8 was
downregulated or not despite the upregulation of NF-κB.
In conclusion, the results of this study provide
new knowledge of the combination of drugs with different mechanisms
of action in an A549 lung cancer model in vitro and in
vivo. The tested TKIs exhibited differential mechanisms of
induction of cell death: imatinib induced caspase-dependent,
whereas sunitinib induced caspase-independent cell death.
1,24(OH)2D3 and
1,25(OH)2D3 augmented caspase activity only
in HLMECs. Sunitinib and cisplatin decreased the secretion of
VEGF-A from A549 cells via a p53-independent and p53-dependent
pathway, respectively. Moreover, to the best of our knowledge, we
demonstrated for the first time the use and the efficacy of the
triple combination of sunitinib, docetaxel and
1,24(OH)2D3 in an A549 lung cancer model,
which showed that 1,24(OH)2D3 enhanced the
anticancer activity of TKI sunitinib and sunitinib in combination
with docetaxel in a NSCLC A549 model in vivo. The observed
anticancer activity may be the result of the influence of tested
agents on the process of tumor angiogenesis, for example, through
the downregulation of VEGF-A expression in tumor or through direct
influence on the proliferation of endothelial cells, and also on
the induction of cell death inside the tumor. The use of sunitinib
and docetaxel in combination with 1,24(OH)2D3
downregulates CYP24 expression, which may result in the decreased
inactivation of vitamin D analog inside the tumor and its greater
availability as a consequence.
Acknowledgments
This study was supported by a grant from the Polish
National Science Center (NCN)-No. 2013/09/N/NZ4/01720. Publication
supported by Wroclaw Center of Biotechnology within a Program 'The
Leading National Research Center (KNOW)' for 2014–2018.
References
|
1
|
Adler I: Primary Malignant Growths of the
Lungs and Bronchi; A Pathological and Clinical Study. Longmans;
Green, New York, NY: 1912
|
|
2
|
Debakey M: Carcinoma of the lung and
tobacco smoking: A historical perspective. Ochsner J. 1:106–108.
1999.PubMed/NCBI
|
|
3
|
Proctor RN: The history of the discovery
of the cigarette-lung cancer link: Evidentiary traditions,
corporate denial, global toll. Tob Control. 21:87–91. 2012.
View Article : Google Scholar : PubMed/NCBI
|
|
4
|
Dubey AK, Gupta U and Jain S: Epidemiology
of lung cancer and approaches for its prediction: A systematic
review and analysis. Chin J Cancer. 35:712016. View Article : Google Scholar : PubMed/NCBI
|
|
5
|
Siegel RL, Miller KD and Jemal A: Cancer
statistics, 2016. CA Cancer J Clin. 66:7–30. 2016. View Article : Google Scholar : PubMed/NCBI
|
|
6
|
Gadgeel SM, Ramalingam SS and Kalemkerian
GP: Treatment of lung cancer. Radiol Clin North Am. 50:961–974.
2012. View Article : Google Scholar : PubMed/NCBI
|
|
7
|
Feldman D, Krishnan AV, Swami S,
Giovannucci E and Feldman BJ: The role of vitamin D in reducing
cancer risk and progression. Nat Rev Cancer. 14:342–357. 2014.
View Article : Google Scholar : PubMed/NCBI
|
|
8
|
Slominski AT, Brożyna AA, Zmijewski MA,
Jóźwicki W, Jetten AM, Mason RS, Tuckey RC and Elmets CA: Vitamin D
signaling and melanoma: Role of vitamin D and its receptors in
melanoma progression and management. Lab Invest. 97:706–724. 2017.
View Article : Google Scholar : PubMed/NCBI
|
|
9
|
Higashimoto Y, Ohata M, Nishio K, Iwamoto
Y, Fujimoto H, Uetani K, Suruda T, Nakamura Y, Funasako M and Saijo
N: 1 alpha, 25-dihydroxyvitamin D3 and all-trans-retinoic acid
inhibit the growth of a lung cancer cell line. Anticancer Res.
16(5A): 2653–2659. 1996.PubMed/NCBI
|
|
10
|
Güzey M, Sattler C and DeLuca HF:
Combinational effects of vitamin D3 and retinoic acid (all trans
and 9 cis) on proliferation, differentiation, and programmed cell
death in two small cell lung carcinoma cell lines. Biochem Biophys
Res Commun. 249:735–744. 1998. View Article : Google Scholar : PubMed/NCBI
|
|
11
|
Young MRI, Ihm J, Lozano Y, Wright MA and
Prechel MM: Treating tumor-bearing mice with vitamin D3 diminishes
tumor-induced myelopoiesis and associated immunosuppression, and
reduces tumor metastasis and recurrence. Cancer Immunol Immunother.
41:37–45. 1995.PubMed/NCBI
|
|
12
|
Young MRI, Lozano Y, Ihm J, Wright MA and
Prechel MM: Vitamin D3 treatment of tumor bearers can stimulate
immune competence and reduce tumor growth when treatment coincides
with a heightened presence of natural suppressor cells. Cancer
Lett. 104:153–161. 1996. View Article : Google Scholar : PubMed/NCBI
|
|
13
|
Norton R and O'Connell MA: Vitamin D:
Potential in the prevention and treatment of lung cancer.
Anticancer Res. 32:211–221. 2012.PubMed/NCBI
|
|
14
|
Mernitz H, Smith DE, Wood RJ, Russell RM
and Wang XD: Inhibition of lung carcinogenesis by
1alpha,25-dihydroxyvitamin D3 and 9-cis retinoic acid in the A/J
mouse model: Evidence of retinoid mitigation of vitamin D toxicity.
Int J Cancer. 120:1402–1409. 2007. View Article : Google Scholar : PubMed/NCBI
|
|
15
|
Yudoh K, Matsuno H and Kimura T:
1alpha,25-dihydroxyvitamin D3 inhibits in vitro invasiveness
through the extracellular matrix and in vivo pulmonary metastasis
of B16 mouse melanoma. J Lab Clin Med. 133:120–128. 1999.
View Article : Google Scholar : PubMed/NCBI
|
|
16
|
Ben-Shoshan M, Amir S, Dang DT, Dang LH,
Weisman Y and Mabjeesh NJ: 1alpha,25-dihydroxyvitamin D3
(Calcitriol) inhibits hypoxia-inducible factor-1/vascular
endothelial growth factor pathway in human cancer cells. Mol Cancer
Ther. 6:1433–1439. 2007. View Article : Google Scholar : PubMed/NCBI
|
|
17
|
Chung I, Han G, Seshadri M, Gillard BM, Yu
WD, Foster BA, Trump DL and Johnson CS: Role of vitamin D receptor
in the anti-proliferative effects of calcitriol in tumor-derived
endothelial cells and tumor angiogenesis in vivo. Cancer Res.
69:967–975. 2009. View Article : Google Scholar : PubMed/NCBI
|
|
18
|
Bao BY, Yao J and Lee YF: 1alpha,
25-dihydroxyvitamin D3 suppresses interleukin-8-mediated prostate
cancer cell angiogenesis. Carcinogenesis. 27:1883–1893. 2006.
View Article : Google Scholar : PubMed/NCBI
|
|
19
|
Crino L and Metro G: Therapeutic options
targeting angiogenesis in nonsmall cell lung cancer. Eur Respir
Rev. 23:79–91. 2014. View Article : Google Scholar : PubMed/NCBI
|
|
20
|
McMahon G: VEGF receptor signaling in
tumor angiogenesis. Oncologist. 5(Suppl 1): 3–10. 2000. View Article : Google Scholar : PubMed/NCBI
|
|
21
|
Sandler A, Yi J, Dahlberg S, Kolb MM, Wang
L, Hambleton J, Schiller J and Johnson DH: Treatment outcomes by
tumor histology in Eastern Cooperative Group Study E4599 of
bevacizumab with paclitaxel/carboplatin for advanced non-small cell
lung cancer. J Thorac Oncol. 5:1416–1423. 2010. View Article : Google Scholar : PubMed/NCBI
|
|
22
|
Sandler A, Gray R, Perry MC, Brahmer J,
Schiller JH, Dowlati A, Lilenbaum R and Johnson DH:
Paclitaxel-carboplatin alone or with bevacizumab for non-small-cell
lung cancer. N Engl J Med. 355:2542–2550. 2006. View Article : Google Scholar : PubMed/NCBI
|
|
23
|
Aggarwal C, Somaiah N and Simon G:
Antiangiogenic agents in the management of non-small cell lung
cancer: Where do we stand now and where are we headed? Cancer Biol
Ther. 13:247–263. 2012. View Article : Google Scholar : PubMed/NCBI
|
|
24
|
Calero R, Morchon E, Johnsen JI and
Serrano R: Sunitinib suppress neuroblastoma growth through
degradation of MYCN and inhibition of angiogenesis. PLoS One.
9:e956282014. View Article : Google Scholar : PubMed/NCBI
|
|
25
|
Teodoro JG, Evans SK and Green MR:
Inhibition of tumor angiogenesis by 53: A new role forthe guardian
of the genome. J Mol Med (Berl). 85:1175–1186. 2007. View Article : Google Scholar
|
|
26
|
Wietrzyk J, Nevozhay D, Filip B, Milczarek
M and Kutner A: The antitumor effect of lowered doses of
cytostatics combined with new analogs of vitamin D in mice.
Anticancer Res. 27(5A): 3387–3398. 2007.PubMed/NCBI
|
|
27
|
Wietrzyk J, Nevozhay D, Milczarek M, Filip
B and Kutner A: Toxicity and antitumor activity of the vitamin D
analogs PRI-1906 and PRI-1907 in combined treatment with
cyclophosphamide in a mouse mammary cancer model. Cancer Chemother
Pharmacol. 62:787–797. 2008. View Article : Google Scholar : PubMed/NCBI
|
|
28
|
Milczarek M, Rosinska S, Psurski M,
Maciejewska M, Kutner A and Wietrzyk J: Combined colonic cancer
treatment with vitamin D analogs and irinotecan or oxaliplatin.
Anticancer Res. 33:433–444. 2013.PubMed/NCBI
|
|
29
|
Milczarek M, Psurski M, Kutner A and
Wietrzyk J: Vitamin D analogs enhance the anticancer activity of
5-fluorouracil in an in vivo mouse colon cancer model. BMC Cancer.
13:2942013. View Article : Google Scholar : PubMed/NCBI
|
|
30
|
Milczarek M, Filip-Psurska B, Swiętnicki
W, Kutner A and Wietrzyk J: Vitamin D analogs combined with
5-fluorouracil in human HT-29 colon cancer treatment. Oncol Rep.
32:491–504. 2014. View Article : Google Scholar : PubMed/NCBI
|
|
31
|
Maj E, Filip-Psurska B, Świtalska M,
Kutner A and Wietrzyk J: Vitamin D analogs potentiate the antitumor
effect of imatinib mesylate in a human A549 lung tumor model. Int J
Mol Sci. 16:27191–27207. 2015. View Article : Google Scholar : PubMed/NCBI
|
|
32
|
Trynda J, Turlej E, Milczarek M,
Pietraszek A, Chodyński M, Kutner A and Wietrzyk J:
Antiproliferative activity and in vivo toxicity of double-point
modified analogs of 1,25-dihydroxyergocalciferol. Int J Mol Sci.
16:24873–24894. 2015. View Article : Google Scholar : PubMed/NCBI
|
|
33
|
Kieda C, Paprocka M, Krawczenko A, Załecki
P, Dupuis P, Monsigny M, Radzikowski C and Duś D: New human
microvascular endothelial cell lines with specific adhesion
molecules phenotypes. Endothelium. 9:247–261. 2002. View Article : Google Scholar
|
|
34
|
Nevozhay D: Cheburator software for
automatically calculating drug inhibitory concentrations from in
vitro screening assays. PLoS One. 9:e1061862014. View Article : Google Scholar : PubMed/NCBI
|
|
35
|
McDaid HM and Johnston PG: Synergistic
interaction between paclitaxel and 8-chloro-adenosine
3′,5′-monophosphate in human ovarian carcinoma cell lines. Clin
Cancer Res. 5:215–220. 1999.PubMed/NCBI
|
|
36
|
Chou TC: Drug combination studies and
their synergy quantification using the Chou-Talalay method. Cancer
Res. 70:440–446. 2010. View Article : Google Scholar : PubMed/NCBI
|
|
37
|
Chou TC and Talalay P: Generalized
equations for the analysis of inhibitions of Michaelis-Menten and
higher-order kinetic systems with two or more mutually exclusive
and nonexclusive inhibitors. Eur J Biochem. 115:207–216. 1981.
View Article : Google Scholar : PubMed/NCBI
|
|
38
|
Chou TC and Talalay P: Quantitative
analysis of dose-effect relationships: The combined effects of
multiple drugs or enzyme inhibitors. Adv Enzyme Regul. 22:27–55.
1984. View Article : Google Scholar : PubMed/NCBI
|
|
39
|
Ekici OD, Li ZZ, Campbell AJ, James KE,
Asgian JL, Mikolajczyk J, Salvesen GS, Ganesan R, Jelakovic S,
Grütter MG, et al: Design, synthesis, and evaluation of aza-peptide
Michael acceptors as selective and potent inhibitors of caspases-2,
-3, -6, -7, -8, -9, and -10. J Med Chem. 49:5728–5749. 2006.
View Article : Google Scholar : PubMed/NCBI
|
|
40
|
Ramnath N, Kim S and Christensen PJ:
Vitamin D and lung cancer. Expert Rev Respir Med. 5:305–309. 2011.
View Article : Google Scholar : PubMed/NCBI
|
|
41
|
Switalska M, Nasulewicz-Goldeman A,
Opolska A, Maciejewska M, Kutner A and Wietrzyk J: The in-vitro
antiproliferative effect of PRI-2191 and imatinib applied in
combined treatment with cisplatin, idarubicin, or docetaxel on
human leukemia cells. Anticancer Drugs. 23:70–80. 2012. View Article : Google Scholar
|
|
42
|
Pan F, Tian J, Zhang X, Zhang Y and Pan Y:
Synergistic interaction between sunitinib and docetaxel is sequence
dependent in human non-small lung cancer with EGFR TKIs-resistant
mutation. J Cancer Res Clin Oncol. 137:1397–1408. 2011. View Article : Google Scholar : PubMed/NCBI
|
|
43
|
Zhuravel E, Efanova O, Shestakova T,
Glushko N, Mezhuev O, Soldatkina M and Pogrebnoy P: Administration
of vitamin D3 improves antimetastatic efficacy of cancer vaccine
therapy of Lewis lung carcinoma. Exp Oncol. 32:33–39.
2010.PubMed/NCBI
|
|
44
|
Socinski MA, Novello S, Brahmer JR, Rosell
R, Sanchez JM, Belani CP, Govindan R, Atkins JN, Gillenwater HH,
Pallares C, et al: Multicenter, phase II trial of sunitinib in
previously treated, advanced non-small-cell lung cancer. J Clin
Oncol. 26:650–656. 2008. View Article : Google Scholar : PubMed/NCBI
|
|
45
|
Kerbel RS, Viloria-Petit A, Klement G and
Rak J: 'Accidental' anti-angiogenic drugs. Anti-oncogene directed
signal transduction inhibitors and conventional chemotherapeutic
agents as examples. Eur J Cancer. 36:1248–1257. 2000. View Article : Google Scholar : PubMed/NCBI
|
|
46
|
Klement G, Baruchel S, Rak J, Man S, Clark
K, Hicklin DJ, Bohlen P and Kerbel RS: Continuous low-dose therapy
with vinblastine and VEGF receptor-2 antibody induces sustained
tumor regression without overt toxicity. J Clin Invest.
105:R15–R24. 2000. View Article : Google Scholar : PubMed/NCBI
|
|
47
|
Man S, Bocci G, Francia G, Green SK, Jothy
S, Hanahan D, Bohlen P, Hicklin DJ, Bergers G and Kerbel RS:
Antitumor effects in mice of low-dose (metronomic) cyclophosphamide
administered continuously through the drinking water. Cancer Res.
62:2731–2735. 2002.PubMed/NCBI
|
|
48
|
Kollmannsberger C, Soulieres D, Wong R,
Scalera A, Gaspo R and Bjarnason G: Sunitinib therapy for
metastatic renal cell carcinoma: Recommendations for management of
side effects. Can Urol Assoc J. 1(Suppl): S41–S54. 2007.
|
|
49
|
Di Lorenzo G, Porta C, Bellmunt J,
Sternberg C, Kirkali Z, Staehler M, Joniau S, Montorsi F and
Buonerba C: Toxicities of targeted therapy and their management in
kidney cancer. Eur Urol. 59:526–540. 2011. View Article : Google Scholar : PubMed/NCBI
|
|
50
|
Wietrzyk J, Pełczyńska M, Madej J, Dzimira
S, Kuśnierczyk H, Kutner A, Szelejewski W and Opolski A: Toxicity
and antineoplastic effect of (24R)-1,24-dihydroxyvitamin D3
(PRI-2191). Steroids. 69:629–635. 2004. View Article : Google Scholar : PubMed/NCBI
|
|
51
|
Díaz GD, Paraskeva C, Thomas MG, Binderup
L and Hague A: Apoptosis is induced by the active metabolite of
vitamin D3 and its analogue EB1089 in colorectal adenoma and
carcinoma cells: Possible implications for prevention and therapy.
Cancer Res. 60:2304–2312. 2000.PubMed/NCBI
|
|
52
|
Pálmer HG, González-Sancho JM, Espada J,
Berciano MT, Puig I, Baulida J, Quintanilla M, Cano A, de Herreros
AG, Lafarga M, et al: Vitamin D(3) promotes the differentiation of
colon carcinoma cells by the induction of E-cadherin and the
inhibition of beta-catenin signaling. J Cell Biol. 154:369–387.
2001. View Article : Google Scholar : PubMed/NCBI
|
|
53
|
Teng CLJ, Yu CTR, Hwang WL, Tsai JR, Liu
HC, Hwang GY and Hsu SL: Effector mechanisms of sunitinib-induced
G1 cell cycle arrest, differentiation, and apoptosis in human acute
myeloid leukaemia HL60 and KG-1 cells. Ann Hematol. 92:301–313.
2013. View Article : Google Scholar
|
|
54
|
Nishikawa M, Miyake H and Fujisawa M:
Enhanced sensitivity to sunitinib by inhibition of Akt1 expression
in human castration-resistant prostate cancer C3 cells both in
vitro and in vivo. Urology. 85:1215.e1–1215.e7. 2015. View Article : Google Scholar
|
|
55
|
Uzu M, Sato H, Yamada R, Kashiba T,
Shibata Y, Yamaura K and Ueno K: Effect of enhanced expression of
connexin 43 on sunitinib-induced cytotoxicity in mesothelioma
cells. J Pharmacol Sci. 128:17–26. 2015. View Article : Google Scholar : PubMed/NCBI
|
|
56
|
Stepień A, Izdebska M and Grzanka A: The
types of cell death. Postepy Hig Med Dosw (Online). 61:420–428.
2007.In Polish.
|
|
57
|
Korwek Z and Alster O: The role of the DNA
damage response in apoptosis and cell senescence. Postepy Biochem.
60:248–262. 2014.In Polish.
|
|
58
|
Koren R, Wacksberg S, Weitsman GE and
Ravid A: Calcitriol sensitizes colon cancer cells to
H2O2-induced cytotoxicity while inhibiting
caspase activation. J Steroid Biochem Mol Biol. 101:151–160. 2006.
View Article : Google Scholar : PubMed/NCBI
|
|
59
|
Diker-Cohen T, Koren R, Liberman UA and
Ravid A: Vitamin D protects keratinocytes from apoptosis induced by
osmotic shock, oxidative stress, and tumor necrosis factor. Ann N Y
Acad Sci. 1010:350–353. 2003. View Article : Google Scholar
|
|
60
|
Lavallard VJ, Pradelli LA, Paul A,
Bénéteau M, Jacquel A, Auberger P and Ricci JE: Modulation of
caspase-independent cell death leads to resensitization of imatinib
mesylate-resistant cells. Cancer Res. 69:3013–3020. 2009.
View Article : Google Scholar : PubMed/NCBI
|
|
61
|
Costa PM, Cardoso AL, Nóbrega C, Pereira
de Almeida LF, Bruce JN, Canoll P and Pedroso de Lima MC:
MicroRNA-21 silencing enhances the cytotoxic effect of the
antiangiogenic drug sunitinib in glioblastoma. Hum Mol Genet.
22:904–918. 2013. View Article : Google Scholar :
|
|
62
|
Liu ZL, Wang H, Liu J and Wang ZX:
MicroRNA-21 (miR-21) expression promotes growth, metastasis, and
chemo- or radioresistance in non-small cell lung cancer cells by
targeting PTEN. Mol Cell Biochem. 372:35–45. 2013. View Article : Google Scholar
|
|
63
|
Xu L, Huang Y, Chen D, He J, Zhu W, Zhang
Y and Liu X: Downregulation of miR-21 increases cisplatin
sensitivity of non-small-cell lung cancer. Cancer Genet.
207:214–220. 2014. View Article : Google Scholar : PubMed/NCBI
|
|
64
|
Zhang YX, Yue Z, Wang PY, Li YJ, Xin JX,
Pang M, Zheng QY and Xie SY: Cisplatin upregulates MSH2 expression
by reducing miR-21 to inhibit A549 cell growth. Biomed
Pharmacother. 67:97–102. 2013. View Article : Google Scholar : PubMed/NCBI
|
|
65
|
Vakifahmetoglu H, Olsson M and Zhivotovsky
B: Death through a tragedy: Mitotic catastrophe. Cell Death Differ.
15:1153–1162. 2008. View Article : Google Scholar : PubMed/NCBI
|
|
66
|
Kim SH, Chen G, King AN, Jeon CK,
Christensen PJ, Zhao L, Simpson RU, Thomas DG, Giordano TJ, Brenner
DE, et al: Characterization of vitamin D receptor (VDR) in lung
adenocarcinoma. Lung Cancer. 77:265–271. 2012. View Article : Google Scholar : PubMed/NCBI
|
|
67
|
Naves M, Alvarez-Hernández D,
Fernández-Martín JL, Paz-Jiménez J, García-Prado P, Fernández-Coto
T, Santamaría I and Cannata-Andía J: Effect of VDR gene
polymorphisms on osteocalcin secretion in calcitriol-stimulated
human osteoblasts. Kidney Int Suppl. 63:S23–S27. 2003. View Article : Google Scholar
|
|
68
|
Alvarez-Hernandez D, Naves-Diaz M,
Gomez-Alonso C, Coto E and Cannata-Andia JB: Tissue-specific effect
of VDR gene polymorphisms on the response to calcitriol. J Nephrol.
21:843–849. 2008.PubMed/NCBI
|
|
69
|
Dogan I, Onen HI, Yurdakul AS, Konac E,
Ozturk C, Varol A and Ekmekci A: Polymorphisms in the vitamin D
receptor gene and risk of lung cancer. Med Sci Monit.
15:BR232–BR242. 2009.PubMed/NCBI
|
|
70
|
Fu Y, Li J and Zhang Y: Polymorphisms in
the vitamin D receptor gene and the lung cancer risk. Tumour Biol.
35:1323–1330. 2014. View Article : Google Scholar
|
|
71
|
Wu X, Cheng J and Yang K: Vitamin
D-related gene polymorphisms, plasma 25-hydroxy-vitamin D,
cigarette smoke and non-small cell lung cancer (NSCLC) risk. Int J
Mol Sci. 17:202016. View Article : Google Scholar
|
|
72
|
Vaughan-Shaw PG, O'Sullivan F, Farrington
SM, Theodoratou E, Campbell H, Dunlop MG and Zgaga L: The impact of
vitamin D pathway genetic variation and circulating
25-hydroxyvitamin D on cancer outcome: Systematic review and
meta-analysis. Br J Cancer. 116:1092–1110. 2017. View Article : Google Scholar : PubMed/NCBI
|
|
73
|
Slominski AT, Kim TK, Takeda Y, Janjetovic
Z, Brozyna AA, Skobowiat C, Wang J, Postlethwaite A, Li W, Tuckey
RC, et al: RORα and ROR γ are expressed in human skin and serve as
receptors for endogenously produced noncalcemic 20-hydroxy- and
20,23-dihydroxyvitamin D. FASEB J. 28:2775–2789. 2014. View Article : Google Scholar : PubMed/NCBI
|
|
74
|
Brożyna AA, Jóźwicki W, Skobowiat C,
Jetten A and Slominski AT: RORα and RORγ expression inversely
correlates with human melanoma progression. Oncotarget.
7:63261–63282. 2016. View Article : Google Scholar
|
|
75
|
Slominski AT, Kim TK, Hobrath JV, Oak ASW,
Tang EKY, Tieu EW, Li W, Tuckey RC and Jetten AM: Endogenously
produced nonclassical vitamin D hydroxy-metabolites act as 'biased'
agonists on VDR and inverse agonists on RORα and RORγ. J Steroid
Biochem Mol Biol. 173:42–56. 2017. View Article : Google Scholar
|
|
76
|
Du J and Xu R: RORα, a potential tumor
suppressor and therapeutic target of breast cancer. Int J Mol Sci.
13:15755–15766. 2012. View Article : Google Scholar
|
|
77
|
Slominski AT, Kim TK, Shehabi HZ, Semak I,
Tang EKY, Nguyen MN, Benson HAE, Korik E, Janjetovic Z, Chen J, et
al: In vivo evidence for a novel pathway of vitamin D-3 metabolism
initiated by P450scc and modified by CYP27B1. FASEB J.
26:3901–3915. 2012. View Article : Google Scholar : PubMed/NCBI
|
|
78
|
Slominski AT, Kim TK, Shehabi HZ, Tang
EKY, Benson HAE, Semak I, Lin Z, Yates CR, Wang J, Li W, et al: In
vivo production of novel vitamin D2 hydroxy-derivatives by human
placentas, epidermal keratinocytes, Caco-2 colon cells and the
adrenal gland. Mol Cell Endocrinol. 383:181–192. 2014. View Article : Google Scholar : PubMed/NCBI
|
|
79
|
Slominski AT, Kim TK, Li W, Postlethwaite
A, Tieu EW, Tang EKY and Tuckey RC: Detection of novel
CYP11A1-derived secosteroids in the human epidermis and serum and
pig adrenal gland. Sci Rep. 5:148752015. View Article : Google Scholar : PubMed/NCBI
|
|
80
|
Slominski AT, Kim TK, Li W and Tuckey RC:
Classical and non-classical metabolic transformation of vitamin D
in dermal fibroblasts. Exp Dermatol. 25:231–232. 2016. View Article : Google Scholar :
|
|
81
|
Zhang Q, Kanterewicz B, Shoemaker S, Hu Q,
Liu S, Atwood K and Hershberger P: Differential response to
1α,25-dihydroxyvitamin D3 (1α,25(OH)2D3) in non-small cell lung
cancer cells with distinct oncogene mutations. J Steroid Biochem
Mol Biol. 136:264–270. 2013. View Article : Google Scholar
|
|
82
|
Mimori K, Tanaka Y, Yoshinaga K, Masuda T,
Yamashita K, Okamoto M, Inoue H and Mori M: Clinical significance
of the overexpression of the candidate oncogene CYP24 in esophageal
cancer. Ann Oncol. 15:236–241. 2004. View Article : Google Scholar : PubMed/NCBI
|
|
83
|
Horváth HC, Lakatos P, Kósa JP, Bácsi K,
Borka K, Bises G, Nittke T, Hershberger PA, Speer G and Kállay E:
The candidate oncogene CYP24A1: A potential biomarker for
colorectal tumorigenesis. J Histochem Cytochem. 58:277–285. 2010.
View Article : Google Scholar :
|
|
84
|
Luo W, Hershberger PA, Trump DL and
Johnson CS: 24-Hydroxylase in cancer: Impact on vitamin D-based
anticancer therapeutics. J Steroid Biochem Mol Biol. 136:252–257.
2013. View Article : Google Scholar :
|
|
85
|
Zhang Q, Kanterewicz B, Buch S, Petkovich
M, Parise R, Beumer J, Lin Y, Diergaarde B and Hershberger PA:
CYP24 inhibition preserves 1α,25-dihydroxyvitamin D(3)
anti-proliferative signaling in lung cancer cells. Mol Cell
Endocrinol. 355:153–161. 2012. View Article : Google Scholar : PubMed/NCBI
|
|
86
|
Chung I, Yu WD, Karpf AR, Flynn G,
Bernardi RJ, Modzelewski RA, Johnson CS and Trump DL:
Anti-proliferative effects of calcitriol on endothelial cells
derived from two different microenvironments. J Steroid Biochem Mol
Biol. 103:768–770. 2007. View Article : Google Scholar : PubMed/NCBI
|
|
87
|
Spyridopoulos I, Brogi E, Kearney M,
Sullivan AB, Cetrulo C, Isner JM and Losordo DW: Vascular
endothelial growth factor inhibits endothelial cell apoptosis
induced by tumor necrosis factor-alpha: Balance between growth and
death signals. J Mol Cell Cardiol. 29:1321–1330. 1997. View Article : Google Scholar : PubMed/NCBI
|
|
88
|
Aonuma M, Iwahana M, Nakayama Y, Hirotani
K, Hattori C, Murakami K, Shibuya M and Tanaka NG: Tumorigenicity
depends on angiogenic potential of tumor cells: Dominant role of
vascular endothelial growth factor and/or fibroblast growth factors
produced by tumor cells. Angiogenesis. 2:57–66. 1998. View Article : Google Scholar
|
|
89
|
Kieser A, Weich HA, Brandner G, Marmé D
and Kolch W: Mutant p53 potentiates protein kinase C induction of
vascular endothelial growth factor expression. Oncogene. 9:963–969.
1994.PubMed/NCBI
|
|
90
|
Mukhopadhyay D, Tsiokas L and Sukhatme VP:
Wild-type p53 and v-Src exert opposing influences on human vascular
endothelial growth factor gene expression. Cancer Res.
55:6161–6165. 1995.PubMed/NCBI
|
|
91
|
Niklińska W, Burzykowski T, Chyczewski L
and Nikliński J: Expression of vascular endothelial growth factor
(VEGF) in non-small cell lung cancer (NSCLC): Association with p53
gene mutation and prognosis. Lung Cancer. 34(Suppl 2): S59–S64.
2001. View Article : Google Scholar
|
|
92
|
Fontanini G, Boldrini L, Vignati S, Chinè
S, Basolo F, Silvestri V, Lucchi M, Mussi A, Angeletti CA and
Bevilacqua G: Bcl2 and p53 regulate vascular endothelial growth
factor (VEGF)-mediated angiogenesis in non-small cell lung
carcinoma. Eur J Cancer. 34:718–723. 1998. View Article : Google Scholar : PubMed/NCBI
|
|
93
|
Yuan A, Yu CJ, Luh KT, Kuo SH, Lee YC and
Yang PC: Aberrant p53 expression correlates with expression of
vascular endothelial growth factor mRNA and interleukin-8 mRNA and
neoangiogenesis in non-small-cell lung cancer. J Clin Oncol.
20:900–910. 2002.PubMed/NCBI
|
|
94
|
Brown CJ, Lain S, Verma CS, Fersht AR and
Lane DP: Awakening guardian angels: Drugging the p53 pathway. Nat
Rev Cancer. 9:862–873. 2009. View Article : Google Scholar : PubMed/NCBI
|
|
95
|
Sundaram P, Dang CV and Thomas-Tikhonenko
A: Myc and control of tumor neovascularization. Cancer Genome and
Tumor Microenvironment. Thomas-Tikhonenko A: Springer; New York,
NY: pp. 167–187. 2010, View Article : Google Scholar
|
|
96
|
Mahalingam D, Espitia CM, Medina EC,
Esquivel JA II, Kelly KR, Bearss D, Choy G, Taverna P, Carew JS,
Giles FJ, et al: Targeting PIM kinase enhances the activity of
sunitinib in renal cell carcinoma. Br J Cancer. 105:1563–1573.
2011. View Article : Google Scholar : PubMed/NCBI
|
|
97
|
Xie C, Pan Y, Hao F, Gao Y, Liu Z, Zhang
X, Xie L, Jiang G, Li Q and Wang E: C-Myc participates in
β-catenin-mediated drug resistance in A549/DDP lung adenocarcinoma
cells. APMIS. 122:1251–1258. 2014. View Article : Google Scholar : PubMed/NCBI
|
|
98
|
O'Brate A and Giannakakou P: The
importance of p53 location: Nuclear or cytoplasmic zip code? Drug
Resist Updat. 6:313–322. 2003. View Article : Google Scholar
|
|
99
|
Levine AJ and Oren M: The first 30 years
of p53: Growing ever more complex. Nat Rev Cancer. 9:749–758. 2009.
View Article : Google Scholar : PubMed/NCBI
|
|
100
|
Patel S and Player MR: Small-molecule
inhibitors of the p53-HDM2 interaction for the treatment of cancer.
Expert Opin Investig Drugs. 17:1865–1882. 2008. View Article : Google Scholar : PubMed/NCBI
|
|
101
|
Panka DJ, Liu Q, Geissler AK and Mier JW:
Effects of HDM2 antagonism on sunitinib resistance, p53 activation,
SDF-1 induction, and tumor infiltration by
CD11b+/Gr-1+ myeloid derived suppressor
cells. Mol Cancer. 12:172013. View Article : Google Scholar
|
|
102
|
Gan L, Wang J, Xu H and Yang X: Resistance
to docetaxel-induced apoptosis in prostate cancer cells by
p38/p53/p21 signaling. Prostate. 71:1158–1166. 2011. View Article : Google Scholar : PubMed/NCBI
|
|
103
|
Kumagai T, O'Kelly J, Said JW and Koeffler
HP: Vitamin D2 analog 19-nor-1,25-dihydroxyvitamin D2: Antitumor
activity against leukemia, myeloma, and colon cancer cells. J Natl
Cancer Inst. 95:896–905. 2003. View Article : Google Scholar : PubMed/NCBI
|
|
104
|
Ma J, Sawai H, Ochi N, Matsuo Y, Xu D,
Yasuda A, Takahashi H, Wakasugi T and Takeyama H: PTEN regulates
angiogenesis through PI3K/Akt/VEGF signaling pathway in human
pancreatic cancer cells. Mol Cell Biochem. 331:161–171. 2009.
View Article : Google Scholar : PubMed/NCBI
|
|
105
|
Clarke JM and Hurwitz HI: Understanding
and targeting resistance to anti-angiogenic therapies. J
Gastrointest Oncol. 4:253–263. 2013.PubMed/NCBI
|
|
106
|
Giuliano S and Pagès G: Mechanisms of
resistance to anti-angiogenesis therapies. Biochimie. 95:1110–1119.
2013. View Article : Google Scholar : PubMed/NCBI
|
|
107
|
Joosten SC, Hamming L, Soetekouw PM, Aarts
MJ, Veeck J, van Engeland M and Tjan-Heijnen VC: Resistance to
sunitinib in renal cell carcinoma: From molecular mechanisms to
predictive markers and future perspectives. Biochim Biophys Acta.
1855:1–16. 2015.
|
|
108
|
Huang D, Ding Y, Zhou M, Rini BI, Petillo
D, Qian CN, Kahnoski R, Futreal PA, Furge KA and Teh BT:
Interleukin-8 mediates resistance to antiangiogenic agent sunitinib
in renal cell carcinoma. Cancer Res. 70:1063–1071. 2010. View Article : Google Scholar : PubMed/NCBI
|
|
109
|
Wysoczynski M, Shin DM, Kucia M and
Ratajczak MZ: Selective upregulation of interleukin-8 by human
rhabdomyosarcomas in response to hypoxia: Therapeutic implications.
Int J Cancer. 126:371–381. 2010. View Article : Google Scholar
|
|
110
|
Hoesel B and Schmid JA: The complexity of
NF-κB signaling in inflammation and cancer. Mol Cancer. 12:862013.
View Article : Google Scholar
|
|
111
|
Chen W, Li Z, Bai L and Lin Y: NF-kappaB
in lung cancer, a carcinogenesis mediator and a prevention and
therapy target. Front Biosci (Landmark Ed). 16:1172–1185. 2011.
View Article : Google Scholar
|
|
112
|
Sanchez A, Tripathy D, Yin X, Luo J,
Martinez JM and Grammas P: Sunitinib enhances neuronal survival in
vitro via NF-κB-mediated signaling and expression of
cyclooxygenase-2 and inducible nitric oxide synthase. J
Neuroinflammation. 10:932013. View Article : Google Scholar
|
|
113
|
Barkett M and Gilmore TD: Control of
apoptosis by Rel/NF-kappaB transcription factors. Oncogene.
18:6910–6924. 1999. View Article : Google Scholar : PubMed/NCBI
|
|
114
|
Aoki M, Nata T, Morishita R, Matsushita H,
Nakagami H, Yamamoto K, Yamazaki K, Nakabayashi M, Ogihara T and
Kaneda Y: Endothelial apoptosis induced by oxidative stress through
activation of NF-kappaB: Antiapoptotic effect of antioxidant agents
on endothelial cells. Hypertension. 38:48–55. 2001. View Article : Google Scholar : PubMed/NCBI
|
|
115
|
Royds JA, Dower SK, Qwarnstrom EE and
Lewis CE: Response of tumour cells to hypoxia: Role of p53 and
NFkB. Mol Pathol. 51:55–61. 1998. View Article : Google Scholar : PubMed/NCBI
|
|
116
|
Perkins ND and Gilmore TD: Good cop, bad
cop: The different faces of NF-kappaB. Cell Death Differ.
13:759–772. 2006. View Article : Google Scholar : PubMed/NCBI
|
|
117
|
Krishnan AV and Feldman D: Molecular
pathways mediating the anti-inflammatory effects of calcitriol:
Implications for prostate cancer chemoprevention and treatment.
Endocr Relat Cancer. 17:R19–R38. 2010. View Article : Google Scholar
|