Introduction
Lung cancer is the most common cause of
cancer-associated mortality worldwide, and the number of cases is
increasing annually (1). Non-small
cell lung cancer (NSCLC), including squamous cell carcinoma,
adenocarcinoma and large cell carcinoma, accounts for ~85% of all
lung cancer types (2). Despite the
increase in lung cancer survival rates as a result of improvements
in diagnosis and treatment, the overall prognosis remains poor, and
novel treatment strategies for patients with lung cancer are
urgently required (3). An
understanding of the molecular network in NSCLC is essential for
the identification of effective therapeutic targets and the
development of NSCLC treatment strategies; however, several aspects
of the molecular network of lung carcinogenesis remain to be
elucidated (4).
MicroRNAs (miRNAs) comprise a family of
21-25-nucleotide-long non-coding small RNAs, which primarily
function as gene regulators. miRNAs function as repressors of
translation or inducers of messenger RNA (mRNA) degradation through
binding to target sites in the 3′untranslated regions (3′UTRs) of
protein-coding transcripts (5).
Several studies have shown that miRNAs control proliferation,
differentiation and apoptosis in various cell types (6,7), and
increasing evidence indicates the presence of aberrant miRNA
expression profiles and unique miRNA signaling pathways in several
types of cancer (8).
Our previous study comprised an integrative
multi-omics analysis of 26 lung adenocarcinoma cell lines to
understand how cancer harbors various genomic, epigenomic and
transcriptional aberrations (9).
Emerging evidence suggests that miRNAs act as oncogenic or tumor
suppressor elements in tumorigenesis (10), and thus, the detection of specific
miRNAs in tumor tissues or cells provides a useful diagnostic tool
for presymptomatic cancer detection. Additionally, elucidation of
the functions of miRNAs in tumorigenesis provides a potential novel
therapeutic approach, as it may be possible to control the
expression of miRNA by delivering synthetic pre-miRNA or antisense
oligonucleotides (11). The
present study aimed to identify miRNAs, which correlated
specifically with the progression of lung cancer through the
analysis of 57,100 transcripts and 1,341 small RNA expression
profiles from 26 lung adenocarcinoma cell lines. The results
identified miR-26a and HMGA1 as possible therapeutic targets and
regulators of cancer progression in lung adenocarcinoma.
Materials and methods
Cell line
The H1299 human NSCLC cell line was obtained from
American Type Culture Collection (Manassas, VA, USA; CRL-5803™) and
cultured in RPMI medium (Thermo Fisher Scientific, Inc., Waltham,
MA, USA) supplemented with 10% v/v fetal bovine serum and 1% v/v
antibiotic solution (growth medium). The culture medium used for
the other cell lines has been described elsewhere (9). The cells were incubated at 37°C with
5% CO2. The other cell lines used for sequencing are
listed in Table I.
 | Table I.Cancer cell lines included for
assessment in the present study. |
Table I.
Cancer cell lines included for
assessment in the present study.
| Cell line | Distributor | Cat. no. |
|---|
| A427 | ATCC | HTB-53 |
| A549 | ATCC | CCL-185 |
| H322 | ATCC | CRL-5806 |
| H1299 | ATCC | CRL-5803 |
| H1437 | ATCC | CRL-5872 |
| H1648 | ATCC | CRL-5882 |
| H1650 | ATCC | CRL-5883 |
| H1703 | ATCC | CRL-5889 |
| H1819 | ATCC | CRL-5897 |
| H1975 | ATCC | CRL-5908 |
| H2126 | ATCC | CCL-256 |
| H2228 | ATCC | CRL-5935 |
| H2347 | ATCC | CRL-5942 |
| RERF-LC-Ad1 | JCRB | JCRB1020 |
| RERF-LC-Ad2 | JCRB | JCRB1021 |
| RERF-LC-MS | JCRB | JCRB0081 |
| RERF-LC-OK | JCRB | JCRB0811 |
| VMRC-LCD | JCRB | JCRB0814 |
| ABC-1 | JCRB | JCRB0815 |
| PC-3 | JCRB | JCRB0077 |
| PC-9 | RIKEN BRC | RCB4455 |
| RERF-LC-KJ | RIKEN BRC | RCB1313 |
| LC2/ad | RIKEN BRC | RCB0440 |
| II-18 | RIKEN BRC | RCB2093 |
| PC-7 | IBL | Upon request |
| PC-14 | IBL | Upon request |
Sequencing
Total RNA was extracted from the lung cancer cells
using the miRNeasy Mini kit (Qiagen GmbH, Hilden, Germany)
according to the manufacturer's protocol. An mRNA library was
prepared using the TruSeq RNA Sample Prep kit v2 (Illumina, Inc.,
San Diego, CA, USA). A small RNA library was prepared using TruSeq
Small RNA Sample Prep kit (Illumina, Inc.). mRNA and small RNA
sequence data were acquired using the HiSeq2500 system (Illumina,
Inc.). All raw sequence data were deposited in the DNA Data Bank of
Japan under the accession numbers DRA001846 (RNA-Seq) (9) and DRA003587 (small RNA-Seq).
Expression plasmids and RNA
oligonucleotides
An miRNA duplex corresponding to miR26a,
pcDNA3-miR26a2, was purchased from Addgene, Inc. (Cambridge, MA,
USA). The pcDNA3.1 control vector used for transfection was
purchased from Invitrogen; Thermo Fisher Scientific, Inc. HMGA1
small interfering RNA (siRNA) was synthesized by Sigma-Aldrich;
Merck Millipore (Darmstadt, Germany). AllStars Negative Control
siRNA was purchased from Qiagen GmbH and used as a control.
Cell transfection
The cells (2.5×10⁵ cells per well) were plated in 2
ml of growth medium in 6-well plates 1 day prior to transfection.
Oligonucleotide transfection was performed using Lipofectamine 3000
(Invitrogen; Thermo Fisher Scientific, Inc.). Briefly, 7.5 µl of
Lipofectamine 3000 was diluted in 125 µl of Opti-MEM1 (Gibco;
Thermo Fisher Scientific, Inc.) and mixed with 125 µl of DNA
diluted in P3000 reagent with Opti-MEM1 medium. The mixed solutions
were maintained at room temperature for 5 min and subsequently
added to each well. The 6-well plate was then incubated at 37°C
with 5% CO2 prior to use in further experiments.
Cell extraction and western blot
analysis
At 3 days post-transfection, the cells were
harvested and lysed in 500 µl RIPA buffer (Wako Pure Chemical
Industries, Ltd., Osaka, Japan) supplemented with 10% Complete Mini
solution (Roche Diagnostics, Basel, Switzerland). The protein
concentration was determined using a Pierce BCA Protein Assay kit
(Thermo Fisher Scientific, Inc.). Lysate aliquots containing equal
quantities of protein (1 µg per lane) were separated by 5–20%
sodium dodecyl sulfate-polyacrylamide gel electrophoresis and then
electrophoretically transferred onto Immun-Blot PVDF membranes
(Bio-Rad Laboratories, Inc., Hercules, CA, USA). The membranes were
blocked in a solution containing 5% milk protein and 0.1% Tween 20
in Tris-buffered saline (TBS), and then incubated overnight with
the appropriate primary antibody at 4°C. The blots were then washed
and incubated with an appropriate horseradish peroxidase-linked
species-specific whole secondary antibody diluted 1:100,000 in TBS
with 0.1% Tween 20 and 5% milk protein for 1 h at room temperature.
Secondary antibody binding was visualized using the Las-3000 mini
system (FujiFilm, Tokyo, Japan) and an ECL Prime Western Blotting
detection system (GE Healthcare Life Sciences, Chalfont, UK). The
following primary antibodies were purchased from Abcam (Cambridge,
UK) and used for western blot analysis: Anti-tubulin (cat. no.
ab4074; 1:1,000 dilution) and anti-HMGA1 (cat. no. ab129153;
1:10,000). The anti-rabbit horseradish peroxidase-linked secondary
antibody (cat. no. NA934-100UL) was purchased from GE Healthcare
Life Sciences.
Reverse transcription-quantitative
polymerase chain reaction (RT-qPCR) analysis
Total RNA was extracted from the cells with the
miRNeasy Mini kit according to the manufacturer's protocol. Primers
were synthesized by Exigen (Tokyo, Japan). The miRNA expression
levels were detected via SYBR Green-based real-time PCR with the
mir-X miRNA qRT-PCR SYBR kit (Clontech Laboratories, Inc., Palo
Alto, CA, USA) according to the manufacturer's protocol using
200–400 ng cDNA and 0.5 µl 100 nM primers. The mRNA expression
levels were detected with SYBR SELECT Master mix (Applied
Biosystems, Inc.; Thermo Fisher Scientific, Inc.) according to the
manufacturer's protocol using 400–800 ng cDNA and 2 µl 100 nM
primers. The following specific primers were used for RT-qPCR:
miR-26a, forward 5′-TTCAAGTAATCCAGGATAGGCT-3′ and reverse mRQ
3′primer (a component of the mir-X miRNA qRT-PCR SYBR kit); HMGA1
pair A, forward 5′-GGCCCAAATCGACCATAAAGG−3′ and reverse
5′-GGACAAATCATGGCTACCCCT−3′; HMGA1 pair B, forward
5′-CAGCGAAGTGCCAACACCTAA−3′ and reverse
5′-GTTTTTGCTTCCCTTTGGTCG−3′; and U6 forward and reverse primers
(provided in the mir-X miRNA qRT-PCR SYBR kit). The qPCR analysis
was performed under the following conditions: 2 min at 50°C, 10 min
at 95°C, and 40 cycles at 95°C for 15 sec and 60°C for 1 min on a
7900HT Fast Real Time PCR system (Applied Biosystems, Inc.; Thermo
Fisher Scientific, Inc.). The relative expression levels of miR-26a
and HMGA1 were calculated and quantified using the ΔΔCq method
(12) following normalization to
the expression levels of U6 small nuclear RNA.
Cell migration and invasion assay
The CytoSelect 96-well cell migration assay (8 µm;
fluorometric format; Cell Biolabs, Inc., San Diego, CA, USA) and
CytoSelect 96-well cell invasion assay basement membrane
(fluorometric format; Cell Biolabs, Inc.) were used to analyze cell
migration and invasion activities, respectively. Equal numbers of
cells (1.0×10⁵ cells per chamber), which had been
transfected with RNA duplex or plasmid for 48 h, were seeded into
the upper chambers containing serum-free medium. Medium with 10%
serum was added to the lower chambers as a chemoattractant. After
12 h incubation at 37°C, 4X lysis buffer/CyQuant GR dye solution
(Cell Biolabs, Inc.) was added to the lower chambers. The numbers
of migrated and invaded cells were counted via fluorescence
detection at 480/520 nm, using a FLUOstar OPTIMA microplate reader
(BMG Labtech, GmbH, Ortenberg, Germany).
Cell proliferation assay
The cells were counted using a Cell Counting Kit-8
(CCK-8; Dojindo Molecular Technologies, Inc., Kumamoto, Japan). In
brief, 10 µl of CCK-8 solution was added to the cells in each well
of a 96-well plate, followed by incubation for 2 h at 37°C in 5%
CO2. The solution absorbance was measured at 450 nm in
an iMark microplate absorbance reader (Bio-Rad Laboratories,
Inc.).
Luciferase assays
To construct the luciferase reporter vectors, a
3′untranslated region (UTR) fragment of wild-type (WT) human HMGA1,
which contained miR-26a binding sites, was amplified from genomic
DNA using the following primers: Forward
5′-TCGAAAGCTTCCCAAATCGACCATAAAGGGTG-3′ and reverse
5′-TCGAACTAGTTCCAGAAAAGGATATTTTTTTTATTCAAG−3′. The amplification
was performed with Phusion High-Fidelity DNA Polymerase (New
England BioLabs, Inc., Ipswich, MA, USA) under the following
conditions: 30 sec at 98°C; and 30 cycles at 98°C for 10 sec, 65°C
for 30 sec and 72°C for 90 sec, followed by 72°C for 10 min; on a
GeneAmp PCR System 9700 (Applied Biosystems; Thermo Fisher
Scientific, Inc.). The amplified fragment was inserted into the
pMIR-REPORT miRNA expression reporter vector (Applied Biosystems,
Inc., Thermo Fisher Scientific, Inc.) at the
HindIII/SpeI sites. Mutations were generated in the
miR-26a binding sites using the KOD-Plus-Mutagenesis kit (Toyobo
Co., Ltd., Osaka, Japan) and the following primers: Forward
5′-ATGAACTATAAAAAAAATATCCTTTTCTGGAA-3′ and reverse
5′-CTGCAAATAGGAAACCAGAGAGGG−3′. The sequences of the resulting
plasmids containing the WT or mutated (Mut) 3′UTR of HMGA1 were
verified by DNA sequencing. The Renilla luciferase-encoding
plasmid, pRL-TK (Promega Corporation, Madison, WI, USA) was used as
an internal control. The H1299 cells (1.2×10³ cells per
well) were plated in 100 µl of growth medium in 96-well plates one
day prior to transfection. At room temperature, the H1299 cells
were co-transfected with either the miR-26a expression vector or
the control vector along with the pRL-TK vector and pMIR-REPORT
miRNA, the expression reporter vector containing the WT or Mut
3′UTR of HMGA1. After 48 h, the cells were harvested and subjected
to luciferase analysis using the Dual-Luciferase reporter assay
system (Promega Corporation) in a Centro LB 960 (Berthold
Technologies, Bad Wildbad, Germany).
Statistical analysis
The sequence data were mapped to the human reference
genome, hg19, in the UCSC genome browser (https://genome.ucsc.edu) using the Efficient
Large-Scale Alignment of Nucleotide Databases tool (Illumina,
Inc.), as described in a previous study (9). Using perl script, the parts per
million (ppm) and reads per kilobase per million were calculated as
miRNA and mRNA expression levels, respectively. Correlation
coefficients were calculated using Pearson product-moment
correlation. A heat map was generated using heatmap.2 in the gplots
of R.
Results
Negative correlation between the
expression levels of miR-26a and HMGA1 in 26 human lung
adenocarcinoma cell lines
The present study assessed small RNAs in 26 human
lung adenocarcinoma cell lines (Table
I) using next-generation sequencing. A total of 1,341 miRNAs
were selected from these data, and their expression levels were
calculated in ppm. To determine the associations between miRNA and
mRNA expression throughout the genome, the correlation coefficient
was calculated between each miRNA and individual mRNAs using mRNA
data from a previous study (9). A
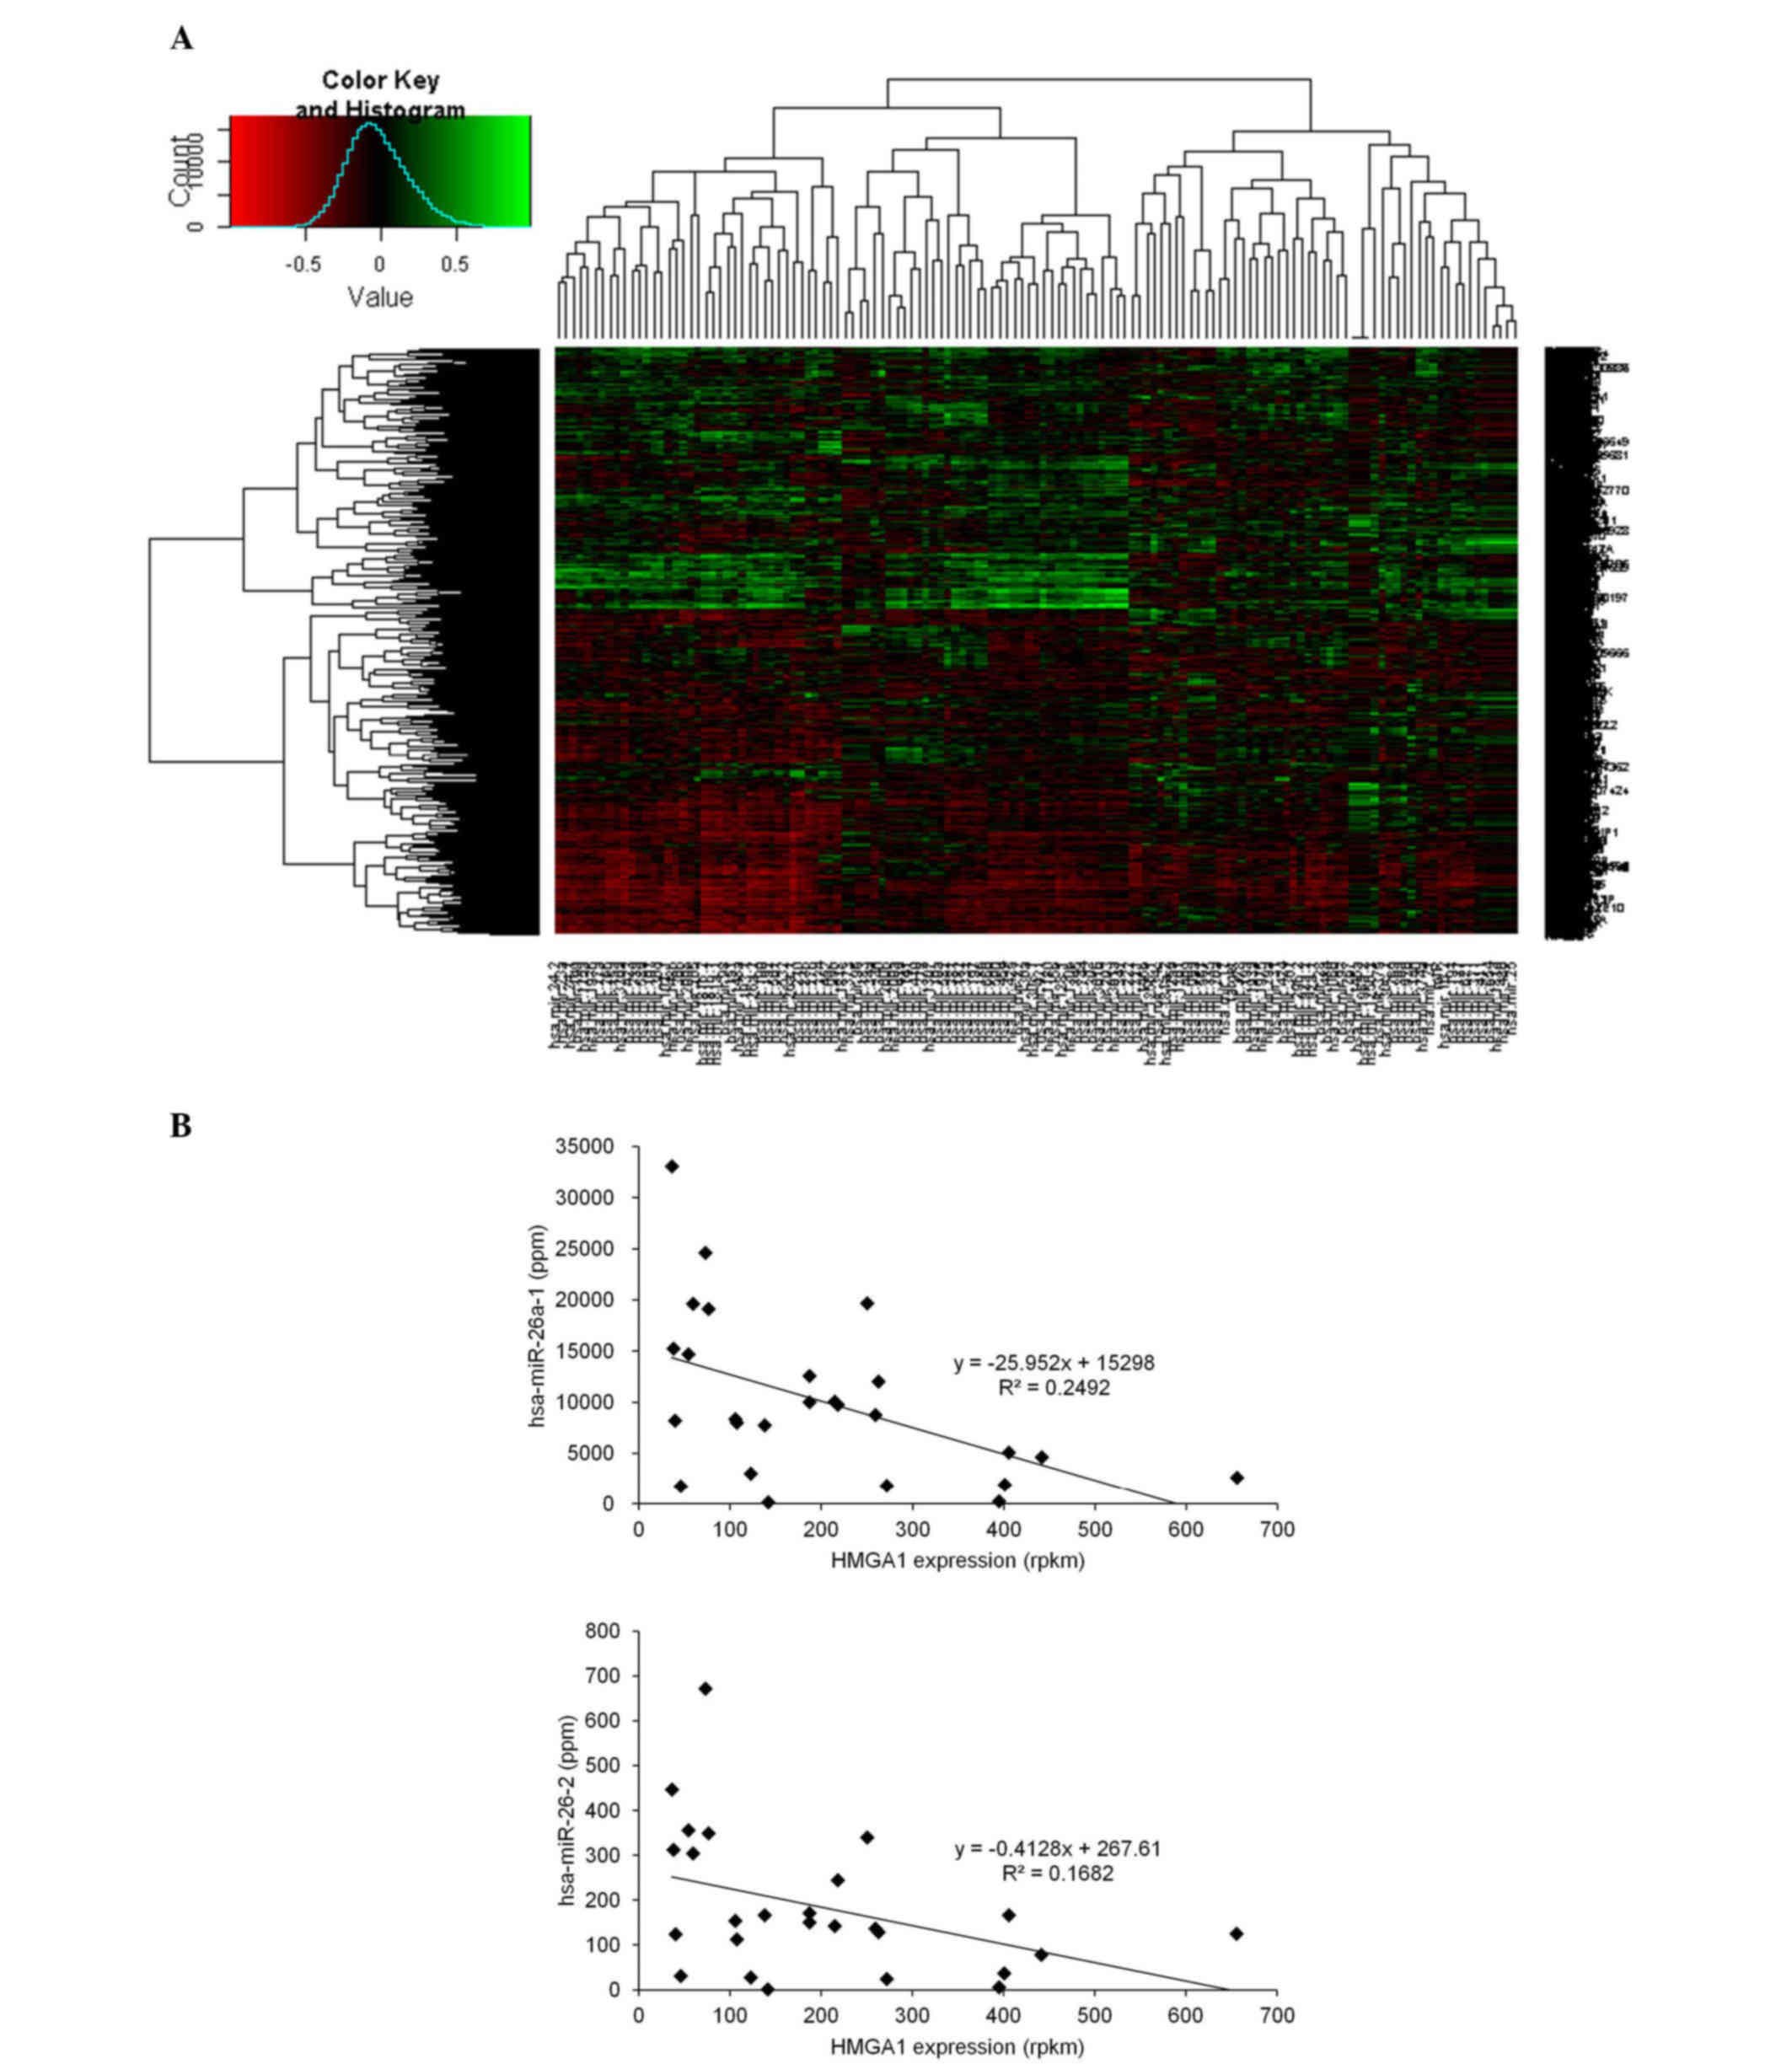
heat map of these correlation coefficients is shown in Fig. 1A. As shown in the histogram in
Fig. 1A, a higher number of mRNAs
were negatively correlated with miRNAs, compared with the number of
mRNAs positively correlated with miRNAs. This suggested the
predominantly repressive effects of miRNAs on mRNAs in these cell
lines. Among the miRNAs, hsa-miR-26a-1, the major precursor RNA of
miR-26a, exhibited the most marked negative correlation with
overall mRNA expression (the 10 miRNAs most negatively correlated
with overall mRNA expression are shown in Table II), suggesting that miR-26a may
have the most marked effect within these adenocarcinoma cell lines.
Subsequently, the present study aimed to identify the mRNA
correlated most significantly with hsa-miR-26a-1. It was found that
the HMGA1 mRNA exhibited the most marked negative correlation with
hsa-miR-26a-1, suggesting that it was affected most by miR-26a.
HMGA1 is a master chromatin structural regulator, which primarily
mediates its gene regulatory activity by interacting directly with
A/T-rich DNA sequences located in promoter and enhancer regions
(13). HMGA1 also exhibited a
negative correlation with another miR-26a precursor, hsa-miR-26a-2
(Fig. 1B and Table III).
| Table II.Top 10 miRNAs exhibiting negative
correlation with overall mRNA expression. |
Table II.
Top 10 miRNAs exhibiting negative
correlation with overall mRNA expression.
| Rank | miRNA | Correlation
coefficient |
|---|
| 1 | hsa-miR-26a-1 | −0.1105 |
| 2 | hsa-miR-24-2 | −0.0861 |
| 3 | hsa-miR-210 | −0.0859 |
| 4 | hsa-miR-23b | −0.0790 |
| 5 | hsa-miR-320a | −0.0754 |
| 6 | hsa-miR-24-1 | −0.0728 |
| 7 | hsa-miR-181b-2 | −0.0705 |
| 8 | hsa-miR-26b | −0.0654 |
| 9 | hsa-miR-501 | −0.0603 |
| 10 | hsa-miR-98 | −0.0588 |
| Table III.Top 10 mRNAs exhibiting the highest
negative correlations with the expression of hsa-miR-26a-1. |
Table III.
Top 10 mRNAs exhibiting the highest
negative correlations with the expression of hsa-miR-26a-1.
| mRNA | hsa-miR-26a-1
(correlation coefficient) | hsa-miR-26a-2
(correlation coefficient) |
|---|
| HMGA1 | −0.4927 | −0.3758 |
| SRSF3 | −0.4845 | −0.3640 |
| PRDX3 | −0.4844 | −0.3977 |
| COPS6 | −0.4755 | −0.3022 |
| TMEM222 | −0.4720 | −0.3032 |
| MCL1 | −0.4546 | −0.4291 |
| MAP2K2 | −0.3810 | −0.2176 |
| MATR3 | −0.3426 | −0.1367 |
| EIF5A | −0.3150 | −0.1595 |
| CKS2 | −0.3100 | −0.1851 |
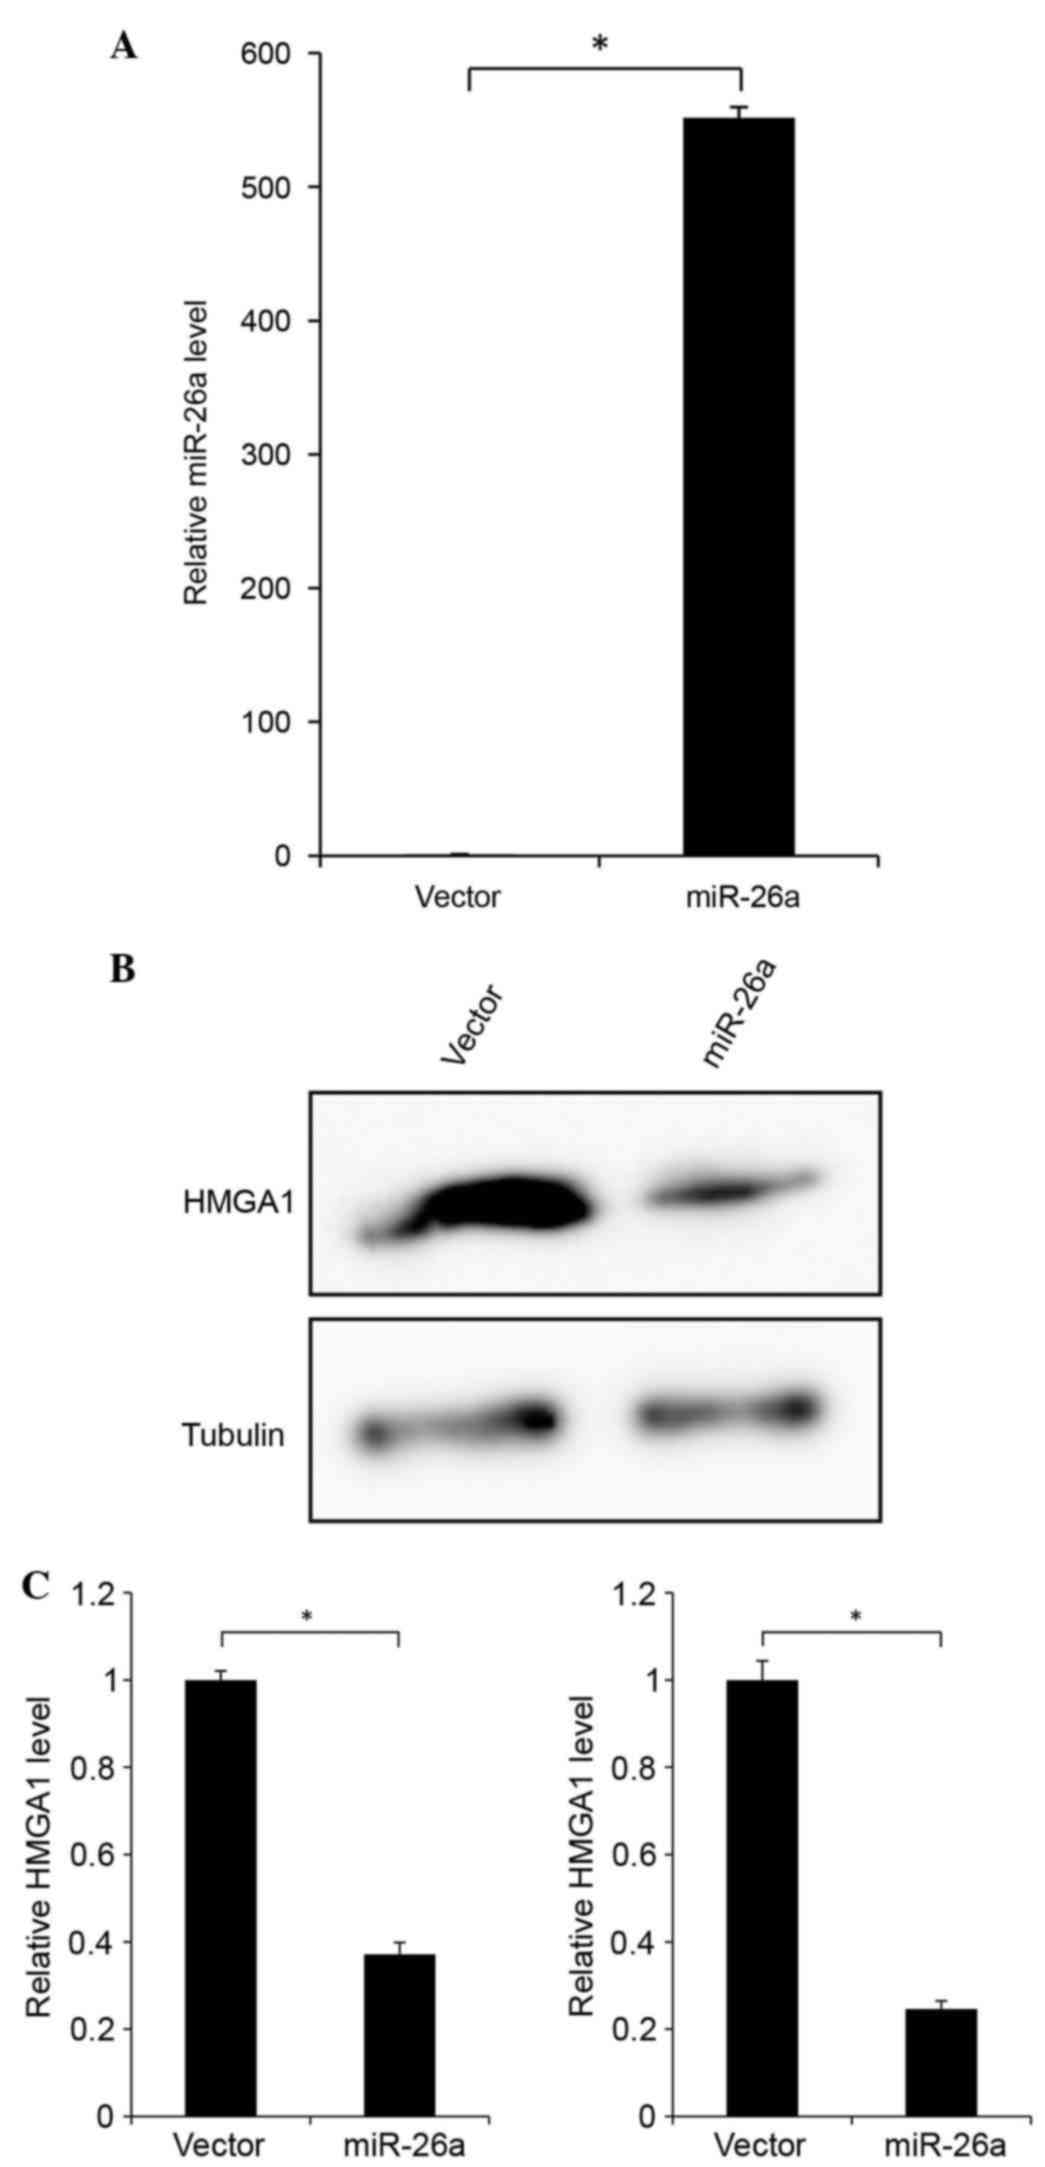
miR-26a silences the expression of
HMGA1 in the H1299 human lung adenocarcinoma cell line by degrading
HMGA1 mRNA
To determine the functionality of the negative
correlation between miR-26a and HMGA1, miR-26a was overexpressed in
the H1299 NSCLC cell line, which has low and high endogenous levels
of miR-26a and HMGA1, respectively. The expression level of miR-26a
was increased >500-fold following transfection with the miR-26a
expression vector (Fig. 2A). This
led to reduced protein levels of HMGA1, as shown in Fig. 2B. The mRNA level of HMGA1 also
decreased in response to the overexpression of miR-26a (Fig. 2C). Thus, miR-26a appeared to
suppress the protein expression of HMGA1 by reducing the mRNA level
of HMGA1.
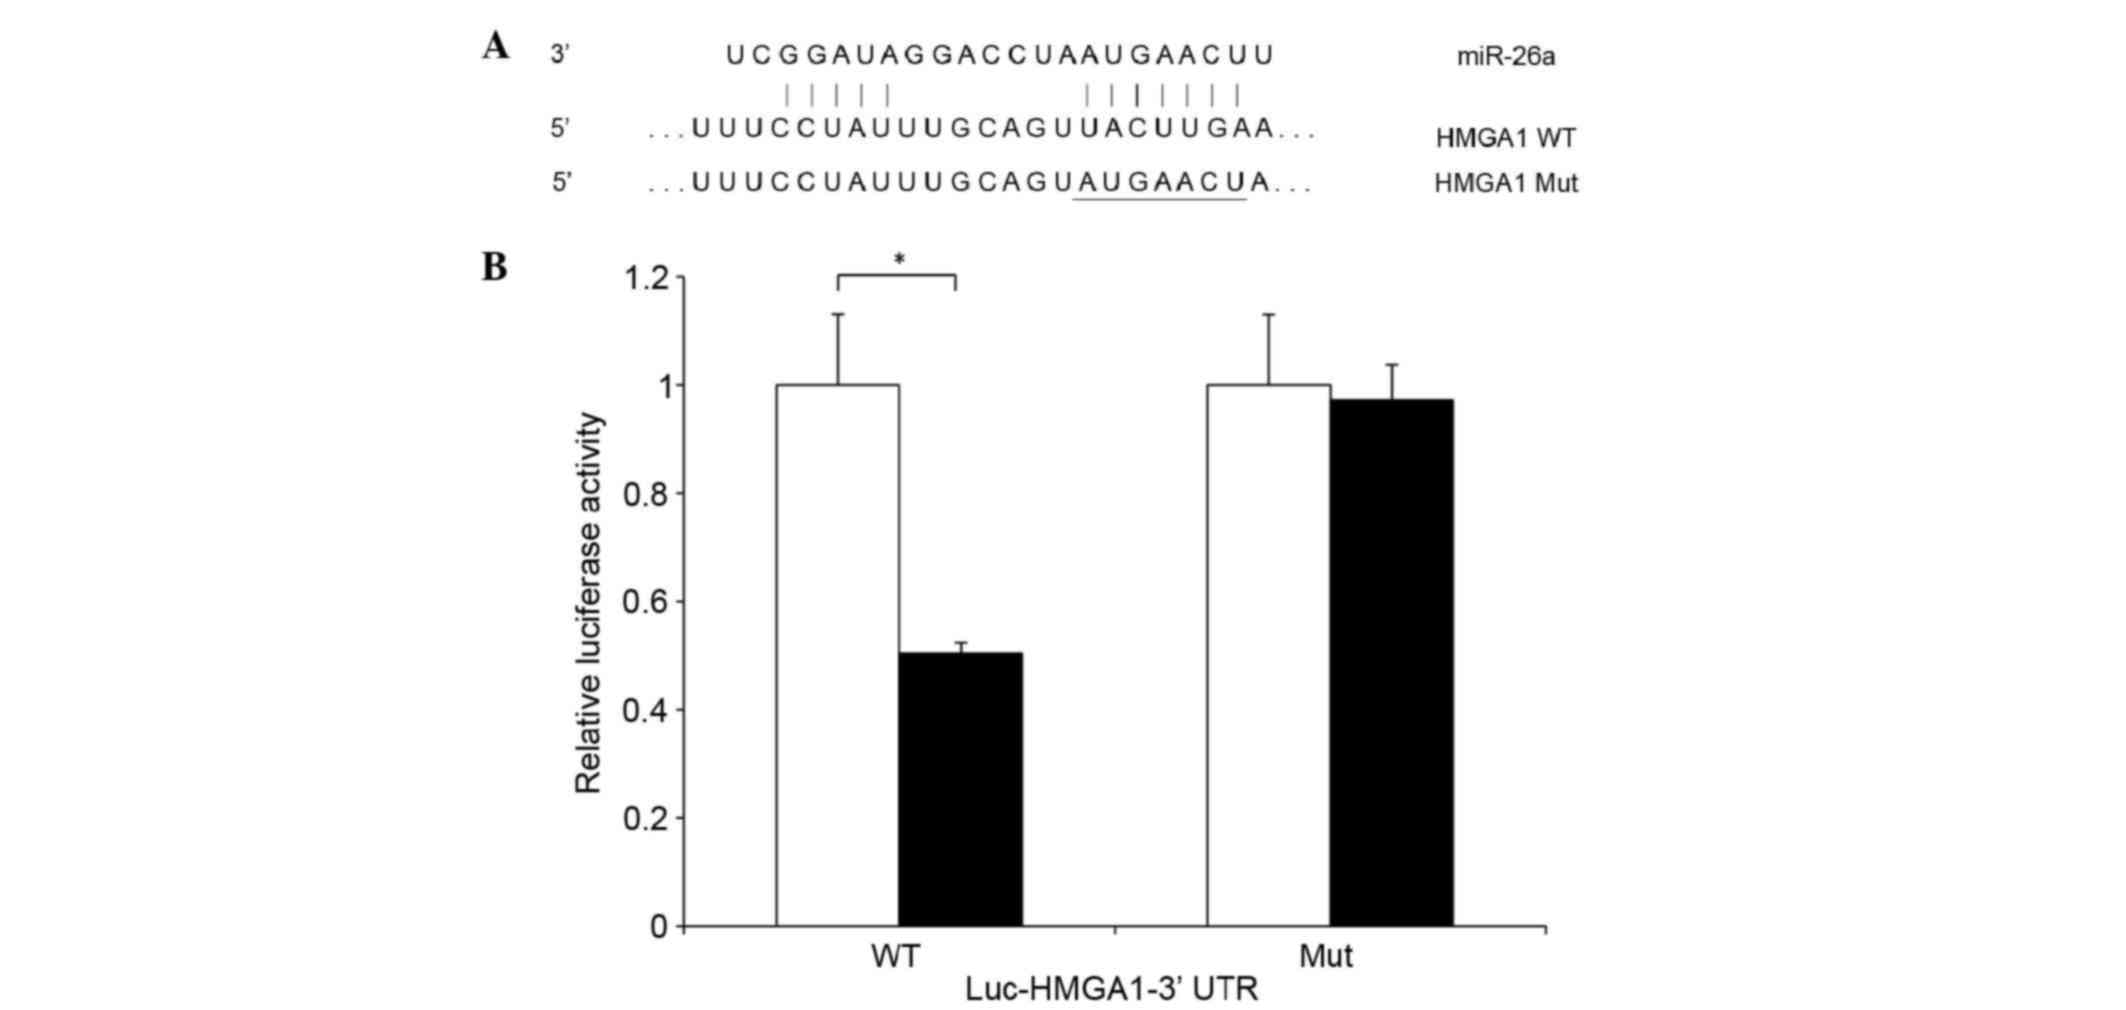
To examine whether HMGA1 is a direct target of
miR-26a, the present study performed a luciferase reporter assay
using a plasmid construct containing the 3′UTR of HMGA1 mRNA. The
3′UTR contained putative miR-26a binding sites, and a reporter
plasmid containing mutated miR-26a binding sites was used as a
control (Fig. 3A). These reporter
constructs, containing either miR-26a or a control expression
vector, were co-transfected into H1299 cells. The luciferase
activity of the reporter harboring the HMGA1 WT 3′UTR was reduced
by 50% following co-transfection with the miR-26a expression
vector. By contrast, the activity of the Mut construct was not
altered by co-transfection with miR-26a. These results suggested
that HMGA1 mRNA is a direct target of miR-26a (Fig. 3B).
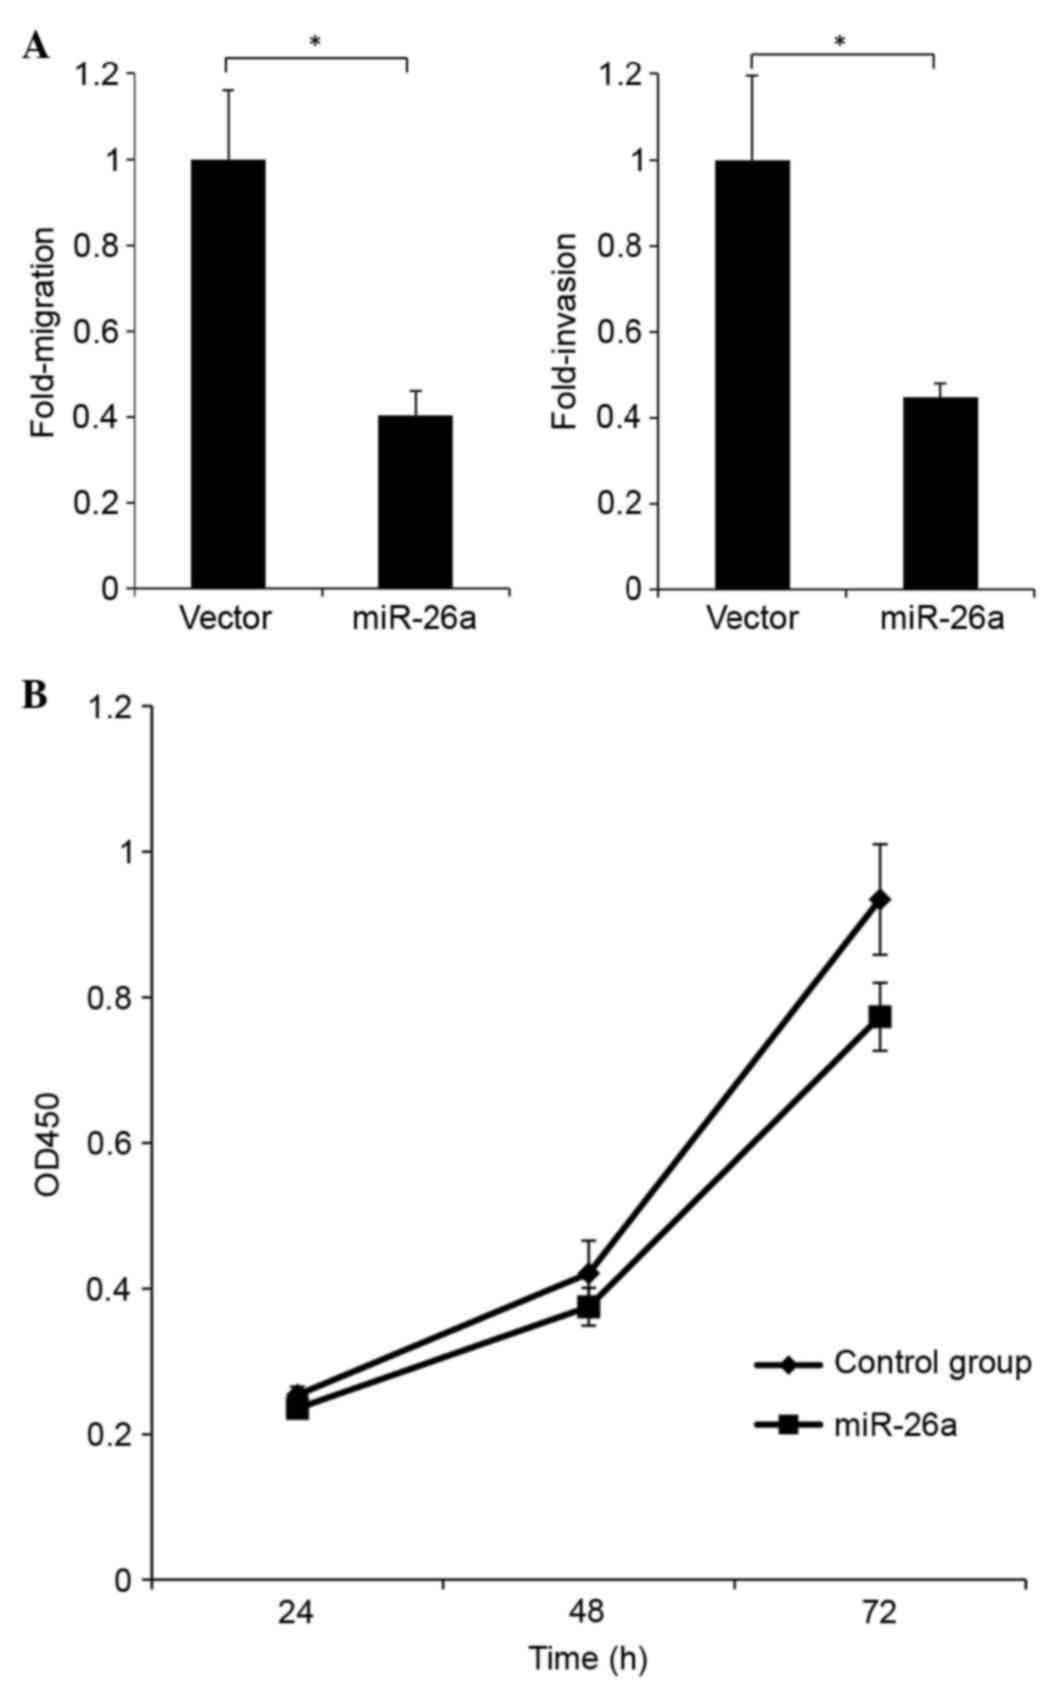
miR-26a represses migration, invasion
and growth in H1299 cells
To investigate the role of miR-26a in the capacities
of cells to metastasize and invade, miR-26a was overexpressed in
H1299 cells and the resulting cellular phenotype was evaluated. In
the cells overexpressing miR-26a, 60% reductions were observed in
the migration and invasion capacities, compared with the control
(Fig. 4A). These data suggested
that miR-26a suppressed migration and invasiveness in H1299 cells.
Furthermore, reduced cell growth was observed in response to the
overexpression of miR-26a, compared with the control, which
suggested that miR-26a repressed the proliferation of the H1299
cells (Fig. 4B).
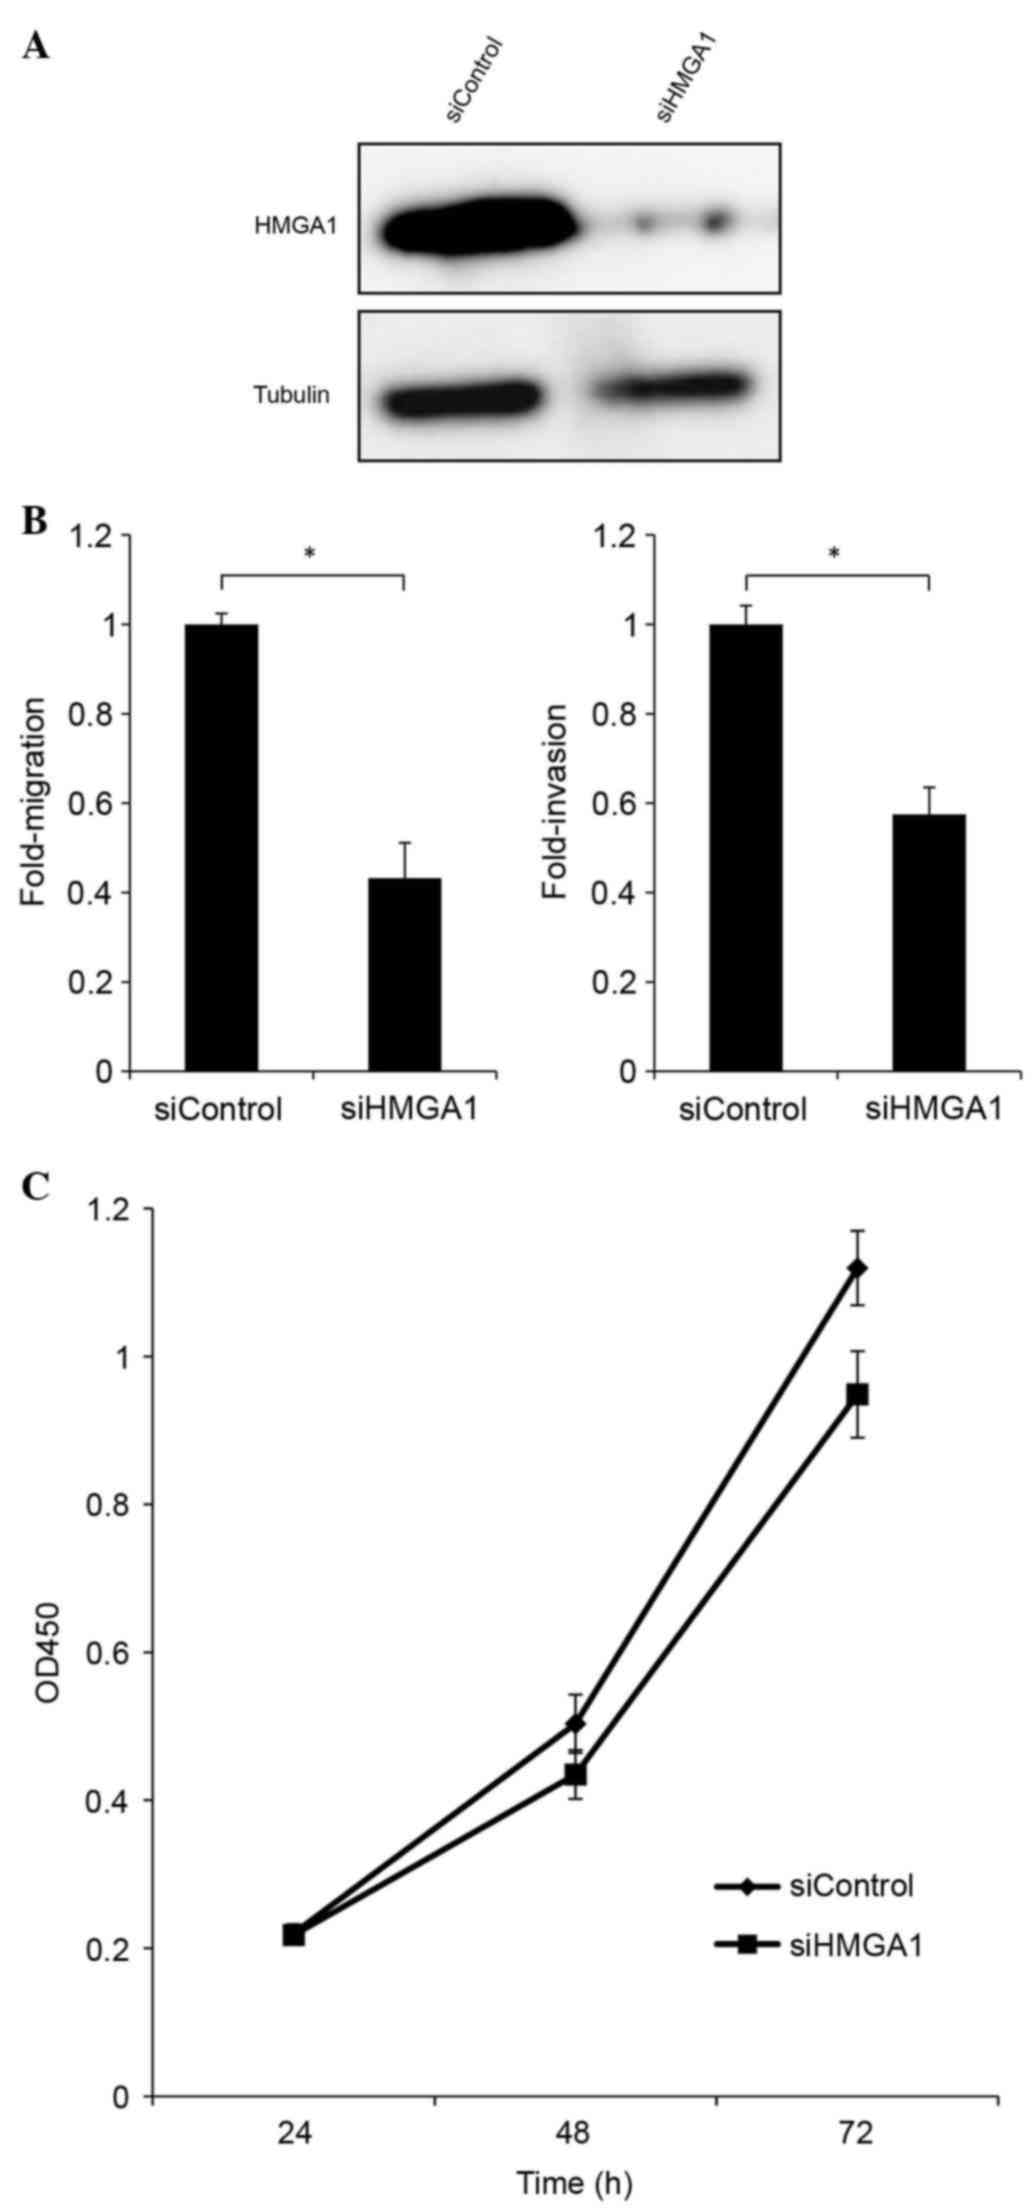
HMGA1 promotes cell migration,
invasion and cell growth in H1299 cells
To identify cellular phenotypes, which varied with
altered expression of HMGA1, cell invasion and migration activity
assays were performed. HMGA1 was knocked down using siRNA and the
protein expression of HMGA1 was successfully suppressed by 80%
(Fig. 5A). Upon HMGA1 knockdown, a
60% decrease in migration capacity and 50% decrease in invasiveness
were observed, compared with the control (Fig. 5B). These data indicated that a high
expression level of HMGA1 enhanced cell migration and invasiveness
in H1299 cells. Furthermore, a reduction in the rate of cell growth
was observed following HMGA1 knockdown, suggesting a positive role
of HMGA1 in the promotion of H1299 cell growth (Fig. 5C).
Discussion
In the present study, miRNA expression levels were
analyzed in 26 human lung adenocarcinoma cell lines, and these were
compared against mRNA data from our previous study (9). It was found that miR-26a exhibited
the most marked negative correlation with overall mRNA expression
levels. Furthermore, it was found that HMGA1 mRNA exhibited the
most marked negative correlation with miR-26a. Although miR-26a and
HMGA1 were selected from statistical analysis, further analyses
confirmed that these molecules affected the migration, invasion and
growth properties of a human adenocarcinoma cell line. These
results were consistent with previous studies, in which miR-26a was
identified as a tumor suppressor (14,15)
and HMGA1 as an oncoprotein (16)
in various cell types. Accordingly, a combined approach, which
evaluates cell lines using miRNA-seq may assist in identifying
miRNAs, which are biologically relevant in particular cancer cell
types.
After completion of the present study, it came to
our attention that RERF-LC-OK cells are mis-identified and are
actually Marcus human astrocytoma cells. The correlation
coefficients were recalculated using 25 cell lines without
RERF-LC-OK. The correlation coefficient between overall gene
expression and hsa-miR-26a-1 changed from −0.1105 to −0.1116 and
therefore remains the most negatively related among miRs. The
correlation coefficient between HMGA1 and hsa-miR-26a-1 changed
from −0.4927 to −0.4830, becoming the fifth negatively correlated
gene rather than the first, but still highly correlated. The
correlation coefficient between HMGA1 and hsa-miR-26a-2 changed
from −0.3758 to −0.3499.
Previous studies have reported the presence of other
miR-26a targets, including phosphatase and tensin homolog (PTEN)
and enhancer of zeste homolog 2 (EZH2), in lung cancer cells
(17,18). As PTEN is a known tumor suppressor
(19), it was suggested that
reduced expression of miR-26a in lung cancer cells suppresses the
carcinomatous phenotype. This is inconsistent with the experimental
data obtained in the present study, resulting from the
overexpression of miR-26a in a lung adenocarcinoma cell line. This
discrepancy may be attributable to the different cell lines used in
the assay. No marked correlation between miR-26a and the mRNA
expression of PTEN were found in the 26 human lung adenocarcinoma
cell lines assessed in the present study. By contrast, HMGA1
exhibited the most marked correlation with miR-26a. Furthermore,
the original expression level PTEN in the H1299 cells was ~50-fold
lower, compared with that of HMGA1. Therefore, the effects of the
overexpression of miR-26a on PTEN may not significantly affect the
cellular phenotype of this cell line.
In the present study, a negative correlation was
demonstrated between EZH2 mRNA, which is involved in cancer
progression (20), and miR-26a
(data not shown) in the 26 evaluated cell lines. However, it was
noted that the expression levels of EZH2 were also low in these
cell lines, being ~10-fold lower than the expression levels of
HMGA1 in the H1299 cells. This finding suggested that EZH2 may have
a minimal effect on the cellular phenotype, compared with
HMGA1.
Although several studies have demonstrated the
importance of the miR-26a/HMGA1 pair in bladder and breast cancer
(21,22), the present study is the first, to
the best of our knowledge, to describe the role of this pair in
lung adenocarcinoma, and the first to demonstrate a correlation
between the expression of miR-26a and HMGA1, as previous reports
focused on either the expression of miR-26a or HMGA1 in cancer cell
lines. The results of the present study supported those of previous
reports, which demonstrated downregulated expression of the
hsa-miR-26a-1 precursor (23) and
upregulated expression of HMGA1 (24) in lung cancer, compared with
corresponding normal tissues. Additionally, the present study
demonstrated that miR-26a may have directly silenced the expression
of HMGA1, and thus affected the migration and invasion potential of
H1299 lung adenocarcinoma cell lines through HMGA1. These findings
are consistent with those of a previous report, in which HMGA1
silencing reduced the metastatic potential of pancreatic
adenocarcinoma (25). The present
study also observed that a reduction in the expression of HMGA1 led
to a reduced growth rate in H1299 cells. The suppression of cell
growth in response to the suppressed expression of HMGA1 has also
been observed in breast cancer and osteogenic sarcoma (26).
Taken together, the low level of miR-26a in lung
adenocarcinoma cell lines may result in a high level of HMGA1, thus
supporting cancer progression. It is possible that, in the future,
restoration of the expression of miR-26a may offer a novel strategy
for the treatment of lung adenocarcinoma.
Acknowledgements
This study was supported by a Grant-in-Aid for
Scientific Research in the Priority Area ‘Genome Science’ (grant
no. 221S0002) from the Ministry of Education, Culture, Sports,
Science and Technology of Japan. This manuscript was proofread by
the Enago English language editing service (https://www.enago.jp/).
References
|
1
|
Pirozynski M: 100 years of lung cancer.
Respir Med. 100:2073–2084. 2006. View Article : Google Scholar : PubMed/NCBI
|
|
2
|
D'Addario G, Früh M, Reck M, Baumann P,
Klepetko W and Felip E: ESMO Guidelines Working Group: Metastatic
non-small-cell lung cancer: ESMO clinical practice guidelines for
diagnosis, treatment and follow-up. Ann Oncol. 21 Suppl
5:v116–v119. 2010. View Article : Google Scholar : PubMed/NCBI
|
|
3
|
Saintigny P and Burger JA: Recent advances
in non-small cell lung cancer biology and clinical management.
Discov Med. 13:287–297. 2012.PubMed/NCBI
|
|
4
|
Liloglou T, Bediaga NG, Brown BR, Field JK
and Davies MP: Epigenetic biomarkers in lung cancer. Cancer Lett.
342:200–212. 2014. View Article : Google Scholar : PubMed/NCBI
|
|
5
|
Zhang W, Dahlberg JE and Tam W: MicroRNAs
in tumorigenesis: A primer. Am J Pathol. 171:728–738. 2007.
View Article : Google Scholar : PubMed/NCBI
|
|
6
|
Wu F, Yang Z and Li G: Role of specific
microRNAs for endothelial function and angiogenesis. Biochem
Biophysi Res Comm. 386:549–553. 2009. View Article : Google Scholar
|
|
7
|
He L and Hannon GJ: MicroRNAs: Small RNAs
with a big role in gene regulation. Nat Rev Genet. 5:522–531. 2004.
View Article : Google Scholar : PubMed/NCBI
|
|
8
|
Wang V and Wu W: MicroRNA-based
therapeutics for cancer. BioDrugs. 23:15–23. 2009. View Article : Google Scholar : PubMed/NCBI
|
|
9
|
Suzuki A, Makinoshima H, Wakaguri H, Esumi
H, Sugano S, Kohno T, Tsuchihara K and Suzuki Y: Aberrant
transcriptional regulations in cancers: Genome, transcriptome and
epigenome analysis of lung adenocarcinoma cell lines. Nucleic Acids
Res. 42:13557–13572. 2014. View Article : Google Scholar : PubMed/NCBI
|
|
10
|
Feng Z, Zhang C, Wu R and Hu W: Tumor
suppressor p53 meets microRNAs. J Mol Cell Biol. 3:44–50. 2011.
View Article : Google Scholar : PubMed/NCBI
|
|
11
|
Gulino R, Forte S, Parenti R, Memeo L and
Gulisano M: MicroRNA and pediatric tumors: Future perspectives.
Acta Histochem. 117:339–354. 2015. View Article : Google Scholar : PubMed/NCBI
|
|
12
|
Livak KJ and Schmittgen TD: Analysis of
relative gene expression data using real-time quantitative PCR and
the 2(−Delta Delta C(T)) Method. Methods. 25:402–408. 2001.
View Article : Google Scholar : PubMed/NCBI
|
|
13
|
Benecke AG and Eilebrecht S: RNA-Mediated
regulation of HMGA1 function. Biomolecules. 5:943–957. 2015.
View Article : Google Scholar : PubMed/NCBI
|
|
14
|
Zeitels LR, Acharya A, Shi G, Chivukula D,
Chivukula RR, Anandam JL, Abdelnaby AA, Balch GC, Mansour JC, Yopp
AC, et al: Tumor suppression by miR-26 overrides potential
oncogenic activity in intestinal tumorigenesis. Genes Dev.
28:2585–2590. 2014. View Article : Google Scholar : PubMed/NCBI
|
|
15
|
Zhao S, Ye X, Xiao L, Lian X, Feng Y, Li F
and Li L: MiR-26a inhibits prostate cancer progression by
repression of Wnt5a. Tumour Biol. 35:9725–9733. 2014. View Article : Google Scholar : PubMed/NCBI
|
|
16
|
Pierantoni GM, Rinaldo C, Esposito F,
Mottolese M, Soddu S and Fusco A: High mobility group A1 (HMGA1)
proteins interact with p53 and inhibit its apoptotic activity. Cell
Death Differ. 13:1554–1563. 2006. View Article : Google Scholar : PubMed/NCBI
|
|
17
|
Liu B, Wu X, Liu B, Wang C, Liu Y, Zhou Q
and Xu K: MiR-26a enhances metastasis potential of lung cancer
cells via AKT pathway by targeting PTEN. Biochim Biophysica Acta.
1822:1692–1704. 2012. View Article : Google Scholar
|
|
18
|
Dang X, Ma A, Yang L, Hu H, Zhu B, Shang
D, Chen T and Luo Y: MicroRNA-26a regulates tumorigenic properties
of EZH2 in human lung carcinoma cells. Cancer Genet. 205:113–123.
2012. View Article : Google Scholar : PubMed/NCBI
|
|
19
|
Li J, Yen C, Liaw D, Podsypanina K, Bose
S, Wang SI, Puc J, Miliaresis C, Rodgers L, McCombie R, et al:
PTEN, a putative protein tyrosine phosphatase gene mutated in human
brain, breast, and prostate cancer. Science. 275:1943–1947. 1997.
View Article : Google Scholar : PubMed/NCBI
|
|
20
|
Varambally S, Dhanasekaran SM, Zhou M,
Barrette TR, Kumar-Sinha C, Sanda MG, Ghosh D, Pienta KJ, Sewalt
RG, Otte AP, et al: The polycomb group protein EZH2 is involved in
progression of prostate cancer. Nature. 419:624–629. 2002.
View Article : Google Scholar : PubMed/NCBI
|
|
21
|
Lin Y, Chen H, Hu Z, Mao Y, Xu X, Zhu Y,
Xu X, Wu J, Li S, Mao Q, et al: miR-26a inhibits proliferation and
motility in bladder cancer by targeting HMGA1. FEBS Lett.
587:2467–2473. 2013. View Article : Google Scholar : PubMed/NCBI
|
|
22
|
Zhao XX, Yuan QZ, Mu DP, Sun DW, Bo QA,
Pan GZ, Li GQ, Cui T, Ding PP, You FP, et al: MicroRNA-26a inhibits
proliferation by targeting high mobility group AT-hook 1 in breast
cancer. Int J Clin Exp Pathol. 8:368–373. 2015.PubMed/NCBI
|
|
23
|
Yanaihara N, Caplen N, Bowman E, Seike M,
Kumamoto K, Yi M, Stephens RM, Okamoto A, Yokota J, Tanaka T, et
al: Unique microRNA molecular profiles in lung cancer diagnosis and
prognosis. Cancer Cell. 9:189–198. 2006. View Article : Google Scholar : PubMed/NCBI
|
|
24
|
Kettunen E, Anttila S, Seppänen JK,
Karjalainen A, Edgren H, Lindström I, Salovaara R, Nissén AM, Salo
J, Mattson K, et al: Differentially expressed genes in nonsmall
cell lung cancer: Expression profiling of cancer-related genes in
squamous cell lung cancer. Cancer Genet Cytogenet. 149:98–106.
2004. View Article : Google Scholar : PubMed/NCBI
|
|
25
|
Liau SS, Jazag A and Whang EE: HMGA1 is a
determinant of cellular invasiveness and in vivo metastatic
potential in pancreatic adenocarcinoma. Cancer Res. 66:11613–11622.
2006. View Article : Google Scholar : PubMed/NCBI
|
|
26
|
Yuan S, Pan Q, Fu C and Bi Z: Silencing of
HMGA1 expression by RNA interference suppresses growth of
osteogenic sarcoma. Mol Cell Biochem. 355:281–287. 2011. View Article : Google Scholar : PubMed/NCBI
|