Introduction
In the last decade, obesity has become increasingly
prevalent in industrialized countries and has gradually become
common in developing countries (1). As the incidence of obesity has
increased, the risks for obesity-associated diseases, such as
non-alcoholic fatty liver disease (NAFLD), have increased. NAFLD is
considered to be the most common cause of chronic liver disease and
is associated with obesity. The development of NAFLD is associated
with type 2 diabetes, with >90% of obese patients with type 2
diabetes additionally diagnosed with NAFLD (2). Insulin resistance is thought to be
the most common underlying cause of type 2 diabetes and NAFLD
pathogenesis (3). Insulin
resistance is characterized by the impaired ability of insulin to
inhibit endogenous glucose production. In addition,
insulin-mediated inhibition of lipolysis is reduced, leading to
increased lipolysis of peripheral adipose tissues and increased
levels of free fatty acids (FFA) in the peripheral blood, which
contributes to the elevated transport of FFA to the liver. Insulin
resistance-induced hyperinsulinemia and hyperglycemia facilitate
the abundant accumulation of lipids in hepatocytes by increasing
de novo lipogenesis and inhibiting fatty acid oxidation and
hepatic lipid output, which leads to hepatic steatosis (4).
Insulin resistance is defined as reduced insulin
sensitivity in target organs, which include the liver and muscle
(5). The liver is the primary
organ for the maintenance of blood glucose homeostasis. Insulin
decreases blood glucose levels by reducing hepatic gluconeogenesis
and increasing hepatic glycogenesis and glucose uptake; this
progress is dependent on the Akt/glycogen synthase kinase (GSK)
signaling pathway (6,7). Insulin binds to the insulin receptor
and stimulates insulin receptor-linked tyrosine kinase
phosphorylation, which further phosphorylates insulin receptor
substrate 1 (IRS1). Activated IRS1 initiates the phosphorylation of
a number of downstream signaling molecules, leading to further
activation of Akt. Activated Akt inactivates GSK3β by
phosphorylating Ser9, which results in activation of glycogen
synthase (GS). This subsequently promotes increased hepatic
glycogenesis (7). GSK3β, a
serine/threonine protein kinase located in the cytoplasm, is a
negative regulator of the insulin-signaling pathway that decreases
hepatic glycogenesis via the phosphorylation and inactivation of GS
(8). A previous study reported
that hepatic GSK3β activity is elevated in animal models of type 2
diabetes or insulin resistance, which in turn, decreases hepatic
glycogenesis by suppressing GS activity (9). Treatment with a GSK3β inhibitor
improved hepatic glycogenesis by increasing insulin sensitivity
(9). Therefore, inhibition of
GSK3β activity may be one of the more efficient methods for
improving insulin resistance.
Somatostatin (SST) is a neurohormone with extensive
biological activities, including decreasing insulin and glucagon
secretion, inhibiting gastric emptying and gastric acid secretion,
and reducing intestinal absorption of nutrients (10). Octreotide, an SST analogue, has a
longer half-life and demonstrates more robust effects. A previous
study indicated that octreotide decreases body weight, reduces
insulin hypersecretion and improves metabolic abnormalities in mice
with high fat diet (HFD)-induced obesity (11). However, whether octreotide exerts a
positive effect on hepatic glycogen synthesis in rats with
HFD-induced obesity remains unknown. The present study investigated
the effects and the underlying mechanism of octreotide on hepatic
glycogenesis in rats with HFD-induced obesity.
Materials and methods
Animals and treatment
The animal experiments were approved by the
Institutional Animal Care and Use Committee of Sichuan University
(Chengdu, China). A total of 40 healthy male Sprague-Dawley (SD)
rats (age, 3 weeks; weight, 40–60 g) were purchased from the
Experimental Animal Centre of Sichuan University and raised in the
Experimental Animal Centre of West China Hospital, Sichuan
University. All rats were caged (n=4 per cage) under standard
conditions with controlled humidity (45 to 65%) and temperature (20
to 25°C), 12/12 h light/dark cycles and access to food and water
ad libitum. Rats were maintained for 7 days on a standard
diet before they were divided into the normal diet group (320
kcal/100 g body weight, 4.65% calories derived from fat; n=12) and
the HFD group (500 kcal/100 g body weight, 60% calories derived
from fat; n=28). The feed for these diets were purchased from
Trophic Animal Feed High-Tech Co., Ltd. (Jiangsu, China). Body
weight, body length and tail length were measured every week for 24
weeks, and Lee's index was calculated using the following formula:
[Body weight (g)1/3 × 1,000]/body length (cm) (12). Following 24 weeks, rats with a mean
body weight that reached ≥1.4-fold higher than that of controls
were selected for further experiments. A total of 24 eligible rats
were separated from the HFD group at random and divided into the
HFD-control group (n=12) and the octreotide-treated group (n=12).
These groups were continuously fed a HFD for 8 days, and rats in
the octreotide-treated group were subcutaneously injected with
octreotide (Chengdu Tiantai Mountain Pharmaceutical Co., Ltd.,
Chengdu, China) at a dose of 40 µg/kg body weight every 12 h for 8
days. During the octreotide administration period, body weight and
food intake were monitored daily. At the end of the experiment, all
rats underwent a 12-h starvation period and were sacrificed with 2%
sodium pentobarbital (45 mg/kg body weight; Sigma-Aldrich; Merck
KGaA, Darmstadt, Germany) administered intraperitoneally. Following
sacrifice, blood samples were collected and centrifuged at 860 × g
for 15 min at 4°C, and the supernatant was stored at −80°C for
further analysis. The liver tissues were isolated, and one sample
was rapidly frozen in liquid nitrogen prior to storage at −80°C for
total RNA and protein extraction or Oil Red O staining. A second
sample was fixed in 4% paraformaldehyde for 48 h at room
temperature for histological examination. Abdominal fat was also
collected and weighed.
Intraperitoneal glucose tolerance test
(ipGTT) and insulin tolerance test (ipITT)
Following fasting for 12 h, rats were subjected to
the ipGTT and ipITT assays by intraperitoneal administration of
glucose at 2.0 g/kg body weight or insulin at 7.5 U/kg body weight,
respectively. Blood samples were drawn from the tail vein at 0, 15,
30, 60 and 120 min post-injection, and the glucose levels were
measured using an Accu-Chek Active Glucometer (ACCU-CHEK Active;
Roche Applied Science, Penzberg, Germany).
GraphPad Prism software (version 5.0; GraphPad
Software, Inc., La Jolla, CA, USA) was used to calculate the area
under the curve (AUC) of ipGTT and ipITT, and the results are
expressed as the mean ± standard deviation.
Plasma metabolic parameters
Fasting plasma glucose (FPG), serum triglyceride
(TG), total cholesterol (TC), alanine aminotransferase (ALT) and
aspartate aminotransferase (AST) levels were determined using the
following reagent kits according to the manufacturer's protocol:
GLU assay kit (cat. no. A031), TG assay kit (cat. no. A027), T-CHO
assay kit (cat. no. A030), GPT assay kit (cat. no. A001) and a GOT
assay kit (cat. no. A002), obtained from Changchun Huili
Biotechnology Co., Ltd., Changchun, China. FFA levels were
determined using a Non-Esterified Free Fatty Acids assay kit (cat.
no. FA115; Randox Laboratories, Ltd., Crumlin, UK) and serum
insulin levels were detected using a rat insulin enzyme-linked
immunosorbent assay kit (cat. no. EZRMI-13K; EMD Millipore,
Billerica, MA, USA), according to the manufacturer's instructions.
The homeostatic model assessment (HOMA) index, which is an
assessment of insulin sensitivity, was calculated to assess the
insulin sensitivity of obese rats using the following equation:
[FPG (mmol/l) × fasting serum insulin (µU/ml)]/22.5.
Measurement of liver TG and FFA
content
To assess hepatic TG levels, ~50 mg liver tissue
from rats in all experimental groups was homogenized in a 2:1
chloroform-methanol mixture (v/v). The homogenized solution was
mixed on a shaker for 20 min at room temperature, centrifuged at
310 × g for 10 min at 4°C, and the supernatant was collected. A
total of 0.2x the supernatant volume of NaCl solution (0.9%) was
added to the supernatant. The mixture was then centrifuged at 550 ×
g for 20 min at 4°C, and the resulting supernatant was collected
and dried under a stream of nitrogen gas. To the residue, 0.5 ml
Triton X-100 solution (3%) was added to re-dissolve the residue.
The TG level of the 0.5 ml Triton X-100 solution was measured using
a TG assay kit (cat. no. A027; Changchun Huili Biotechnology Co.,
Ltd.).
In order to determine hepatic FFA levels, ~50 mg
liver tissue was homogenized in phosphate-buffered saline (PBS),
centrifuged at 860 × g for 20 min at 4°C and the supernatant was
collected. The protein concentrations of the supernatant were
measured using a bicinchoninic (BCA) Protein assay kit (Pierce;
Thermo Fisher Scientific, Inc., Waltham, MA, USA), and the hepatic
FFA concentration was detected using a Nonesterified Free Fatty
Acid assay kit (cat. no. FA115; Randox Laboratories, Ltd.)
according to the manufacturer's instructions. The FFA values are
presented as mM/g protein.
Measurement of liver glycogen
content
In order to assess hepatic glycogen content, ~50 mg
liver tissue was homogenized in 500 µl ice-cold PBS. The
homogenates were centrifuged at 14,000 × g for 10 min at 4°C, and
the supernatants were collected for analysis using glycogen content
assays. The glycogen concentration in the liver was evaluated using
an EnzyChrom™ Glycogen assay kit (BioAssay Systems, Hayward, CA,
USA) according to the manufacturer's instructions. Glycogen
concentration was normalized to the protein concentration of liver
tissues.
Analysis of liver histology and Oil
Red O staining
Formalin-fixed liver tissues were embedded with
paraffin and sectioned (3-µm). Sections subsequently underwent
xylene gradient dewaxing twice for 10 min and gradient dehydration
with 100% alcohol for 3 min, 100% alcohol for 3 min, 95% alcohol
for 3 min and 90% alcohol for 3 min. Sections were rinsed with tap
water three times and immersed in tap water for 15 min. Sections
were then stained with 0.2% hematoxylin and eosin (H&E) for ~5
min at room temperature. White fat vacuoles and steatosis were
visualized using a light microscope (Olympus BX41TF Microscope;
Olympus Corporation, Tokyo, Japan), and images were captured at
×400 magnification. Evaluation of NAFLD was performed described
previously (13).
Frozen liver tissue was embedded with Tissue-Tek
O.C.T. Compound (Sakura Finetek USA, Inc., Torrance, CA, USA), and
cryosections (5-µm in thickness) of liver tissue were prepared. The
sections were then stained for 30 min in 0.3% freshly diluted Oil
Red O solution at 37°C, followed by counterstaining with 0.2%
H&E at 37°C for 30 sec following washing with tap water. Images
of the sections were collected using a light microscope (Olympus
Corporation) from five different fields at ×400 magnification.
Image Pro Plus software (version 6.0; Media Cybernetics, Inc.,
Rockville, MD, USA) was used to analyze the integrated optical
density (IOD) of the Oil Red O-stained areas. Quantitative analysis
of liver tissue photomicrographs was performed as described
previously (14).
HepG2 cell culture and treatment
The human hepatoblastoma HepG2 cell line, which was
originally thought to be derived from a hepatocellular carcinoma,
however was later determined to be derived from a human
hepatoblastoma (15), was obtained
from CoBioer Biosciences Co., Ltd. (Nanjing, China). HepG2 cells
were cultured in RPMI-1640 medium (Hyclone; GE Healthcare Life
Sciences, Logan, UT, USA) with 10% fetal bovine serum (Biological
Industries Israel, Beit Haemek Ltd., Beit Haemek, Israel), 100 U/ml
penicillin and 100 µg/ml streptomycin (Hyclone; GE Healthcare Life
Sciences). The cells were maintained at 37°C under humidified
conditions with 95% O2 and 5% CO2. When cell
confluence had reached 80%, cells were starved of glucose overnight
in serum-free or 0.5% low-concentration fetal bovine serum
(Biological Industries Israel, Beit Haemek Ltd., Beit Haemek,
Israel) RPMI-1640 medium and then divided into the following 3
groups: The standard control group, where cells were incubated with
0.5% bovine serum albumin (BSA; Sigma-Aldrich; Merck KGaA) for 24
h; the palmitate (PA)-treated group, where cells were cultured with
125 µM PA (Sigma-Aldrich; Merck KGaA) plus 0.5% BSA for 24 h; and
the PA plus octreotide-treated group, where cells were cultured
with 125 µM PA plus 0.5% BSA for 24 h prior to treatment with
10−8 mmol/l octreotide for 6 h. Subsequently, cells in
all groups were incubated with 100 µM insulin for 20 min prior to
cell collection. A KeyGEN Whole Cell assay kit (Nanjing KeyGen
Biotech Co., Ltd., Nanjing, China) was used to isolate total
protein. TRIzol reagent (Takara Biotechnology Co., Ltd., Dalian,
China) was used to extract the total mRNA, according to the
manufacturer's protocol.
Oil Red O staining of HepG2 cells
Cells (1×10⁶) were washed in PBS three
times and then fixed for 30 min with 4% formaldehyde solution at
room temperature. Following two washes with 60% isopropyl alcohol,
the cells were stained with a working solution of 0.3% Oil Red O
for 30 min at 37°C. The reagent was then removed, cells were washed
several times with tap water and cell nuclei were counterstained
with 0.2% hematoxylin for ~20 sec at room temperature.
Photomicrographs of stained cells were captured using a light
microscope (Olympus Corporation) at ×400 magnification and the
results were analyzed using the aforementioned methods.
RNA isolation and reverse
transcription-quantitative polymerase chain reaction (RT-qPCR)
TRIzol reagent was used to extract total RNA from
liver tissues or HepG2 cells, according to the manufacturer's
instructions. RNA (2 µg) was reverse transcribed to cDNA using the
RevertAid First Strand cDNA Synthesis kit (Thermo Fisher
Scientific, Inc.) according to the manufacturer's instructions.
qPCR was performed using 2X SYBR-Green Master Mix (Biotool, LLC,
Houston, TX, USA) and the primers listed in Table I (TSINGKE Biological Technology,
Co., Ltd., Beijing, China). Samples were analyzed in triplicate and
the thermal cycling parameters were as follows: 95°C for 5 min,
followed by 40 cycles of 95°C for 15 sec and 60°C for 30 sec. The
CFX96 Real-Time PCR Detection System (Bio-Rad Laboratories,
Hercules, CA, USA) was used for qPCR analysis. Target gene mRNA
expression levels were normalized to β-actin mRNA in the same
sample. The relative method of quantification was applied to
calculate ΔΔCq values in each sample, and the results
are expressed as 2−ΔΔCq (16).
 | Table I.Primer sequences used for reverse
transcription-quantitative polymerase chain reaction analysis. |
Table I.
Primer sequences used for reverse
transcription-quantitative polymerase chain reaction analysis.
| Gene (organism) | NCBI reference
sequence | Forward sequence
(5′-3′) | Reverse sequence
(5′-3′) | Product size
(bp) |
|---|
| β-actin (rat) | NM_031144 |
CGAGTACAACCTTCTTGCAGC |
CCTTCTGACCCATACCCACC | 209 |
| GS (rat) | NM_013089 |
AAGAGTTTGTCCGAGGCTGTC |
ACCAGAGAGGTTCGTAGTCACAC | 119 |
| β-actin
(human) | NM_001101 |
CACAGAGCCTCGCCTTT |
GGTGCCAGATTTTCTCCAT | 318 |
| GS (human) | NM_002103 |
GCCTTTCCAGAGCACTTCAC |
CTCCTCGTCCTCATCGTAGC | 195 |
Western blotting
Total protein was isolated from liver tissues or
HepG2 cells using a KeyGEN Whole Cell assay kit (Nanjing KeyGen
Biotech Co., Ltd.), and the Enhanced BCA Protein assay kit (Pierce;
Thermo Fisher Scientific, Inc.) was used to measure protein
concentrations, according to the manufacturer's instructions.
Protein samples (40 µg) from each group were electrophoresed on 10%
SDS-PAGE gels and then blotted onto polyvinylidene difluoride
membranes (EMD Millipore). The membranes were blocked with 5%
non-fat milk in Tris-buffered saline-Tween-20 (TBST; 0.1%) at room
temperature for 2 h, prior to incubation with anti-phosphorylated
(p)-Akt rabbit monoclonal antibody (mAb; cat. no. 4060; dilution,
1:1,000; Cell Signaling Technology, Inc., Danvers, MA, USA),
anti-p-GSK3β rabbit mAb (cat. no. 9323; dilution, 1:1,000; Cell
Signaling Technology, Inc.), anti-Akt rabbit polyclonal antibody
(cat. no. STJ91543; dilution, 1:500; St. John's Laboratory Ltd.,
London, UK), anti-GSK3β rabbit polyclonal antibody (cat. no.
STJ93448; dilution, 1:500; St John's Laboratory Ltd.), anti-β-actin
mouse mAb (cat. no. EM21002; dilution, 1:5,000; Epitomics,
Burlingame, CA, USA) at 4°C overnight. This was followed by
incubation with a homologous horseradish peroxidase-conjugated
secondary antibody (cat. no. ZB2301; dilution, 1:10,000; Beijing
Zhongshan Golden Bridge Biotechnology Co., Ltd., Beijing, China)
for 2 h at room temperature following washing with TBST. Protein
bands were immunodetected using enhanced chemiluminescence reagent
(Beijing Zhongshan Golden Bridge Biotechnology Co., Ltd., Beijing,
China), according to the manufacturer's instructions. The intensity
of the bands was analyzed using Quantity One software (version
4.6.2; Bio-Rad Laboratories). The expression levels of all proteins
in each sample were normalized to β-actin levels, and the
experiment was repeated three times.
Statistical analysis
Data were analyzed using SPSS software (version
20.0; IBM SPSS, Armonk, NY, USA) and the results are presented as
the mean ± standard deviation. One-way analysis of variance
followed by the Dunnett's test was performed to evaluate the
significant differences among groups. The homogeneity of variances
(Levene's test) was necessary, if there is heterogeneity of
variance, that is P<0.05, then the method of the variable
conversion such as Lg10 is required to meet the homogeneity of
variance (P>0.05). P<0.05 was considered to indicate
statistically significant differences.
Results
Body weight, Lee's index, liver
weight, abdominal fat and abdominal fat index
At the end of the experiment, the body weight of
rats in the HFD group had increased by 28.5% when compared with the
control group (P<0.01; Table
II). Lee's index, which provides an estimate of obesity in
adult rats, was also increased by 5.0% in the HFD group when
compared with the control group (P<0.01; Table II). The liver weight and quantity
of abdominal fat in obese rats was higher than that of the control
rats (both P<0.01; Table II),
and the abdominal fat index in the obese rats was higher in the HFD
group when compared with the control group (P<0.01; Table II). Apart from Lee's index values,
octreotide treatment significantly reduced these parameters in rats
fed on a HFD (Table II).
| Table II.Body weight, Lee's index, liver
weight, abdominal fat and abdominal fat index of rats in the three
experimental groups. |
Table II.
Body weight, Lee's index, liver
weight, abdominal fat and abdominal fat index of rats in the three
experimental groups.
| Parameter | Control group
(n=12) | HFD group
(n=12) | Octreotide-treated
group (n=12) |
|---|
| Body weight
(g) | 472.08±30.61 |
606.58±57.11aa |
534.42±49.15bb |
| Lee's index | 306.82±4.96 |
322.30±8.82aa |
315.32±12.28a |
| Liver weight
(g) | 12.16±1.64 |
14.88±1.41aa |
12.46±1.05bb |
| Abdominal fat
(g) | 10.36±4.72 |
28.87±8.76aa |
20.02±4.83bb |
| Abdominal fat index
(%) | 2.16±0.88 |
4.72±1.23aa |
3.75±0.81b |
Serum lipids, ALT, AST, insulin
levels, plasma glucose levels and HOMA index values
When compared with the control group, plasma glucose
levels in rats from the HFD group were significantly elevated
(P<0.01; Table III).
Following administration of octreotide, the plasma glucose levels
were significantly lower compared with those observed in the obese
rats of the HFD group (P<0.01; Table III). Rats in the HFD group
exhibited the highest serum insulin, TG, TC, FFA, ALT and AST
levels among the three groups (Table
III). Octreotide intervention significantly decreased the serum
insulin concentration (P<0.05); however, there was no marked
reduction in serum TG, TC, FFA, ALT and AST levels (P>0.05). The
HOMA index, which provides an estimation of insulin resistance,
significantly increased in rats from the HFD group when compared
with the control rats (P<0.01), and was significantly inhibited
by octreotide treatment (P<0.01; Table III).
| Table III.Blood biochemistry parameters and
HOMA indexes in the three experimental groups. |
Table III.
Blood biochemistry parameters and
HOMA indexes in the three experimental groups.
| Parameter | Control group
(n=12) | HFD group
(n=12) | Octreotide-treated
group (n=12) |
|---|
| Plasma glucose
(mmol/l) | 4.60±1.17 |
6.26±1.55aa |
4.75±1.60bb |
| Serum insulin
(mmol/l) | 118.33±37.08 |
157.68±43.55a |
108.85±66.36b |
| Serum FFA
(mmol/l) | 225.36±88.20 |
372.12±125.94aa | 311.11±71.82 |
| Serum TG
(mmol/l) | 0.39±0.17 |
0.61±0.23a | 0.50±0.14 |
| Serum TC
(mmol/l) | 1.68±0.44 |
2.54±0.62aa | 2.31±0.44 |
| Serum ALT
(mmol/l) | 54.35±10.32 |
64.21±9.13aa | 62.80±7.66 |
| Serum AST
(mmol/l) | 123.58±11.38 |
143.95±17.68aa | 137.64±16.31 |
| HOMA-index | 23.47±8.86 |
39.57±13.48aa |
23.40±16.71bb |
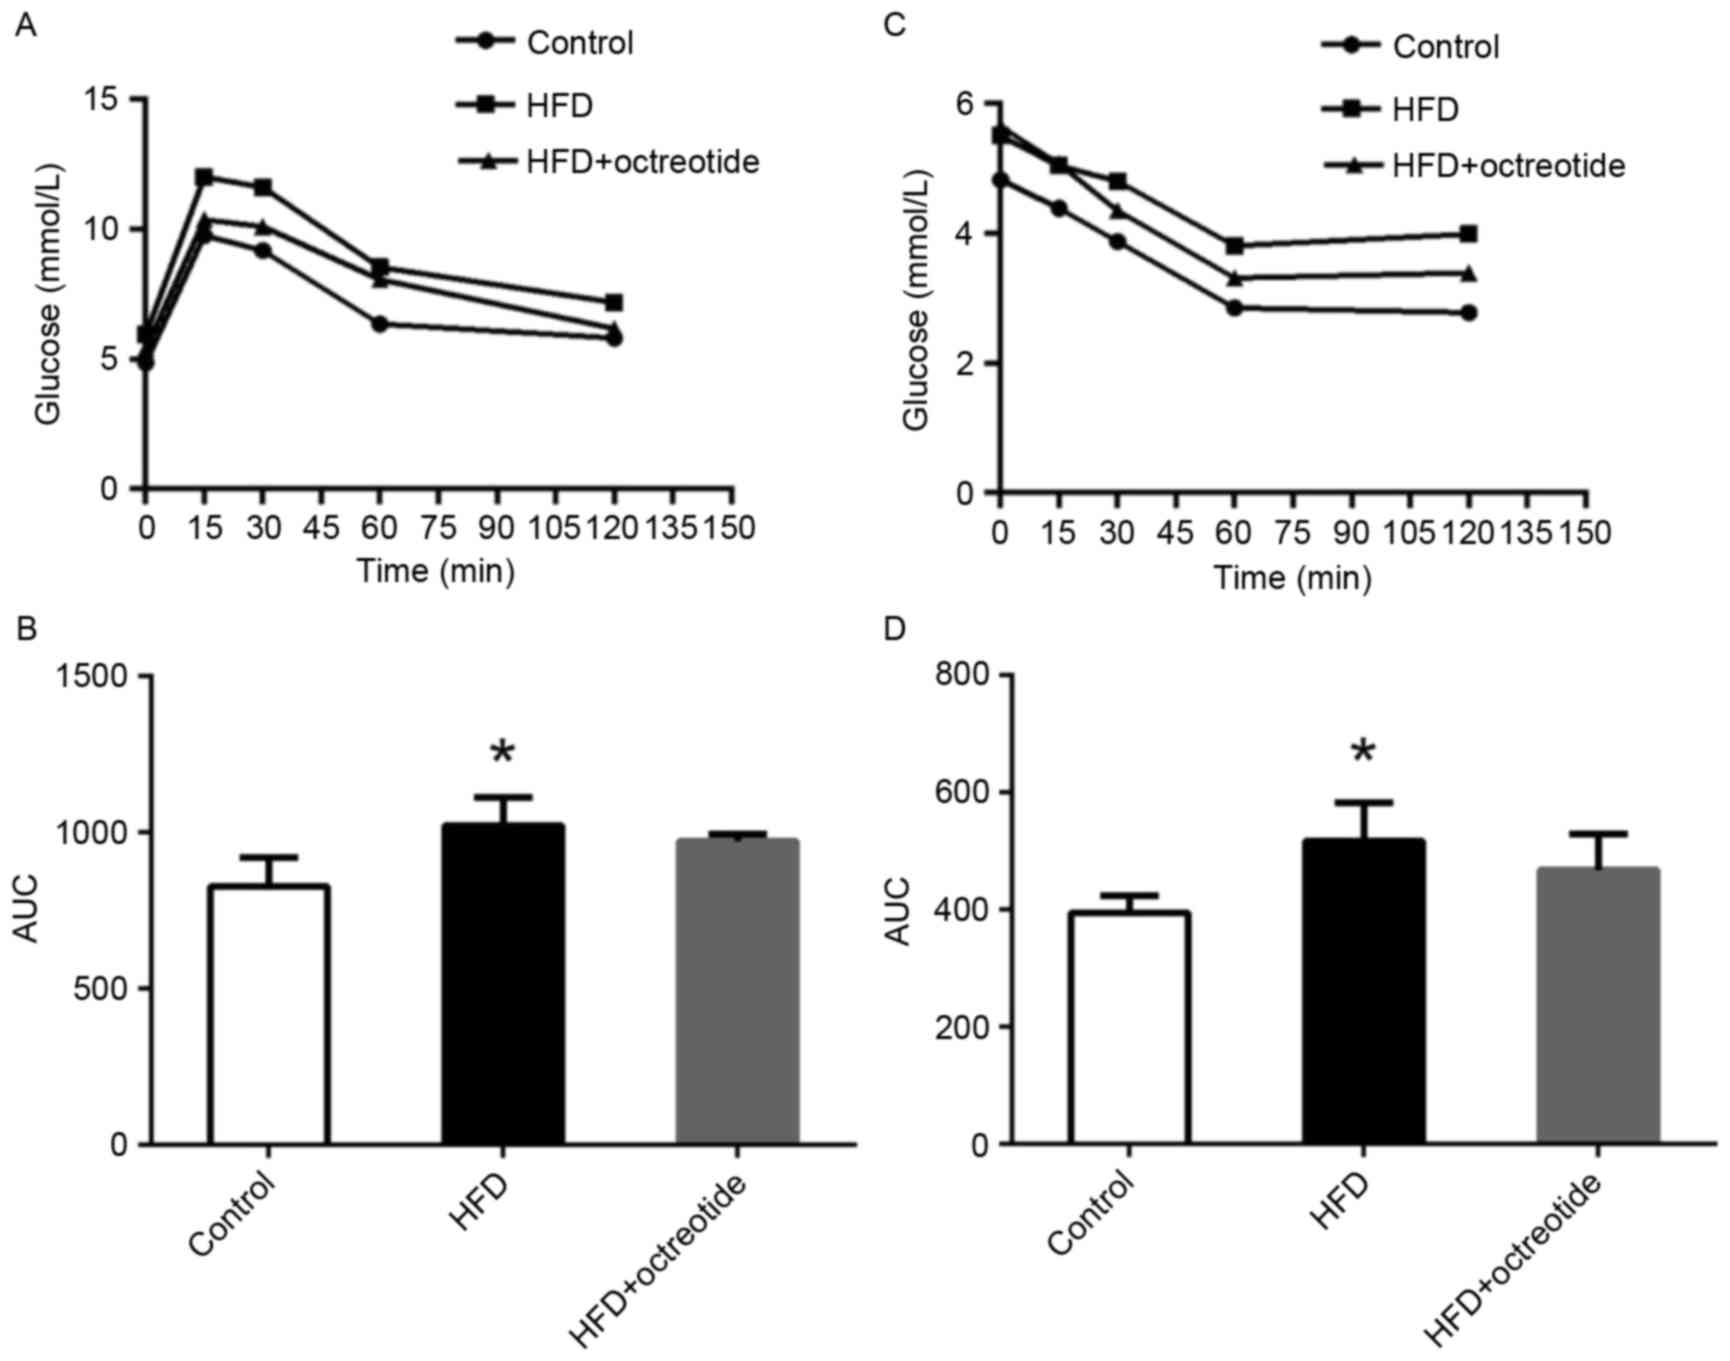
ipGTT and ipITT results
As shown in Fig.
1A, the blood glucose concentration of rats in the HFD group at
0, 15, 30, 60 and 120 min was higher than that observed in the
control rats, and the relative AUC increased by 27.7% (P<0.05;
Fig. 1B). Similarly, glucose
levels in rats from the HFD group was higher when compared with the
control group following the ipITT test (Fig. 1C), and the AUC of ipITT in the HFD
group increased by 28.8% when compared with the control group
(P<0.05; Fig. 1D). Compared
with the HFD group, the ipGTT and ipITT AUCs decreased by 5.2 and
10.5% in the octreotide-treated group, respectively, which did not
reach statistical significance (Fig.
1B and D).
Hepatic TG, FFA levels and glycogen
content
In the HFD-fed rats, hepatic TG and FFA levels were
significantly increased and the hepatic glycogen content was
significantly decreased when compared with the control group
(P<0.01; Table IV). Following
octreotide treatment, the hepatic TG and FFA levels were
significantly decreased when compared with the HFD group
(P<0.01; Table IV). By
contrast, hepatic glycogen content significantly increased in the
octreotide-treated group when compared with the HFD group
(P<0.05; Table IV).
| Table IV.Levels of hepatic serum TG, FFA and
glycogen content in each group. |
Table IV.
Levels of hepatic serum TG, FFA and
glycogen content in each group.
| Parameter | Control group
(n=12) | HFD group
(n=12) | Octreotide-treated
group (n=12) |
|---|
| TG (mg/g
liver) | 9.28±3.02 |
29.94±14.63aa |
18.11±7.08bb |
| FFA (mmol/g
protein) | 36.10±7.62 |
61.22±16.04aa |
40.86±5.09bb |
| Glycogen (mg/g
protein) | 7.17±1.33 |
3.66±0.84aa |
4.77±0.78b |
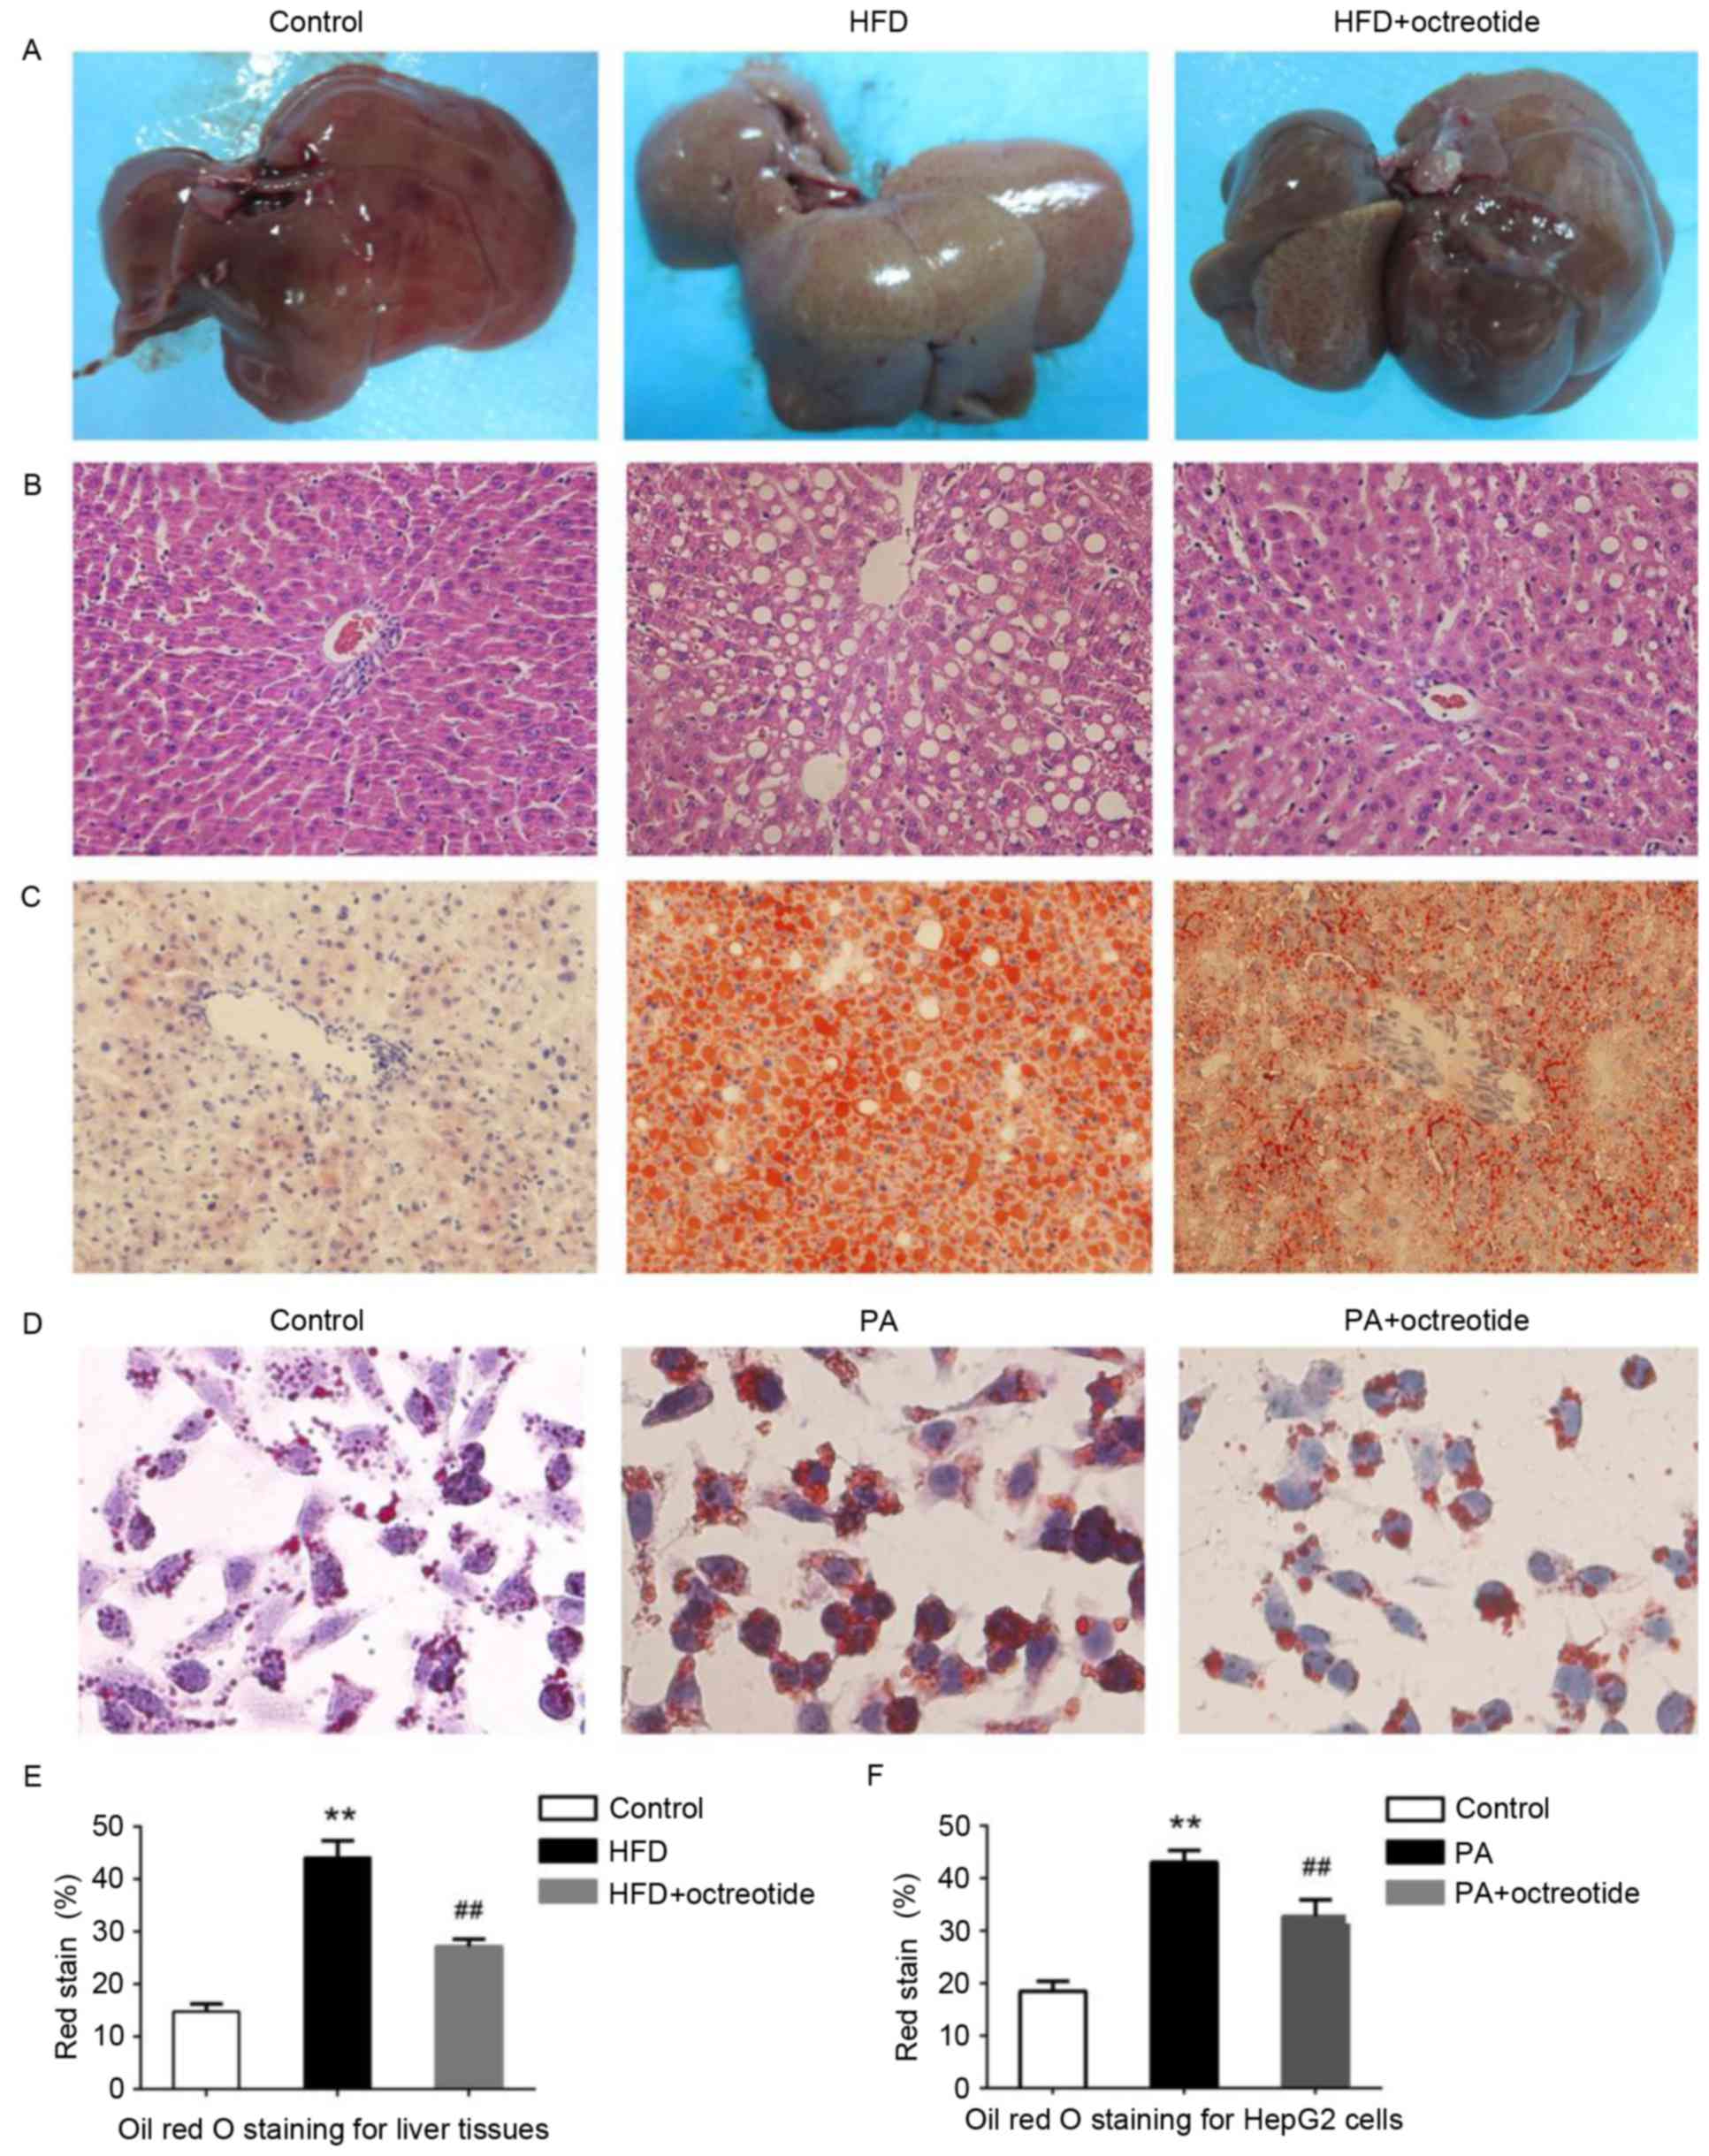
Octreotide improves fat degeneration
in rats with HFD-induced obesity and lipid droplet accumulation in
PA-treated HepG2 cells
Example livers collected from the rats are shown in
Fig. 2A. Liver tissues from rats
in the HFD group were slightly yellow in color and displayed marked
steatosis. The livers of rats in the octreotide-treated and control
groups were similar in macroscopic appearance (Fig. 2A). Hepatic histopathology analysis
revealed that the obese rats displayed diffuse fat deposition,
particularly near the central vein, which exhibited macrovesicular
and microvesicular steatosis (Fig.
2B). No alterations in histopathological structure were
observed in the livers collected from the control rats (Fig. 2B). Fat deposition was significantly
improved by octreotide treatment (Fig.
2B). Oil Red O staining of liver tissues demonstrated marked
lipid infiltration of hepatocytes in obese rats, as indicated by an
increased number of red hepatocytes and higher IOD values when
compared with the control rats (Fig.
2). Octreotide treatment significantly decreased lipid
infiltration in obese rats (Fig.
2C). Similarly, octreotide intervention markedly alleviated
PA-induced hepatocyte lipid droplet accumulation in HepG2 cells
(Fig. 2D). In addition, the IOD
values of the octreotide-treated group were lower when compared
with the PA-treated group (Fig.
2).
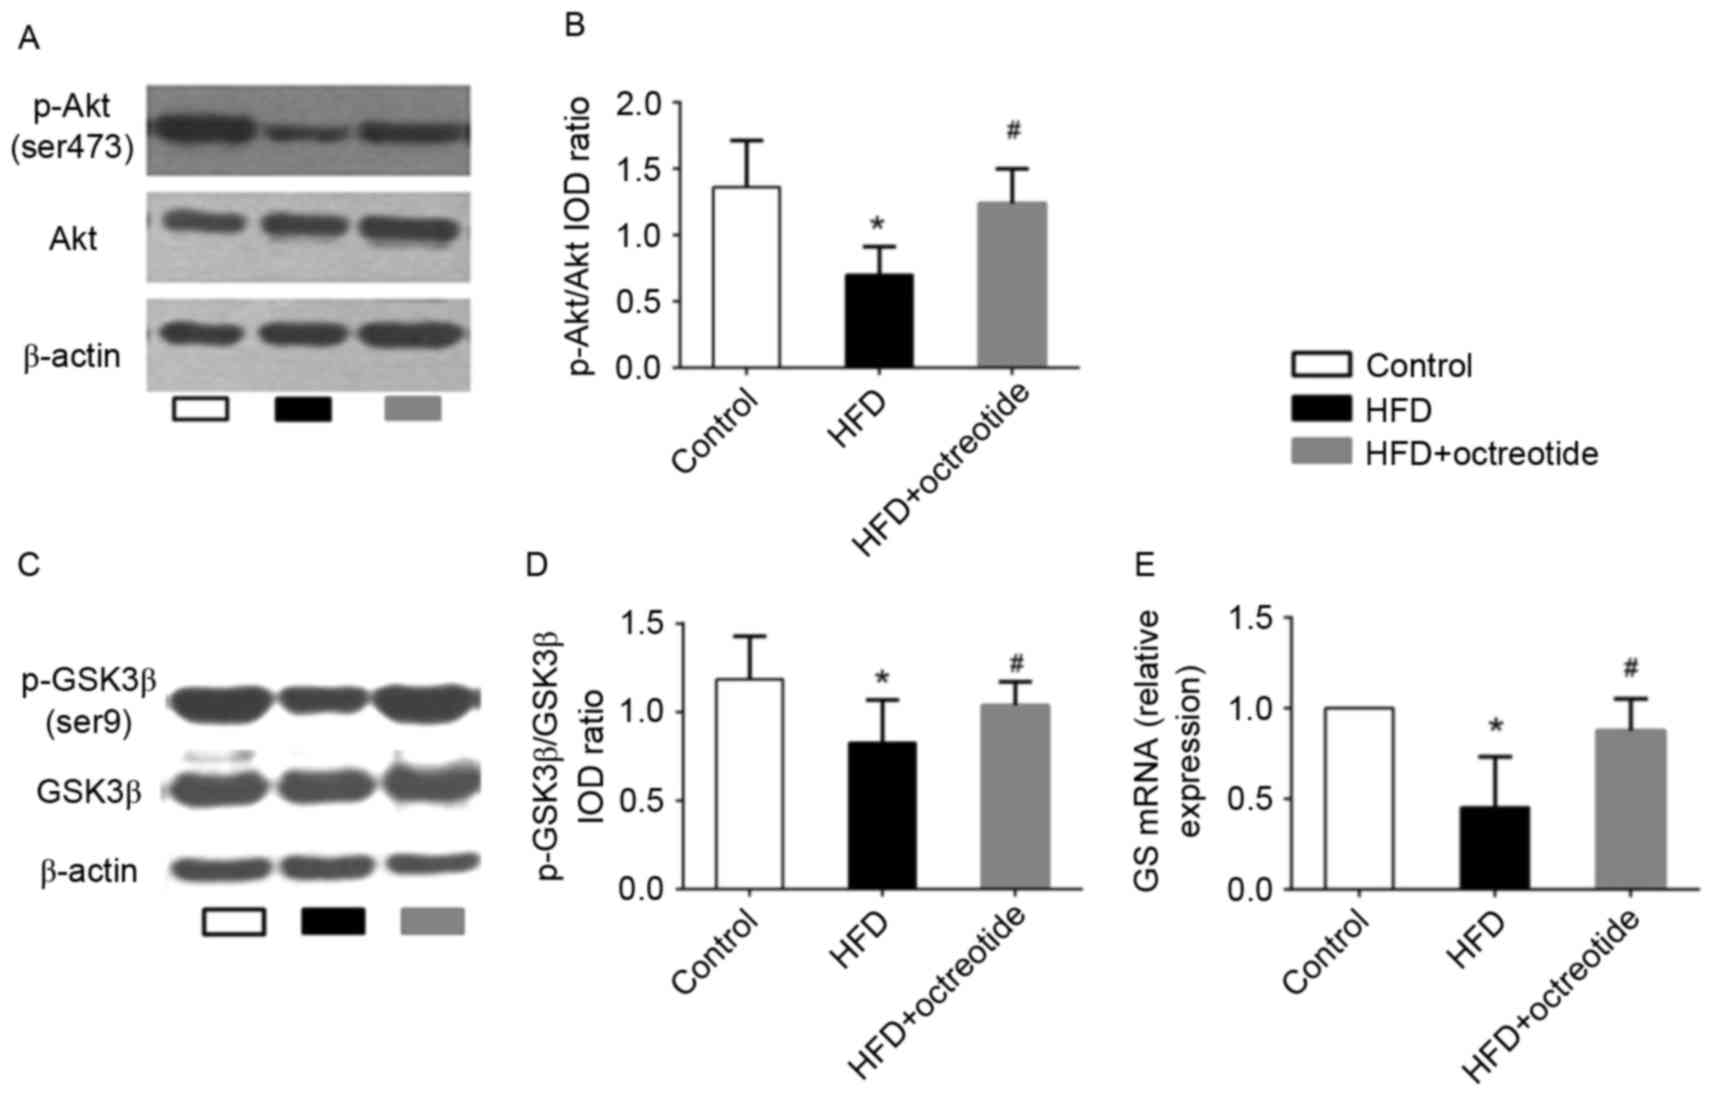
Effects of octreotide on the
phosphorylation of Akt and GSK3β, and the mRNA levels of GS in the
liver of obese rats
The Akt/GSK3β signaling pathway serves an important
role in regulating hepatic glycogen synthesis (17). Therefore, western blotting was used
to detect the protein expression levels of p-Akt and p-GSK3β, and
RT-qPCR analysis was performed to determine the expression levels
of GS mRNA in octreotide-treated obese rats in the present study.
The results demonstrated that the expression of p-Akt and p-GSK3β
in the HFD group was significantly lower when compared with the
control group (0.70±0.21 vs. 1.36±0.35 and 0.83±0.29 vs. 1.19±0.24,
respectively; P<0.05; Fig. 3).
Octreotide treatment significantly increased the level of p-Akt and
p-GSK3β protein expression when compared with the HFD group
(1.24±0.26 vs. 0.70±0.21 and 1.04±0.27 vs. 0.83±0.29, respectively;
P<0.05; Fig. 3). In addition,
the results indicated that octreotide significantly reversed the
HFD-induced reduction in GS mRNA levels (P<0.05; Fig. 3).
Octreotide reversed the PA-induced
alterations in Akt and GSK3β phosphorylation and expression of GS
mRNA in HepG2 cells
The results presented thus far indicate that
octreotide may improve hepatic glycogen synthesis in obese rats. To
further elucidate the mechanisms underlying the effects of
octreotide on glycogen synthesis, the expression of p-Akt and
p-GSK3β was determined by western blotting, and GS mRNA levels were
examined by RT-qPCR analysis in PA-treated HepG2 cells. The western
blotting results revealed that the levels of p-Akt and p-GSK3β in
the PA group decreased by 74.2 and 18.7%, respectively, when
compared with the control group (P<0.05; Fig. 4A-D). Following octreotide
treatment, p-Akt and p-GSK3β levels increased by 140.8 and 12.2%
when compared with the PA group, respectively (P<0.05; Fig. 4A-D). RT-qPCR analysis demonstrated
that the expression of GS mRNA in the PA group was the lowest among
the three groups (Fig. 4E).
However, following octreotide treatment, GS mRNA levels were
significantly increased when compared with the PA group (0.940±0.07
vs. 0.60±0.08; P<0.05; Fig.
4E).
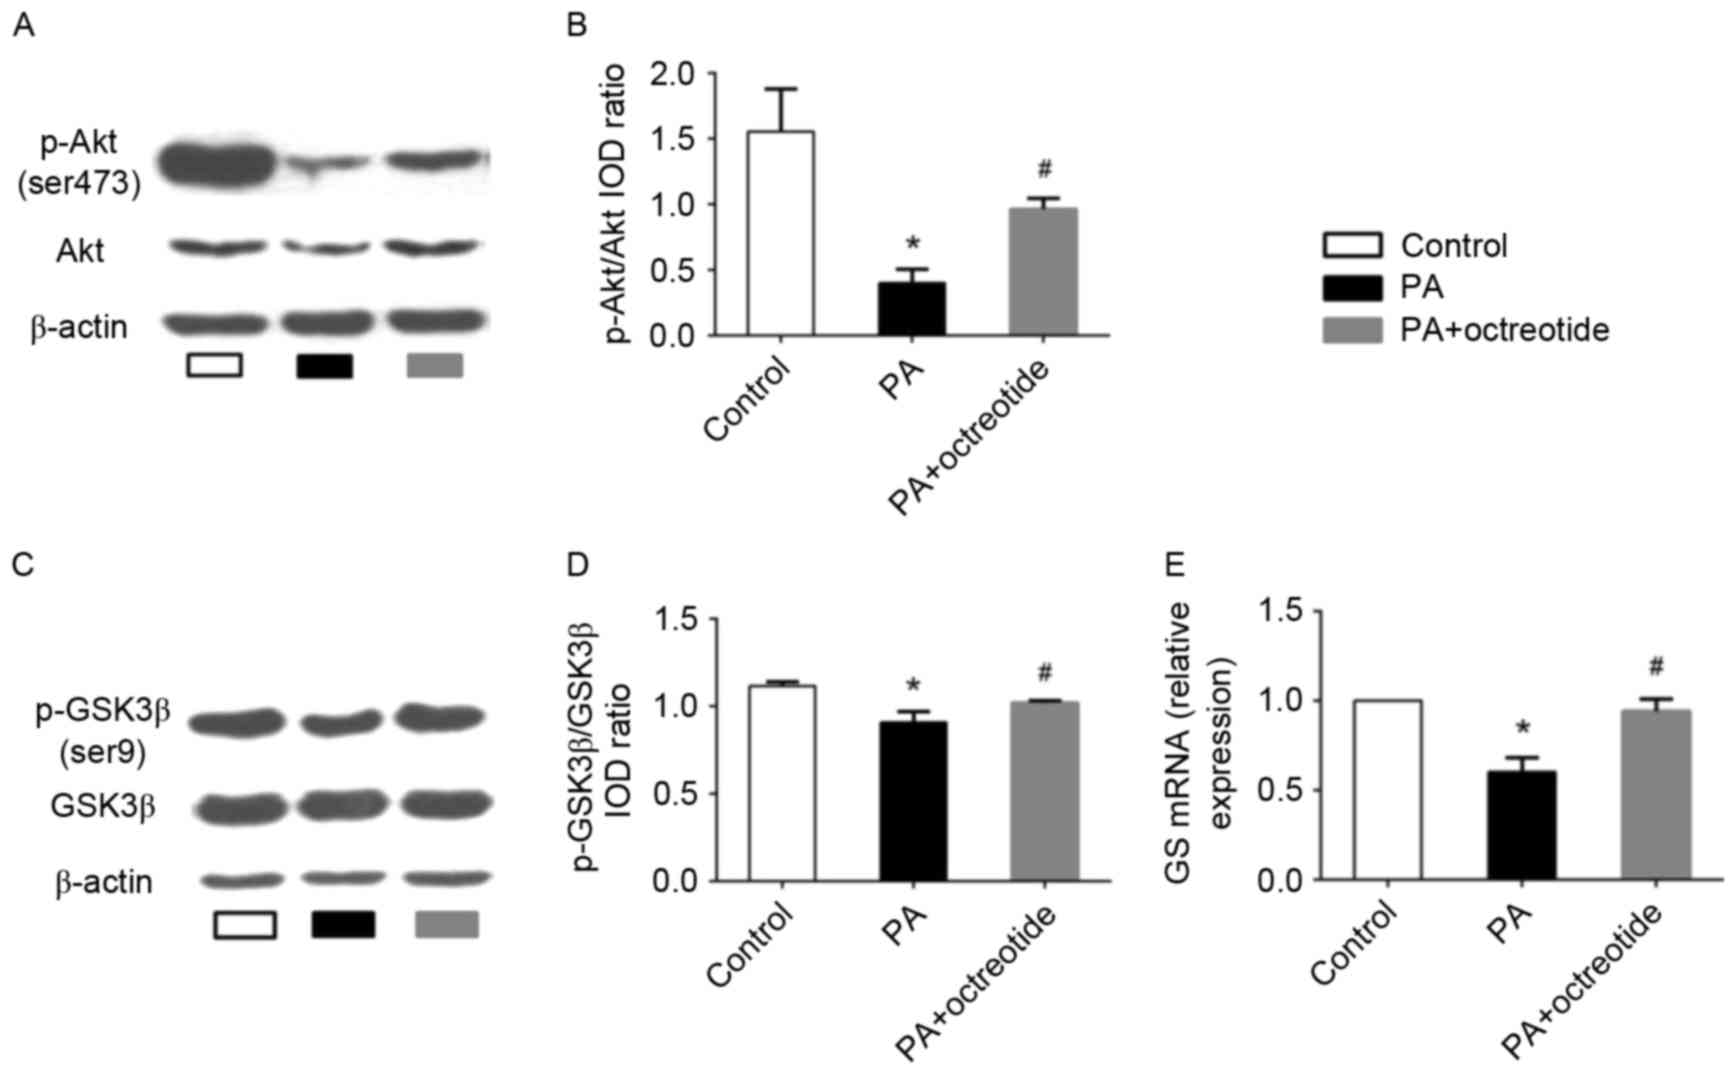 | Figure 4.Expression of p-Akt and p-GSK3β
protein, and GS mRNA levels in PA-treated HepG2 cells. (A) Western
blotting images of p-Akt (Ser473) expression, and (B)
quantification of band intensities. The PA group exhibited the
lowest protein expression levels of p-Akt among the three groups.
(C) Western blotting images of p-GSK3β (Ser9) expression, and (D)
quantification of band intensities. The level of p-GSK3β expression
in the PA group was lower when compared with the control group.
However, octreotide administration inhibited the reduction by
promoting GSK3β phosphorylation. (E) The downregulation of GS mRNA
in the PA group was ameliorated by octreotide intervention. Data
are presented as the mean ± standard deviation of three independent
experiments. *P<0.05 vs. the control group;
#P<0.05 vs. the PA group. p-Akt, phosphorylated-Akt;
p-GSK3β, phosphorylated-glycogen synthase kinase 3β; GS, glycogen
synthase; PA, palmitate; HFD, high fat diet; IOD, integrated
optical density. |
Discussion
Long-term consumption of a high-carbohydrate diet or
HFD and limited physical activity leads to an energy imbalance,
followed by obesity and an increased risk of obesity-associated
diseases, such as NAFLD. Obesity, the critical risk factor for the
development of NAFLD, is the primary cause of metabolic syndrome
(18). Insulin resistance is
considered to be the primary pathophysiological mechanism of
metabolic syndrome (19). A number
of studies have demonstrated that insulin resistance serves an
important role in NAFLD development, and insulin resistance is
thought to be the first symptom of NAFLD (20,21).
Unfortunately, drugs that improve insulin sensitivity have
demonstrated no marked effects on NAFLD thus far (22). In clinical medicine, octreotide is
widely used for the treatment of acute pancreatitis and
gastrointestinal bleeding. A previous study suggested that
octreotide may reduce the weight of rats with HFD-induced obesity
and improve metabolism and oxidative stress disorders (11). An additional previous study
confirmed the function of octreotide in rats with diet-induced
obesity, including weight loss, decreased blood glucose and insulin
concentrations, and increased insulin sensitivity (23). The present study investigated the
role of octreotide in the regulation of blood glucose and insulin
concentrations, revealing that octreotide increases insulin
sensitivity. The results of the ipGTT and ipITT further
demonstrated that octreotide improves insulin sensitivity in
HFD-induced obese rats.
Insulin resistance is closely associated with
hepatic glycogen synthesis. The primary mechanism of reducing
plasma glucose concentrations following a meal is the conversion of
glucose into hepatic glycogen. Glycogen synthesis is mainly
regulated by GSK3β and GS. Serum insulin increases GS activity by
activating Akt, which subsequently phosphorylates GSK3β at Ser-9.
p-GSK3β loses its ability to inhibit GS activity and thus promotes
glycogen synthesis. This regulatory mechanism has been demonstrated
in a previous study (7). Akt, a
key enzyme in the insulin signaling pathway, mediates glucose
metabolism via phosphorylation and activation of its downstream
signaling molecules. Under insulin resistance conditions,
insulin-regulated Akt/GSK signaling transduction is inhibited, and
hepatic glycogen synthesis is decreased. A previous study reported
that mice fed on a HFD developed insulin resistance, displayed
increased levels of blood glucose and insulin, as well as decreased
glycogen synthesis, p-Akt and p-GSK3β expression and GS mRNA
levels. Hepatic glycogen synthesis was increased by promoting Akt
and GSK3β phosphorylation and by increasing GS activity (24). Based on the results of the present
study, octreotide increased p-Akt and p-GSK3β expression in rats
with HFD-induced obesity and reversed the reduction in GS mRNA
levels. A previous study demonstrated that increased
insulin-induced gluconeogenesis and decreased glycogen synthesis
are the major factors underlying the development of type 2 diabetes
(25). Therefore, maintaining the
balance between gluconeogenesis and glycogen synthesis may be an
effective strategy to improve insulin resistance in the type 2
diabetes mouse model (25). In
addition, a specific inhibitor of GSK3β, CHIR 98014, has
demonstrated potential to treat type 2 diabetes and insulin
resistance (26). These studies
may explain the association between GSK3β activity, GS mRNA
expression, hepatic glycogen synthesis and plasma glucose levels in
obese rats.
The results of the present study indicated that
octreotide improves hepatic glycogen synthesis in obese rats. In
order to investigate the mechanisms underlying the effects of
octreotide treatment on glycogen synthesis further, the protein
expression levels p-Akt and p-GSK3β and GS mRNA levels were
determined in an in vitro model of fatty liver disease
induced by PA in HepG2 cells. The results demonstrated that
octreotide significantly increased p-Akt and p-GSK3β protein
expression and GS mRNA levels. Similar to the HepG2 PA-induced
insulin resistance model, a previous study revealed that hepatocyte
glycogen synthesis and glycogen content increased via activation of
the Akt/GSK signaling pathway (25).
GSK3β is a key enzyme that modulates the insulin
signaling pathway via inhibition of GS. In theory, p-GSK3β
expression should increase following intraperitoneal injection of
insulin in insulin-sensitive individuals, followed by an elevation
in serum insulin concentration (3). However, the results of the present
study demonstrated that the expression of p-GSK3β decreased in
obese rats, which may have occurred as a result of impaired insulin
signal transduction. Lu et al (27) revealed that mice that lose the
expression of Akt1 and Akt2 in the liver develop insulin resistance
and impaired glucose tolerance. The promotion of Akt
phosphorylation restores insulin signal transduction and improves
metabolic disorders in obese mice (28). The present study indicated that
octreotide treatment improved hepatic glycogen synthesis in obese
rats via the Akt/GSK signaling pathway; however, further
investigation of the mechanisms underlying these effects is
required.
The potential side effects of octreotide are
gastrointestinal reactions, including anorexia, cramps,
steatorrhea, liquid stools and diarrhea (23). However, during the period of
octreotide treatment in the present study, no obvious signs of
discomfort in the octreotide-treated rats were observed; in fact
these rats displayed normal activity and eating behaviors. In
addition, none of the rats exhibited any evidence of diarrhea or
steatorrhea during the study period. Therefore, the authors
concluded that octreotide administration in the present study
demonstrated no obvious side effects in the rats, at least for the
period tested.
In conclusion, the results of the present study
demonstrated that octreotide improves glycogen synthesis in rats
with HFD-induced obesity and decreases FPG concentration. In
addition, octreotide appears to mediate these effects by increasing
GS activity via induction of GSK3β phosphorylation. Based on the
results of the current study, octreotide may potentially be an
effective therapeutic strategy for HFD-induced obesity and
obesity-associated metabolic disorders.
Acknowledgements
The present study was supported by the National
Natural Sciences Foundation of China (grant no. 30870919) and the
Sichuan Provincial Department of Science and Technology (grant no.
2010SZ0176).
References
|
1
|
Yu SJ, Kim W, Kim D, Yoon JH, Lee K, Kim
JH, Cho EJ, Lee JH, Kim HY, Kim YJ and Kim CY: Visceral obesity
predicts significant fibrosis in patients with nonalcoholic fatty
liver disease. Medicine (Baltimore). 94:e21592015. View Article : Google Scholar : PubMed/NCBI
|
|
2
|
Tolman KG, Fonseca V, Dalpiaz A and Tan
MH: Spectrum of liver disease in type 2 diabetes and management of
patients with diabetes and liver disease. Diabetes Care.
30:734–743. 2007. View Article : Google Scholar : PubMed/NCBI
|
|
3
|
Perry RJ, Samuel VT, Petersen KF and
Shulman GI: The role of hepatic lipids in hepatic insulin
resistance and type 2 diabetes. Nature. 510:84–91. 2014. View Article : Google Scholar : PubMed/NCBI
|
|
4
|
Fruci B, Giuliano S, Mazza A, Malaguarnera
R and Belfiore A: Nonalcoholic fatty liver: A possible new target
for type 2 diabetes prevention and treatment. Int J Mol Sci.
14:22933–22966. 2013. View Article : Google Scholar : PubMed/NCBI
|
|
5
|
Schinner S, Scherbaum WA, Bornstein SR and
Barthel A: Molecular mechanisms of insulin resistance. Diabet Med.
22:674–682. 2005. View Article : Google Scholar : PubMed/NCBI
|
|
6
|
Nordlie RC, Foster JD and Lange AJ:
Regulation of glucose production by the liver. Annu Rev Nutr.
19:379–406. 1999. View Article : Google Scholar : PubMed/NCBI
|
|
7
|
Taniguchi CM, Emanuelli B and Kahn CR:
Critical nodes in signaling pathways: Insights into insulin actio.
Nat Rev Mol Cell Biol. 7:85–96. 2006. View
Article : Google Scholar : PubMed/NCBI
|
|
8
|
Ishikawa M, Yoshida K, Okamura H, Ochiai
K, Takamura H, Fujiwara N and Ozaki K: Oral Porphyromonas
gingivalis translocates to the liver and regulates hepatic glycogen
synthesis through the Akt/GSK-3β signaling pathway. Biochim Biophys
Acta. 1832:2035–2043. 2013. View Article : Google Scholar : PubMed/NCBI
|
|
9
|
Kim KM, Lee KS, Lee GY, Jin H, Durrance
ES, Park HS, Choi SH, Park KS, Kim YB, Jang HC and Lim S:
Anti-diabetic efficacy of KICG1338, a novel glycogen synthase
kinase-3β inhibitor and its molecular characterization in animal
models of type 2 diabetes and insulin resistance. Mol Cell
Endocrinol. 409:1–10. 2015. View Article : Google Scholar : PubMed/NCBI
|
|
10
|
Van Op den Bosch J, Adriaensen D, Van
Nassauw L and Timmermans JP: The role(s) of somatostatin,
structurally related peptides and somatostatin receptors in the
gastrointestinal tract: A review. Regul Pept. 156:1–8. 2009.
View Article : Google Scholar : PubMed/NCBI
|
|
11
|
Li W, Shi YH, Yang RL, Cui J, Xiao Y, Wang
B and Le GW: Effect of somatostatin analog on high-fat diet-induced
metabolic syndrome: Involvement of reactive oxygen species.
Peptides. 31:625–629. 2010. View Article : Google Scholar : PubMed/NCBI
|
|
12
|
Li M, Ye T, Wang XX, Li X, Qiang O, Yu T,
Tang CW and Liu R: Effect of octreotide on hepatic steatosis in
diet-induced obesity in rats. PLoS One. 11:e01520852016. View Article : Google Scholar : PubMed/NCBI
|
|
13
|
Gupte AA, Liu JZ, Ren Y, Minze LJ, Wiles
JR, Collins AR, Lyon CJ, Pratico D, Finegold MJ, Wong ST, et al:
Rosiglitazone attenuates age- and diet-associated nonalcoholic
steatohepatitis in male low-density lipoprotein receptor knockout
mice. Hepatology. 52:2001–2011. 2010. View Article : Google Scholar : PubMed/NCBI
|
|
14
|
Sodhi K, Puri N, Favero G, Stevens S,
Meadows C, Abraham NG, Rezzani R, Ansinelli H, Lebovics E and
Shapiro JI: Fructose mediated non-alcoholic fatty liver is
Attenuated by HO-1-sirt1 module in murine hepatocytes and mice fed
a high fructose diet. PLoS One. 10:e01286482015. View Article : Google Scholar : PubMed/NCBI
|
|
15
|
López-Terrada D, Cheung SW, Finegold MJ
and Knowles BB: Hep G2 is a hepatoblastoma-derived cell line. Hum
Pathol. 40:1512–1515. 2009. View Article : Google Scholar
|
|
16
|
Livak KJ and Schmittgen TD: Analysis of
relative gene expression data using real-time quantitative PCR and
the 2(−Delta Delta C(T)) method. Methods. 25:402–408. 2001.
View Article : Google Scholar : PubMed/NCBI
|
|
17
|
Ishikawa M, Yoshida K, Okamura H, Ochiai
K, Takamura H, Fujiwara N and Ozaki K: Oral Porphyromonas
gingivalis translocates to the liver and regulates hepatic glycogen
synthesis through the Akt/GSK-3β signaling pathway. Biochim Biophys
Acta. 1832:2035–2043. 2013. View Article : Google Scholar : PubMed/NCBI
|
|
18
|
Kumashiro N, Erion DM, Zhang D, Kahn M,
Beddow SA, Chu X, Still CD, Gerhard GS, Han X, Dziura J, et al:
Cellular mechanism of insulin resistance in nonalcoholic fatty
liver disease. Proc Natl Acad Sci USA. 108:16381–16385. 2011.
View Article : Google Scholar : PubMed/NCBI
|
|
19
|
Gan L, Meng ZJ, Xiong RB, Guo JQ, Lu XC,
Zheng ZW, Deng YP, Luo BD, Zou F and Li H: Green tea polyphenol
epigallocatechin-3-gallate ameliorates insulin resistance in
non-alcoholic fatty liver disease mice. Acta Pharmacol Sin.
36:597–605. 2015. View Article : Google Scholar : PubMed/NCBI
|
|
20
|
Souza-Mello V: Peroxisome
proliferator-activated receptors as targets to treat non-alcoholic
fatty liver disease. World J Hepatol. 7:1012–1019. 2015. View Article : Google Scholar : PubMed/NCBI
|
|
21
|
Hwang KA, Hwang YJ, Kim GR and Choe JS:
Extracts from Aralia elata (Miq) Seem alleviate hepatosteatosis via
improving hepatic insulin sensitivity. BMC Complement Altern Med.
15:3472015. View Article : Google Scholar : PubMed/NCBI
|
|
22
|
Musso G, Gambino R, Cassader M and Pagano
G: A meta-analysis of randomized trials for the treatment of
nonalcoholic fatty liver disease. Hepatology. 52:79–104. 2010.
View Article : Google Scholar : PubMed/NCBI
|
|
23
|
Huang W, Liu R, Ou Y, Li X, Qiang O, Yu T
and Tang CW: Octreotide promotes weight loss via suppression of
intestinal MTP and apoB48 expression in diet-induced obesity rat.
Nutrition. 29:1259–1265. 2013. View Article : Google Scholar : PubMed/NCBI
|
|
24
|
Yang Y, Li W, Liu Y, Li Y, Gao L and Zhao
JJ: Alpha-lipoic acid attenuates insulin resistance and improves
glucose metabolism in high fat diet-fed mice. Acta Pharmacol Sin.
35:1285–1292. 2014. View Article : Google Scholar : PubMed/NCBI
|
|
25
|
Liu TY, Shi CX, Gao R, Sun HJ, Xiong XQ,
Ding L, Chen Q, Li YH, Wang JJ, Kang YM and Zhu GQ: Irisin inhibits
hepatic gluconeogenesis and increased glycogen synthesis via the
PI3K/Akt pathway in type 2 diabetic mice and hepatocytes. Clin Sci
(Lond). 129:839–850. 2015. View Article : Google Scholar : PubMed/NCBI
|
|
26
|
MacAulay K and Woodgett JR: Targeting
glycogen synthase kinase-3 (GSK-3) in the treatment of Type 2
diabetes. Expert Opin Ther Targets. 12:1265–1274. 2008. View Article : Google Scholar : PubMed/NCBI
|
|
27
|
Lu M, Wan M, Leavens KF, Chu Q, Monks BR,
Fernandez S, Ahima RS, Ueki K, Kahn CR and Birnbaum MJ: Insulin
regulates liver metabolism in vivo in the absence of hepatic Akt
and Foxo1. Nat Med. 18:388–395. 2012. View
Article : Google Scholar : PubMed/NCBI
|
|
28
|
Ozcan L, de Cristina Souza J, Harari AA,
Backs J, Olson EN and Tabas I: Activation of
calcium/calmodulin-dependent protein kinase II in obesity mediates
suppression of hepatic insulin signaling. Cell Metab. 18:803–815.
2013. View Article : Google Scholar : PubMed/NCBI
|