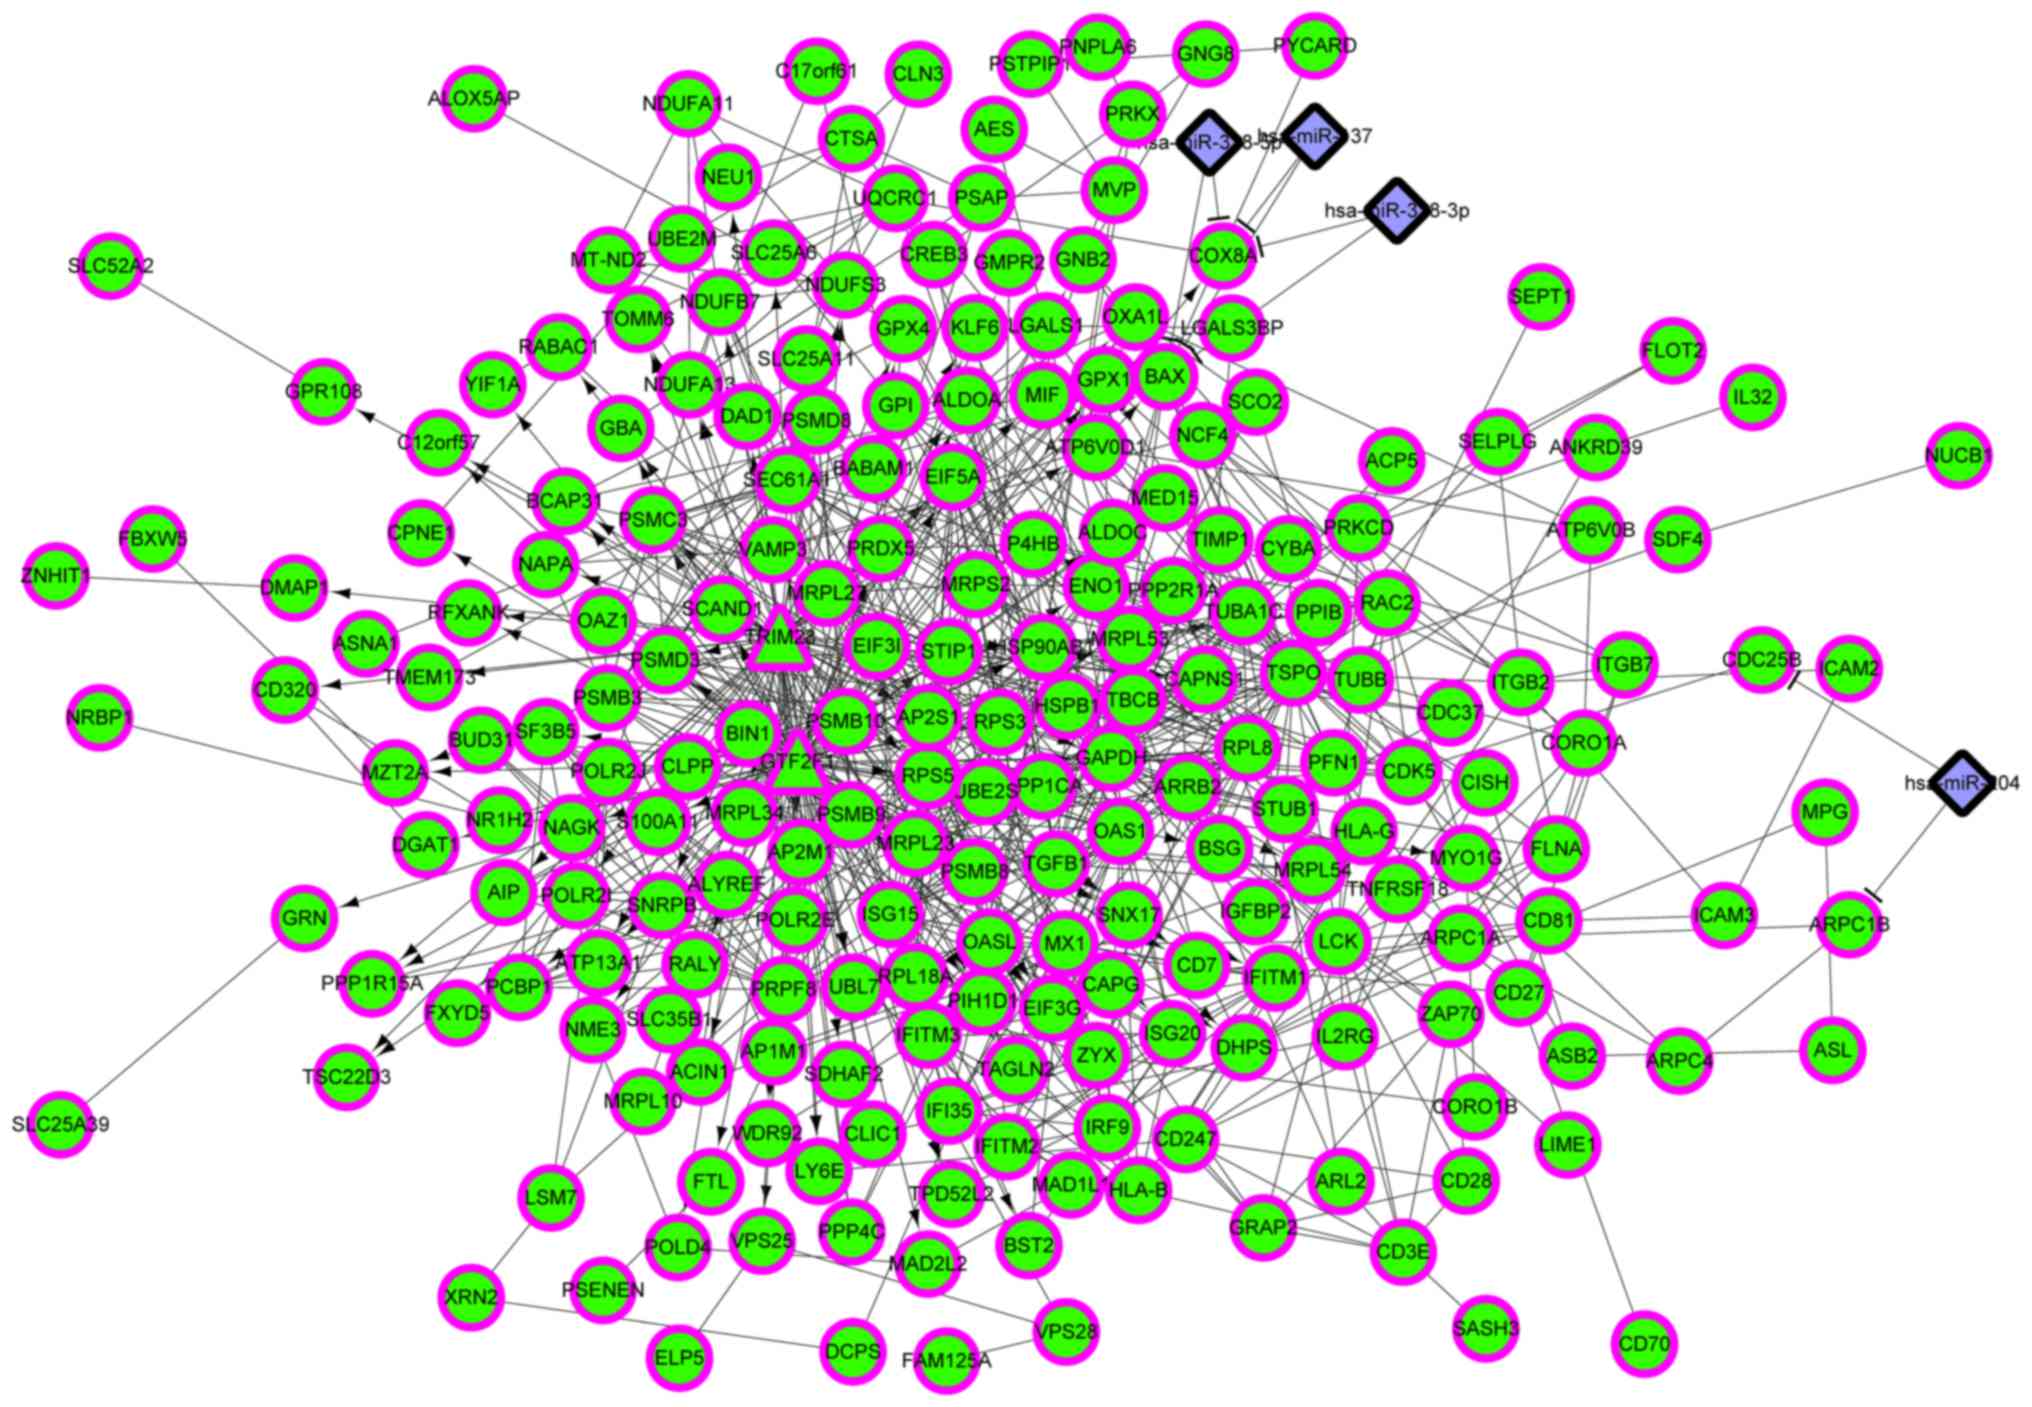
| 1 | GO:0051248~negative
regulation of protein metabolic process | 18 | HSP90AB1,
PSMB10, CLN3, PPP2R1A, NDUFA13, CDK5, PRKCD, FLNA, PSMB8, TGFB1,
TIMP1, PSMB9, PSMC3, PSMB3, BAX, PSMD3, VPS28, PSMD8 |
2.39×10⁻⁹ |
|
|
GO:0032268~regulation of cellular protein
metabolic process | 27 | HSP90AB1,
PSMB10, EIF5A, ITGB2, STUB1, TGFB1, TIMP1, NR1H2, PSMB3, PSMD3,
PSMD8, CD28, CLN3, PPP2R1A, CD3E, NDUFA13, CDK5, PRKCD, RPS5,
PSMB8, PSMB9, PSMC3, BAX, CD81, HSPB1, VPS28, PPP1R15A |
7.78×10⁻⁹ |
|
| GO:0032269~negative
regulation of cellular protein metabolic process | 17 | HSP90AB1,
PSMB10, CLN3, PPP2R1A, NDUFA13, CDK5, PRKCD, PSMB8, TGFB1, TIMP1,
PSMB9, PSMC3, PSMB3, BAX, PSMD3, VPS28, PSMD8 |
9.96×10⁻⁹ |
|
| GO:0031400~negative
regulation of protein modification process | 13 | PSMB10, PPP2R1A,
CDK5, PRKCD, PSMB8, TGFB1, PSMB9, PSMC3, BAX, PSMB3, PSMD3, VPS28,
PSMD8 |
1.86×10⁻⁷ |
|
| GO:0006955~immune
response | 30 | PSMB10, IFITM2,
IFITM3, ACP5, CD70, IL32, OAS1, TGFB1, IFI35, MIF, TUBB, TMEM173,
ZAP70, IL2RG, CD27, CD28, CD7, BST2, NCF4, HLA-B, PRKCD, PSMB8,
HLA-G, BCAP31, PSMB9, GPI, CYBA, CORO1A, OASL, LIME1 |
3.38×10⁻⁷ |
|
| GO:0070271~protein
complex biogenesis | 23 | ARL2, PPP2R1A,
OXA1L, POLR2E, CD3E, AP2S1, ALDOC, POLR2J, POLR2I, ARPC4, CDK5,
TGFB1, FLNA, MIF, CYBA, TUBB, BAX, ALOX5AP, GTF2F1, CAPG, VAMP3,
TUBA1C, SCO2 |
5.68×10⁻⁶ |
|
| GO:0006461~protein
complex assembly | 23 | ARL2, PPP2R1A,
OXA1L, POLR2E, CD3E, AP2S1, ALDOC, POLR2J, POLR2I, ARPC4, CDK5,
TGFB1, FLNA, MIF, CYBA, TUBB, BAX, ALOX5AP, GTF2F1, CAPG, VAMP3,
TUBA1C, SCO2 |
5.68×10⁻⁶ |
|
|
GO:0031399~regulation of protein
modification process | 17 | PSMB10, PPP2R1A,
CD3E, ITGB2, CDK5, PRKCD, STUB1, PSMB8, TGFB1, PSMB9, PSMC3, PSMB3,
BAX, CD81, PSMD3, VPS28, PSMD8 |
8.00×10⁻⁶ |
|
| GO:0031397~negative
regulation of protein ubiquitination | 9 | PSMB10, PSMC3,
PSMB3, PSMD3, VPS28, CDK5, PSMD8, PSMB8, PSMB9 |
1.30×10⁻⁵ |
|
|
GO:0065003~macromolecular complex
assembly | 26 | OXA1L, POLR2E,
ALDOC, POLR2J, AP2S1, POLR2I, ARPC4, TGFB1, MIF, TUBB, ALOX5AP,
SCO2, TUBA1C, ARL2, PPP2R1A, CD3E, CDK5, FLNA, CYBA, PIH1D1, DGAT1,
GTF2F1, BAX, CAPG, SNRPB, VAMP3 |
1.65×10⁻⁵ |
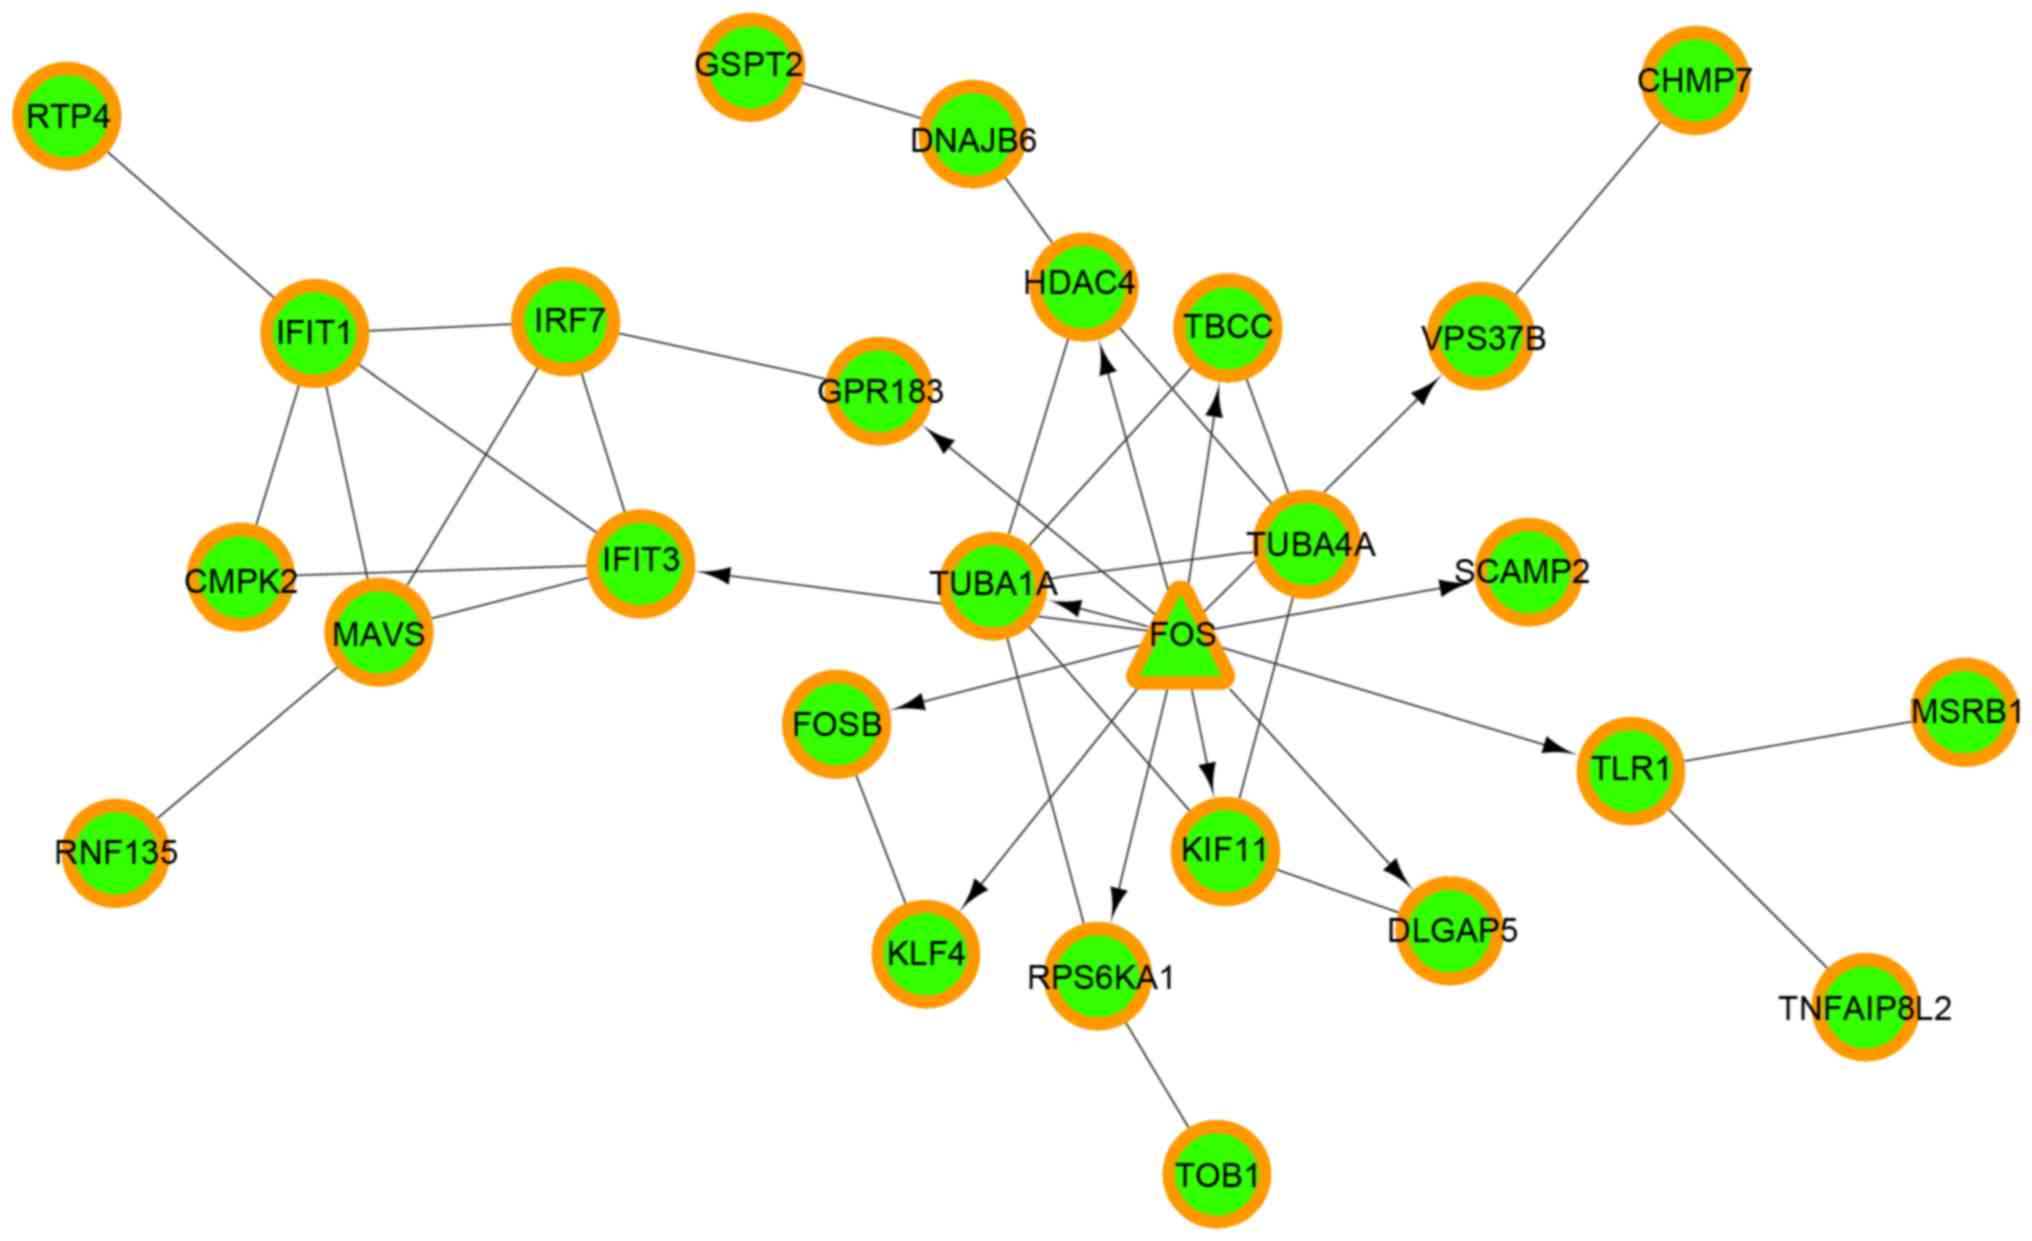
| 2 | GO:0006952~defense
response | 7 | MAVS, TNFAIP8L2,
HDAC4, FOS, CCR5, IRF7, TLR1 |
2.84×10⁻³ |
|
|
GO:0006954~inflammatory response | 5 | HDAC4, FOS,
CCR5, IRF7, TLR1 |
6.92×10⁻³ |
|
|
GO:0006853~carnitine shuttle | 2 | SLC25A20,
CPT2 |
7.08×10⁻³ |
|
| GO:0045892~negative
regulation of transcription, DNA-dependent | 5 | HDAC4, IRF7,
FOSB, KLF4, DNAJB6 |
9.48×10⁻³ |
|
| GO:0051253~negative
regulation of RNA metabolic process | 5 | HDAC4, IRF7,
FOSB, KLF4, DNAJB6 |
1.00×10⁻² |
|
|
GO:0032365~intracellular lipid
transport | 2 | SLC25A20,
CPT2 |
1.64×10⁻² |
|
| GO:0015838~betaine
transport | 2 | SLC25A20,
CPT2 |
1.64×10⁻² |
|
|
GO:0015879~carnitine transport | 2 | SLC25A20,
CPT2 |
1.64×10⁻² |
|
| GO:0006955~immune
response | 6 | MAVS, TNFAIP8L2,
GPR183, CCR5, TLR1, GPR65 |
2.18×10⁻² |
|
| GO:0016481~negative
regulation of transcription | 5 | HDAC4, IRF7,
FOSB, KLF4, DNAJB6 |
2.22×10⁻² |
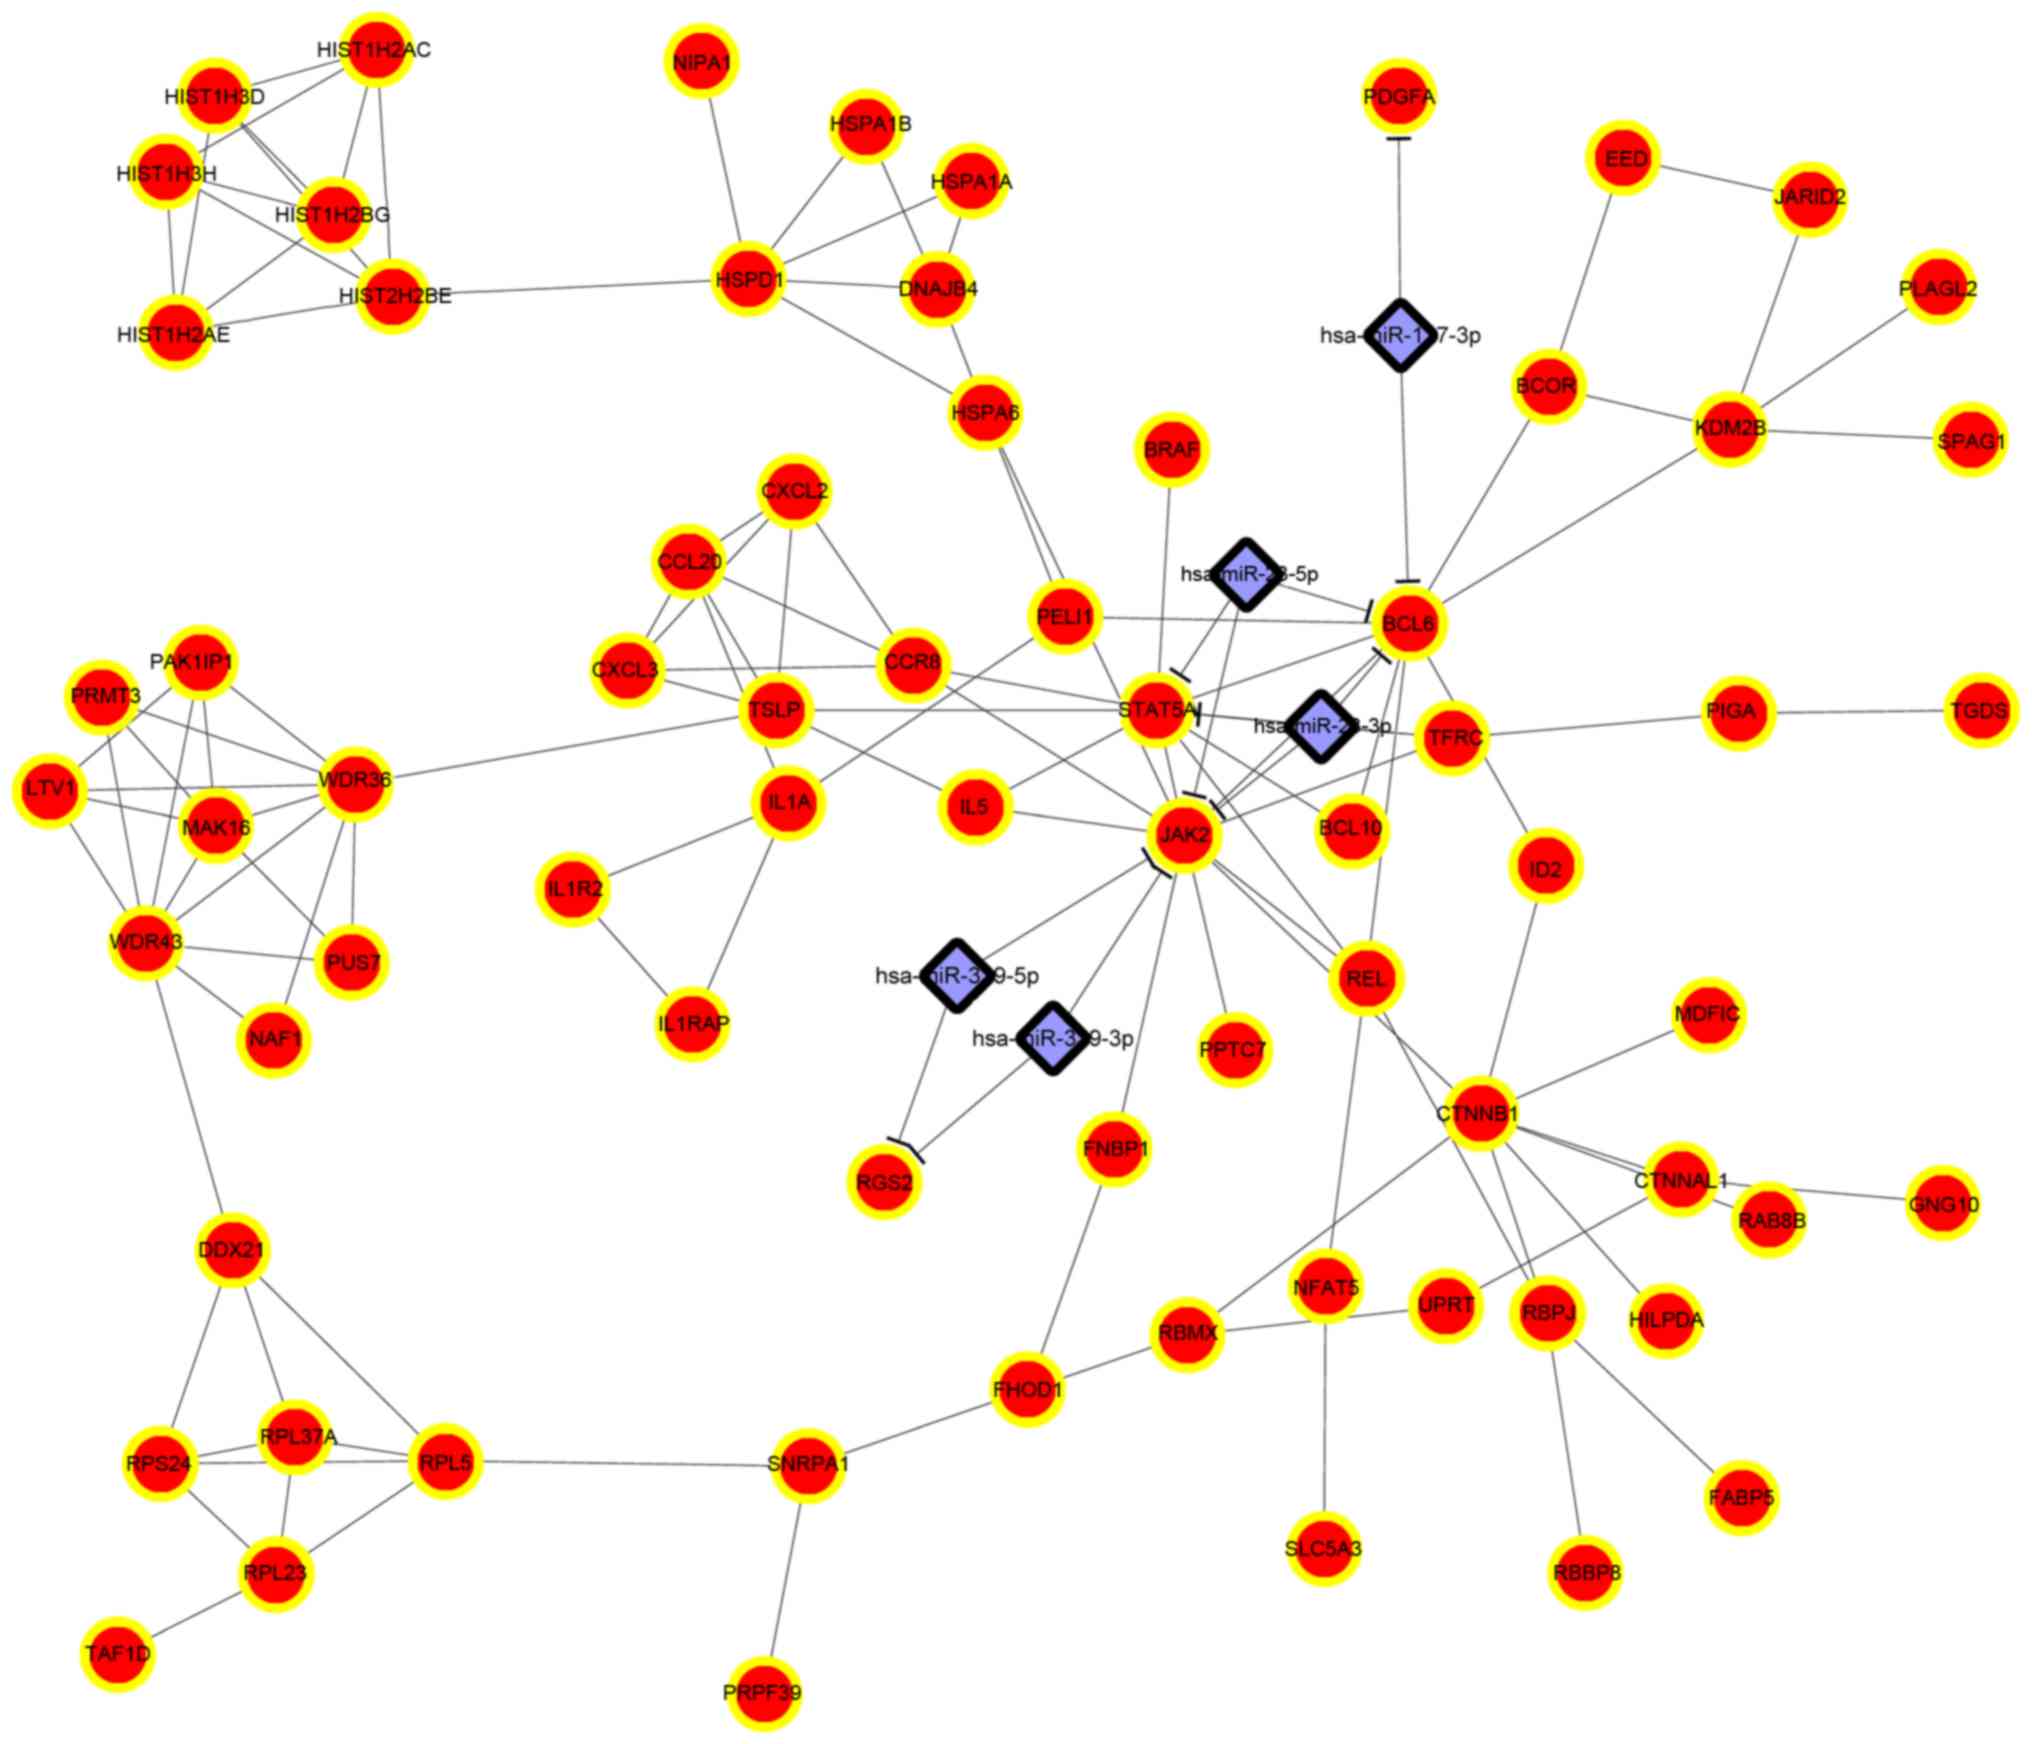
| 3 | GO:0010033~response
to organic substance | 15 | BCL10, EIF2C2,
STAT5A, TAF9B, HSPA1A, HSPA1B, CTNNB1, CYP7B1, ID2, TFRC, GNG10,
PRKRA, HSPA6, JAK2, HSPD1, DNAJB4 |
2.20×10⁻⁵ |
|
| GO:0050867~positive
regulation of cell activation | 6 | BCL10, IL5,
STAT5A, BCL6, JAK2, HSPD1 |
3.07×10⁻⁴ |
|
|
GO:0001817~regulation of cytokine
production | 7 | BCL10, REL,
STAT5A, BCL6, JAK2, HSPD1, IL1A |
3.97×10⁻⁴ |
|
|
GO:0006325~chromatin organization | 9 | HIST1H2AC,
KDM2B, HIST2H2BE, HIST1H2BG, HIST1H2AE, MORF4L2, EED, HIST1H3D,
BCOR, HIST1H3H |
8.67×10⁻⁴ |
|
|
GO:0006334~nucleosome assembly | 5 | HIST1H2AC,
HIST2H2BE, HIST1H2BG, HIST1H2AE, HIST1H3D, HIST1H3H |
1.03×10⁻³ |
|
|
GO:0031497~chromatin assembly | 5 | HIST1H2AC,
HIST2H2BE, HIST1H2BG, HIST1H2AE, HIST1H3D, HIST1H3H |
1.18×10⁻³ |
|
|
GO:0002761~regulation of myeloid leukocyte
differentiation | 4 | IL5, ID2,
STAT5A, CTNNB1 |
1.33×10⁻³ |
|
| GO:0010629~negative
regulation of gene expression | 10 | EIF2C2, ID2,
JARID2, TAF9B, PRKRA, EED, BCL6, BCOR, RBPJ, CTNNB1 |
1.36×10⁻³ |
|
|
GO:0065004~protein-DNA complex
assembly | 5 | HIST1H2AC,
HIST2H2BE, HIST1H2BG, HIST1H2AE, HIST1H3D, HIST1H3H |
1.39×10⁻³ |
|
|
GO:0034728~nucleosome organization | 5 | HIST1H2AC,
HIST2H2BE, HIST1H2BG, HIST1H2AE, HIST1H3D, HIST1H3H |
1.51×10⁻³ |
| 4 |
GO:0042127~regulation of cell
proliferation | 20 | IL4, NAMPT, TNF,
FOSL2, IL8, PTGS2, KLF10, CTLA4, NFKBIA, IL13, SIRT1, SLAMF1, IL10,
IL12RB2, LIF, CD80, MYC, PLAU, LTA, IL2 |
6.12×10⁻⁹ |
|
|
GO:0016265~death | 19 | TRAF1, IER3,
FOSL2, TNF, BCL2A1, NR4A2, NFKBIA, FASLG, BIRC3, SIRT1, AHR,
GADD45G, ZC3H12A, SIAH2, TNFAIP3, GADD45B, GADD45A, MYC,
LTA |
1.07×10⁻⁸ |
|
| GO:0001775~cell
activation | 13 | IL4, ZBTB32,
ICAM1, TNF, IL8, RELB, IL21R, SLAMF1, IL10, CD80, CD40LG, LTA,
IL2 |
1.67×10⁻⁸ |
|
|
GO:0006915~apoptosis | 17 | TRAF1, IER3,
TNF, BCL2A1, NFKBIA, FASLG, BIRC3, SIRT1, AHR, GADD45G, ZC3H12A,
SIAH2, TNFAIP3, GADD45B, GADD45A, MYC, LTA |
3.30×10⁻⁸ |
|
| GO:0006955~immune
response | 18 | IL4, ICAM1,
CCL3, TNF, IL18RAP, IL8, RELB, CTLA4, FASLG, IL13, GEM, CCL4, IL10,
LIF, CD83, CD40LG, LTA, IL2 |
3.43×10⁻⁸ |
|
|
GO:0012501~programmed cell death | 17 | TRAF1, IER3,
TNF, BCL2A1, NFKBIA, FASLG, BIRC3, SIRT1, AHR, GADD45G, ZC3H12A,
SIAH2, TNFAIP3, GADD45B, GADD45A, MYC, LTA |
4.06×10⁻⁸ |
|
|
GO:0042981~regulation of apoptosis | 19 | TRAF1, IL4,
IER3, TNF, PTGS2, KLF10, BCL2A1, NR4A2, NFKBIA, FASLG, PIM3, BIRC3,
SIRT1, IL10, CD40LG, TNFAIP3, MYC, LTA, IL2 |
5.39×10⁻⁸ |
|
| GO:0008219~cell
death | 18 | TRAF1, IER3,
FOSL2, TNF, BCL2A1, NFKBIA, FASLG, BIRC3, SIRT1, AHR, GADD45G,
ZC3H12A, SIAH2, TNFAIP3, GADD45B, GADD45A, MYC, LTA |
6.26×10⁻⁸ |
|
|
GO:0043067~regulation of programmed cell
death | 19 | TRAF1, IL4,
IER3, TNF, PTGS2, KLF10, BCL2A1, NR4A2, NFKBIA, FASLG, PIM3, BIRC3,
SIRT1, IL10, CD40LG, TNFAIP3, MYC, LTA, IL2 |
6.26×10⁻⁸ |
|
|
GO:0010941~regulation of cell death | 19 | TRAF1, IL4,
IER3, TNF, PTGS2, KLF10, BCL2A1, NR4A2, NFKBIA, FASLG, PIM3, BIRC3,
SIRT1, IL10, CD40LG, TNFAIP3, MYC, LTA, IL2 |
6.62×10⁻⁸ |