Introduction
Leucine-rich glioma inactivated 3 (LGI3) is a
secreted protein member of the LGI family in vertebrates, which is
expressed at high levels in the brain in a
developmentally-regulated manner (1). The expression of LGI3 in the brain
has been shown to be regulated at the transcriptional level by
activating protein-2 and neuronal restrictive silencer (1). In our previous studies, it was
reported that LGI3 regulated neuronal exocytosis and
differentiation (2,3). In addition to the nervous system,
LGI3 is expressed in various tissues, including adipose tissues and
the skin (4,5). Our previous study demonstrated that
the ultraviolet B-irradiation-induced secretion of LGI3 from human
keratinocytes protected cells (5),
and it was further shown that LGI3 promoted the migration of
keratinocytes and melanogenic pigmentation (6,7).
Our previous studies also showed that the expression
of LGI3 was downregulated during adipocyte differentiation and was
upregulated in the adipose tissues of ob/ob mice and high fat
diet-fed obese mice (4,8). It was shown that LGI3 attenuated
adipogenesis through its receptor, a disintegrin and
metalloproteinase domain-containing protein 23 (ADAM23), and that
LGI3 increased the expression of inflammatory proteins, including
tumor necrosis factor-α (TNF-α) in macrophages (4). LGI3 was shown to downregulate
adiponectin, an anti-inflammatory adipokine (8). LGI3 and TNF-α were also found to be
upregulated mutually through nuclear factor-κB (NF-κB), suggesting
their importance in metabolic inflammation in obesity (9). Therefore, it was hypothesized that
LGI3 is involved as a pro-inflammatory cytokine, which interacts
with TNF-α and adiponectin, and these results supported the
hypothesis that LGI3 is a multifunctional cytokine secreted by, and
acting at, multiple cell types (3–9).
Cytokines, including TNF-α and adiponectin have been
described as risk factors, and potential diagnostic and prognostic
biomarkers in cancer (10,11). As LGI3 has been shown to interact
with TNF-α and adiponectin in metabolic inflammation (8,9), it
was hypothesized that LGI3 may also be associated with the cytokine
network in cancer. To confirm this hypothesis, the present study
analyzed the phylogeny of LGI3 orthologues, amino acid coevolution,
single nucleotide polymorphisms (SNPs), somatic mutations and
expression microarray data in different types of cancer. The
results of these integrative analyses supported the potential
significance of LGI3 in cancer prognosis.
Materials and methods
Sequence retrieval and phylogenetic
analysis
All the LGI3 genes and amino acid sequences were
obtained from the Ensembl database (http://www.ensembl.org). Comparative sequence analysis
and alignment were performed using Blastp in NCBI (http://blast.ncbi.nlm.nih.gov/Blast.cgi?PAGE=Proteins)
and ClustalW algorithm implemented in MEGA 6.0 software (http://www.megasoftware.net). A maximum likelihood
tree of LGI3 was constructed using MEGA 6.0 with the Kimura 2
parameter model. Coevolution analysis of amino acid sequences was
performed using Coevolution Analysis of Protein Sequences (CAPS
2.0; http://bioinf.gen.tcd.ie/caps)
(12). The coevolved amino acid
clusters were selected and diagrams were constructed using the
Cytoscape 3.4.0 program (http://www.cytoscape.org).
SNP data evaluation
The SNPs of human LGI3 (GenBank accession no.:
AAM49554.1) were extracted from the Ensembl (http://www.ensembl.org) and NCBI (http://www.ncbi.nlm.nih.gov) SNP databases.
Functionally relevant SNPs, which disrupted reference amino acid
sequence (missense, nonsense, frameshift and splice site variants)
were selected for comparative analysis. SNPs with known global
minor allele frequency (MAF) values were taken into account.
Somatic mutations in cancer
Somatic mutations of the human LGI3 gene in cancer
were identified in Cbioportal (http://www.cbioportal.org) (13,14),
the Catalogue of Somatic Mutations in Cancer (COSMIC; https://cancer.sanger.ac.uk/cosmic) and The
Cancer Genome Atlas (TCGA; https://tcga-data.nci.nih.gov/tcga). A Venn diagram of
the categorized genetic variations was generated using Venny 2.0.2
(http://bioinfogp.cnb.csic.es/tools/venny/index.html).
The expression data of LGI3 in normal and cancer tissues were
obtained from the Human Protein Atlas (http://www.proteinatlas.org) and NCBI UniGene
(http://www.ncbi.nlm.nih.gov/unigene/).
Meta-analysis of expression microarray
data
Gene expression microarray datasets were searched
using the PrognoScan database (http://www.prognoscan.org) (15). This database consists of a large
collection of publicly available cancer microarray datasets,
providing sample name, raw expression data file, sample source
name, array platform, and clinical annotations, including tumor
grade diagnosis, histological diagnosis, age at diagnosis, survival
time, treatment and therapy types. These datasets are previously
subjected to quality control tests, normalization and batch effect
adjustment, with exclusion of low-quality samples. The assessment
of associations between gene expression and cancer prognosis use
the minimum P-value approach for grouping patients for survival
analysis, which identifies the optimal cutoff point in continuous
gene expression measurement without prior assumption. Briefly, the
patients ordered by the expression values were dichotomized at the
cutoff point to minimize the P-value, and the survival difference
between the high and low expression groups were calculated using
the log-rank test. Kaplan-Meier plots of statistically significant
(P<0.05; group size >10) datasets were generated.
Results
Phylogenetic analysis of LGI3
protein
As the LGI3 gene was initially identified in humans
and mice (1,16), LGI3 gene orthologues were found
only in vertebrates. The sequences of LGI3 gene products were
retrieved from the Ensembl database and confirmed using BLASTp in
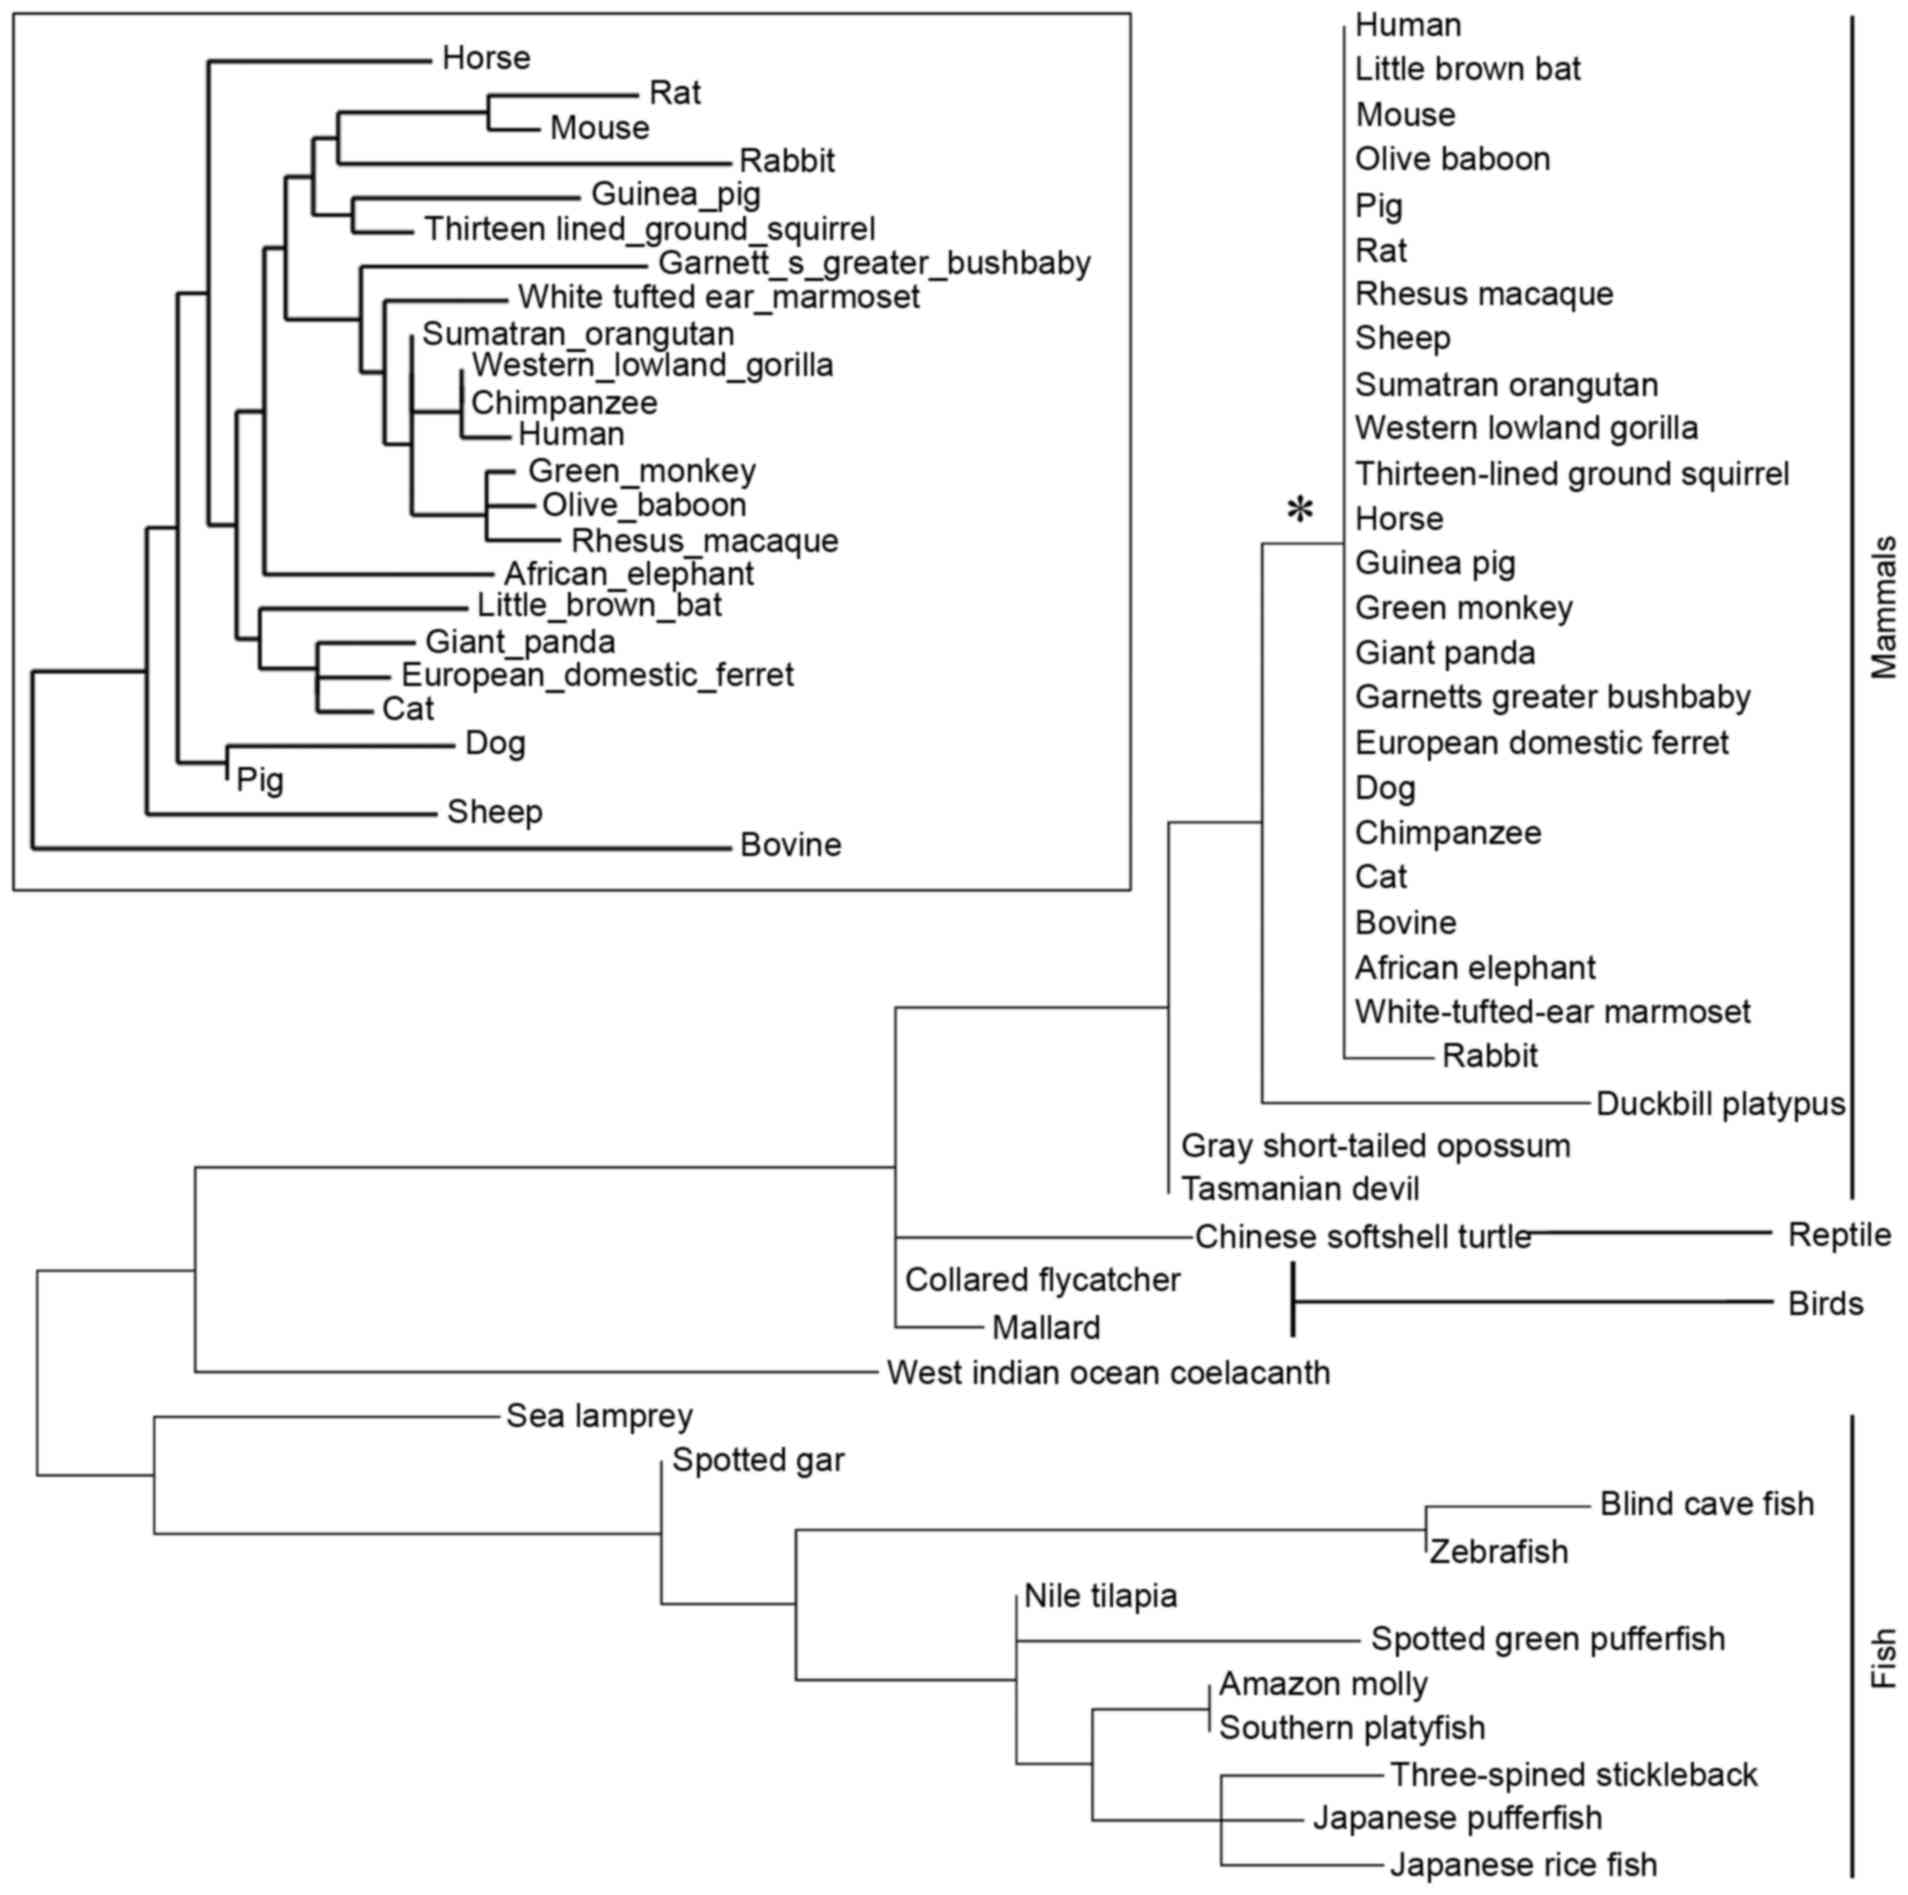
the NCBI database. The complete LGI3 gene products were identified
in 42 species, which belonged to vertebrates (phylum Chordata;
subphylum Vertebrata). The phylogenetic tree was constructed
according to the protein sequences of LGI3 (Fig. 1). The LGI3 protein from the
Mammalia class (mammals) formed a highly conserved cluster
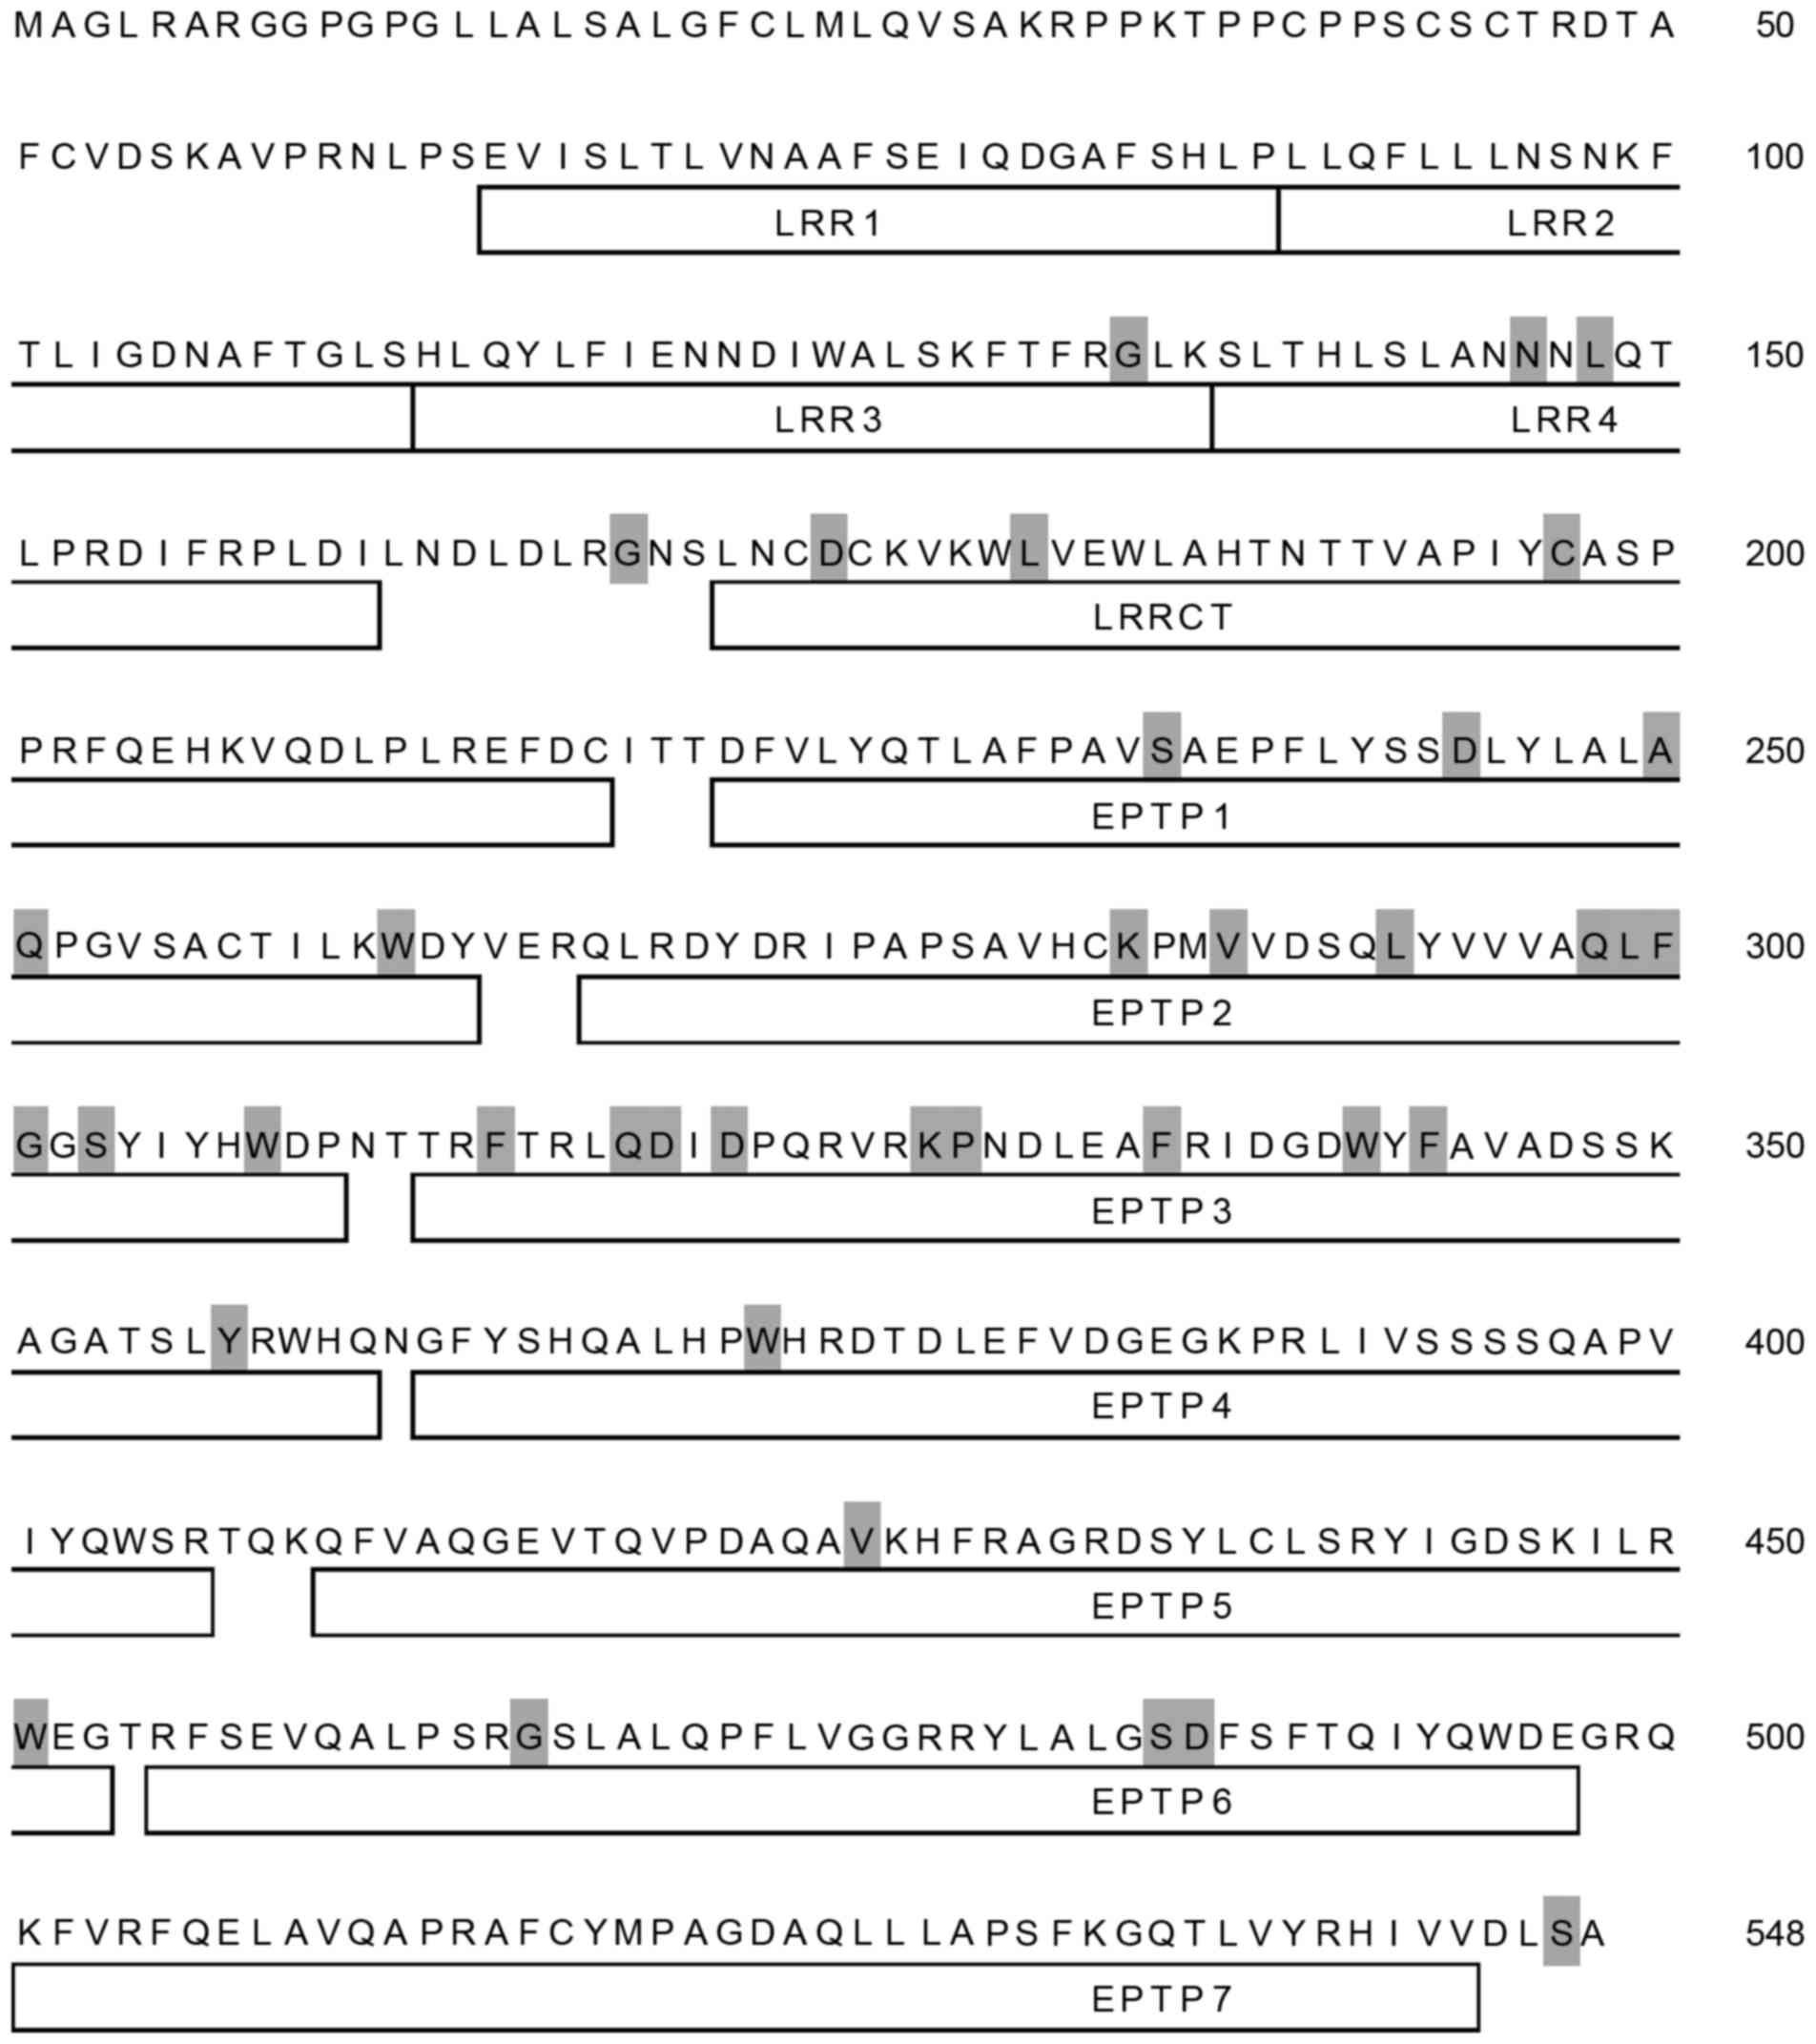
(Fig. 1). A total of 38 amino
acids residues of the LGI3 protein (548 amino acids) were identical
in all species analyzed (Fig. 2).
These conserved amino acids were distributed throughout all LGI3
protein domains, with the exception of the amino terminal region,
including the first and second leucine-rich repeats (LRRs) and the
carboxy terminal seventh epitempin (EPTP) domain.
Analysis of the phylogenetic tree of the LGI3
protein sequences may provide insight into the functionally
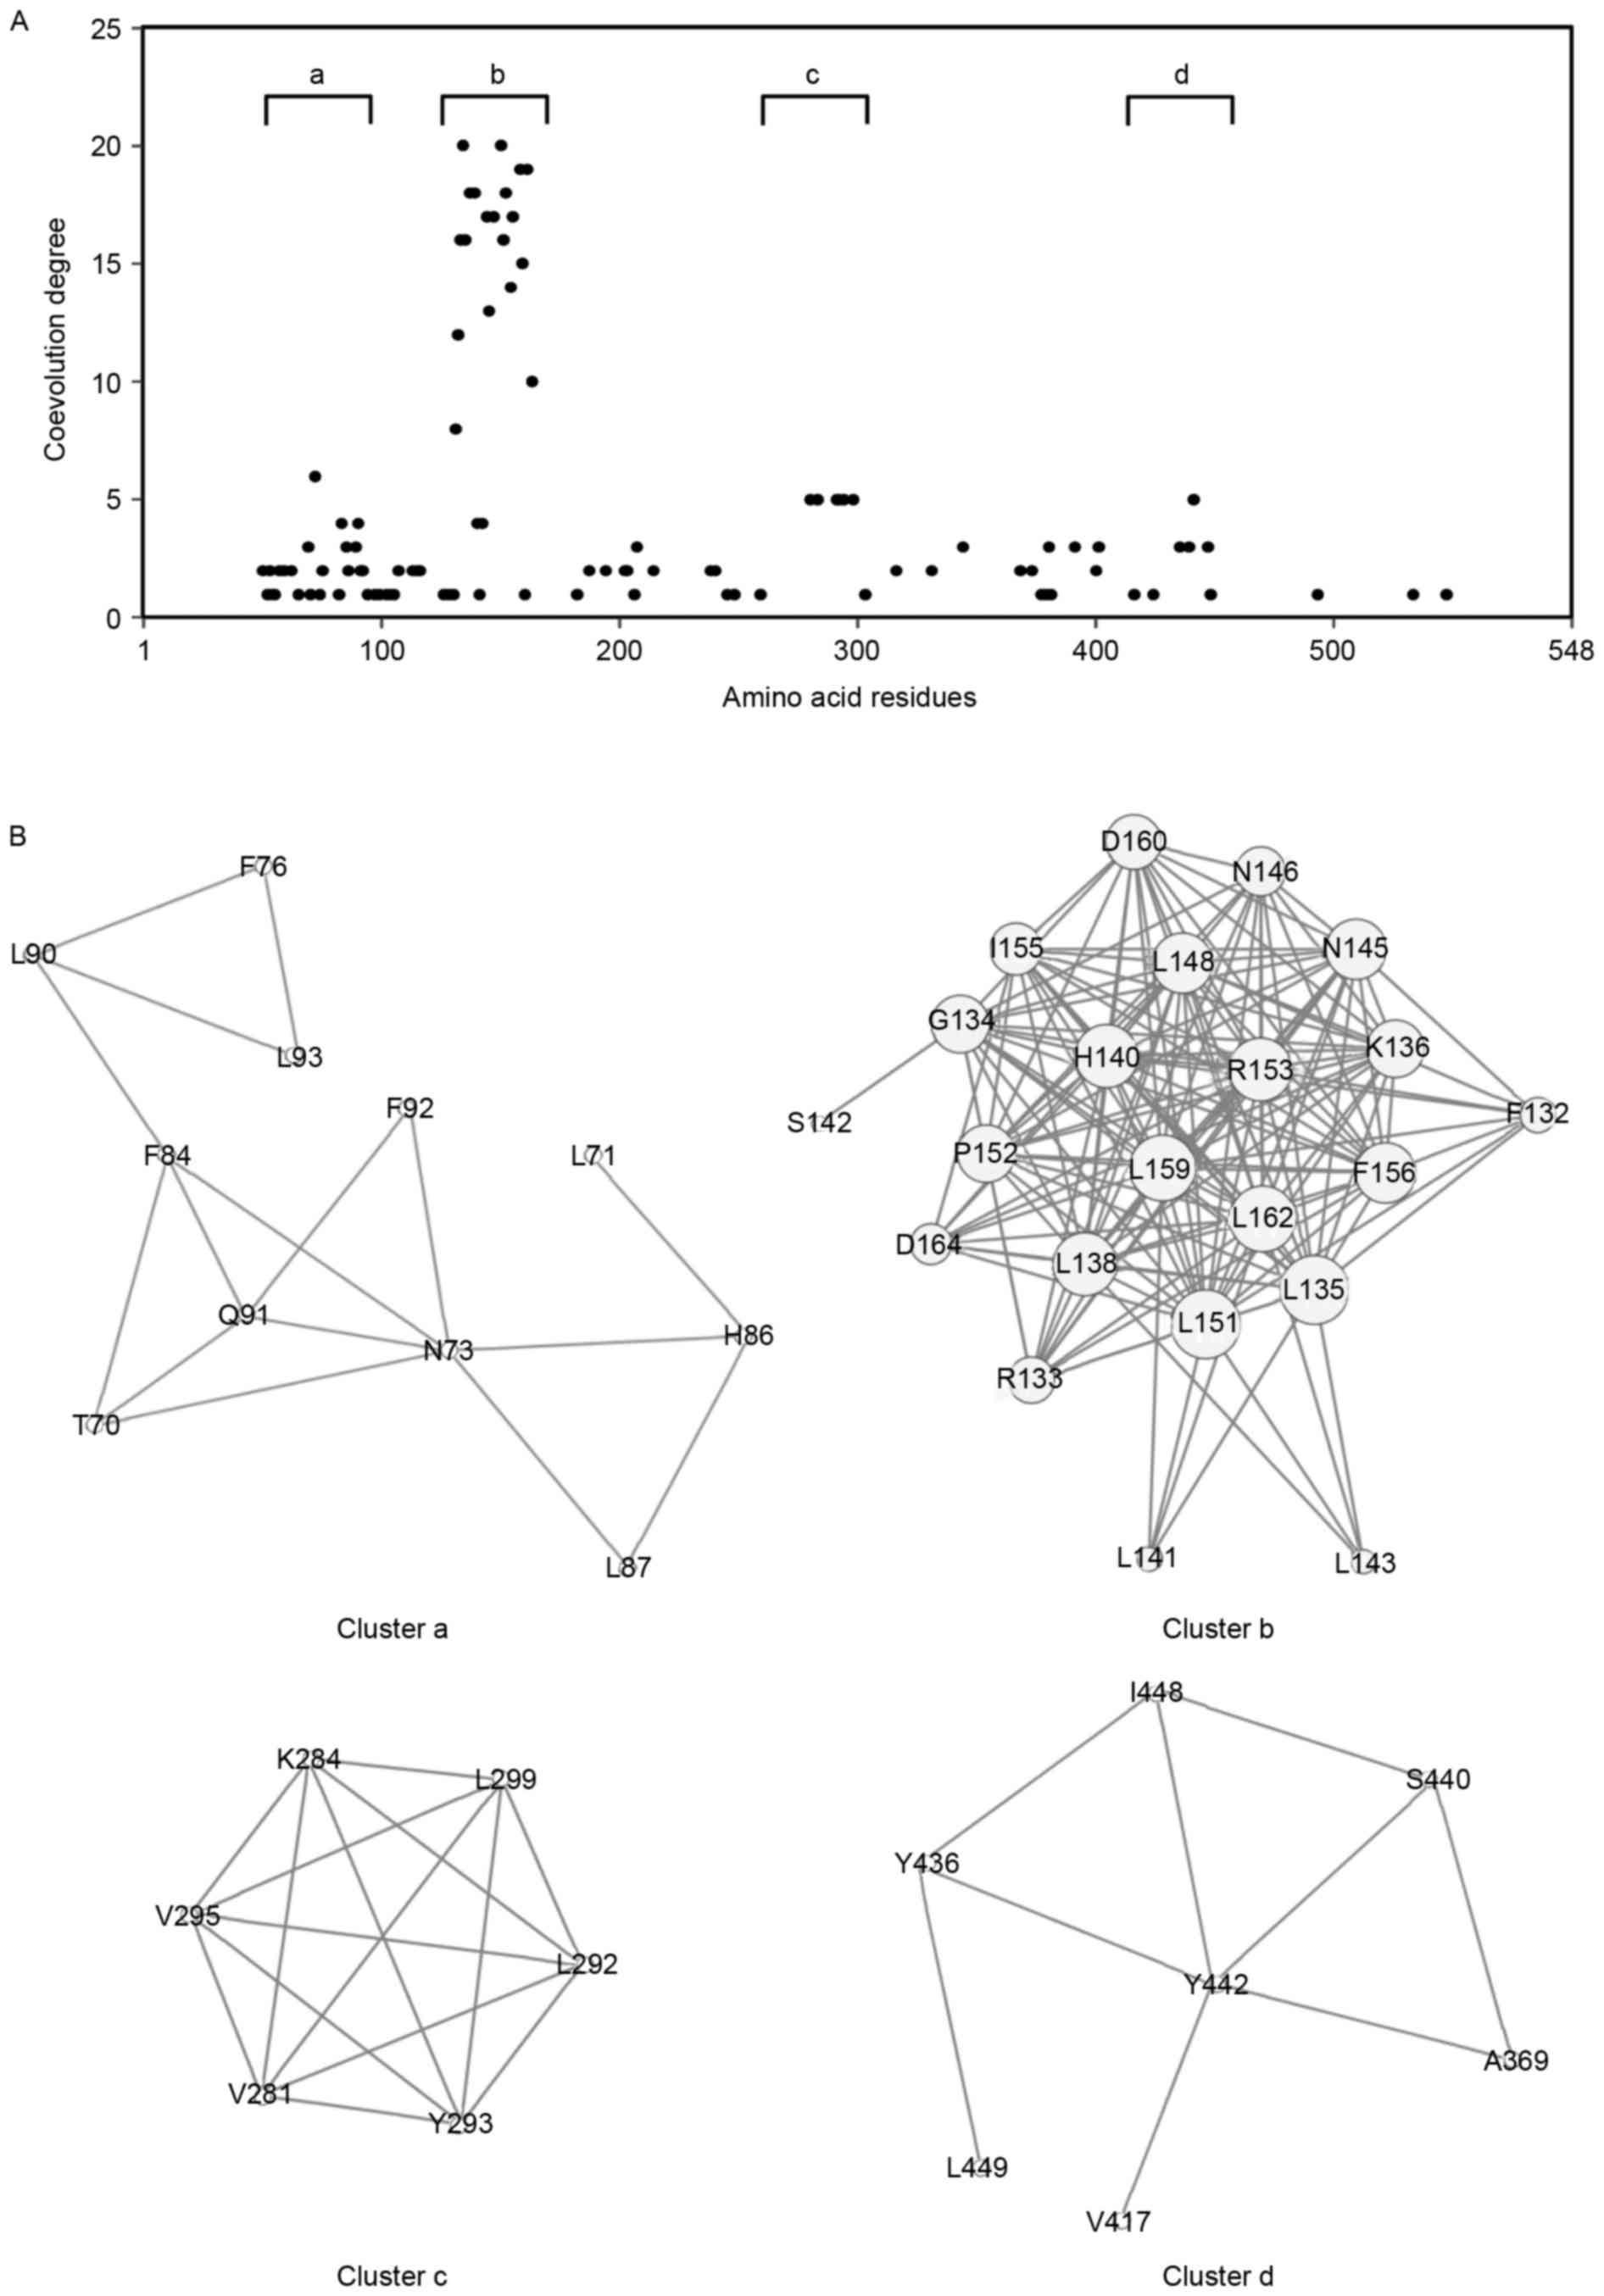
important residues and their variants in diseases. Coevolution
analysis was performed using the human LGI3 protein sequence as an
input and 55 orthologues, including 42 full-length sequences, in
CAPS software, which identifies coevolution between amino acid
residues. The results showed that 100 amino acid residues were
involved in coevolved amino acid pairs (Fig. 3A). The distribution of coevolution
degrees revealed four clusters with a high coevolution degree:
Cluster a, Thr70-Leu93; cluster b, Phe132-Asp164; cluster c,
Val281-Leu299; and cluster d, Ala369-Leu449 (Fig. 3B). The amino acids in cluster b
appeared to be highly coevolved, compared with those in the other
clusters. Cluster b corresponded predominantly to the fourth LRR
domain (LRR4; Fig. 2).
SNPs of the human LGI3 gene
A total of 1,042 SNPs were identified in the human
LGI3 gene from the Ensembl and NCBI SNP databases. The SNPs which
caused protein sequence variations were collected for comparative
analysis. These included 217 missense SNPs, five nonsense SNPs and
six frameshift SNPs. Of the 42 missense SNPs with known global MAF,
four SNPs had a global MAF of ≥0.001 (Table I). These SNPs were distributed in
the entire protein region, with the exception of the LRR2 domain
(residues 88–113). These SNPs included a conserved residue (Gly466;
Figs. 2 and 4) and three residues (Asn73, Gln204 and
Tyr241) shown to be coevolved in the vertebrate phylogeny (Figs. 3 and 4).
 | Table I.Functionally relevant SNPs of the
human leucine-rich glioma inactivated 3 gene. |
Table I.
Functionally relevant SNPs of the
human leucine-rich glioma inactivated 3 gene.
| Chromosome 8
position | ID | Type | SNP allele | SNP amino acid | Residue number | Global MAF |
|---|
| 22148237 | rs34112456 | Missense | A | Thr (T) | 524 | 0.0214 |
| 22156509 | rs571516031 | Missense | T | Ser (S) | 12 | 0.0170 |
| 22148657 | rs149352514 | Missense | A | Ser (S) | 384 | 0.0084 |
| 22151884 | rs199663838 | Missense | G | Arg (R) | 204 | 0.0020 |
| 22148609 | rs150255699 | Missense | A | Ile (I) | 400 | 0.0008 |
| 22154149 | rs146853993 | Missense | G | Ala (A) | 139 | 0.0008 |
| 22148200 | rs150789268 | Missense | T | Met (M) | 536 | 0.0006 |
| 22148372 | rs149918878 | Missense | T | Cys (C) | 479 | 0.0006 |
| 22148509 | rs113893603 | Missense | A | His (H) | 433 | 0.0006 |
| 22148341 | rs562289764 | Missense | C | Ser (S) | 489 | 0.0004 |
| 22151597 | rs377407416 | Missense | C | His (H) | 241 | 0.0004 |
| 22151854 | rs571880878 | Missense | A | Gln (Q) | 214 | 0.0004 |
| 22151891 | rs569108469 | Missense | T | Cys (C) | 202 | 0.0004 |
| 22148186 | rs573206061 | Missense | T | Tyr (Y) | 541 | 0.0002 |
| 22148236 | rs202037316 | Missense | T | Val (V) | 524 | 0.0002 |
| 22148333 | rs201040656 | Missense | G | Val (V) | 492 | 0.0002 |
| 22148410 | rs541459476 | Missense | A | Asp (D) | 466 | 0.0002 |
| 22148426 | rs559732127 | Missense | A | Thr (T) | 461 | 0.0002 |
| 22148437 | rs145000513 | Missense | T | Leu (L) | 457 | 0.0002 |
| 22148443 | rs115515473 | Missense | A | His (H) | 455 | 0.0002 |
| 22148519 | rs531970563 | Missense | T | Cys (C) | 430 | 0.0002 |
| 22148590 | rs568594233 | Missense | A | His (H) | 406 | 0.0002 |
| 22148622 | rs200322572 | Missense | G | Arg (R) | 395 | 0.0002 |
| 22148827 | rs143158388 | Missense | A | His (H) | 327 | 0.0002 |
| 22148833 | rs370352885 | Missense | A | His (H) | 325 | 0.0002 |
| 22148869 | rs559672591 | Missense | G | Arg (R) | 313 | 0.0002 |
| 22148872 | rs572016004 | Missense | T | Ile (I) | 312 | 0.0002 |
| 22151503 | rs201436266 | Missense | G | Cys (C) | 272 | 0.0002 |
| 22151519 | rs560898710 | Missense | T | Trp (W) | 267 | 0.0002 |
| 22151903 | rs138152858 | Missense | A | Thr (T) | 198 | 0.0002 |
| 22151983 | rs374479882 | Missense | T | Leu (L) | 171 | 0.0002 |
| 22151993 | rs371552621 | Missense | T | Trp (W) | 168 | 0.0002 |
| 22153990 | rs550303759 | Missense | G | Ala (A) | 158 | 0.0002 |
| 22154013 | rs568454198 | Missense | T | Ile (I) | 150 | 0.0002 |
| 22154155 | rs555889097 | Missense | C | Pro (P) | 137 | 0.0002 |
| 22154199 | rs184939949 | Missense | G | Ser (S) | 122 | 0.0002 |
| 22155450 | rs199694884 | Missense | A | Thr (T) | 74 | 0.0002 |
| 22155453 | rs544969538 | Missense | T | Tyr (Y) | 73 | 0.0002 |
| 22156358 | rs530550129 | Missense | G | Arg (R) | 62 | 0.0002 |
| 22156430 | rs200873593 | Missense | G | Arg (R) | 38 | 0.0002 |
| 22156469 | rs190789584 | Missense | C | Thr (T) | 25 | 0.0002 |
| 22156517 | rs538737490 | Missense | A | Asp (D) | 9 | 0.0002 |
Somatic mutations of LGI3 in
cancer
The search for somatic mutations of the human LGI3
gene with amino acid alterations was performed using the
Cbioportal, COSMIC and TCGA public databases. Mutations were found
in various types of cancer, including uterine, stomach, lung, head
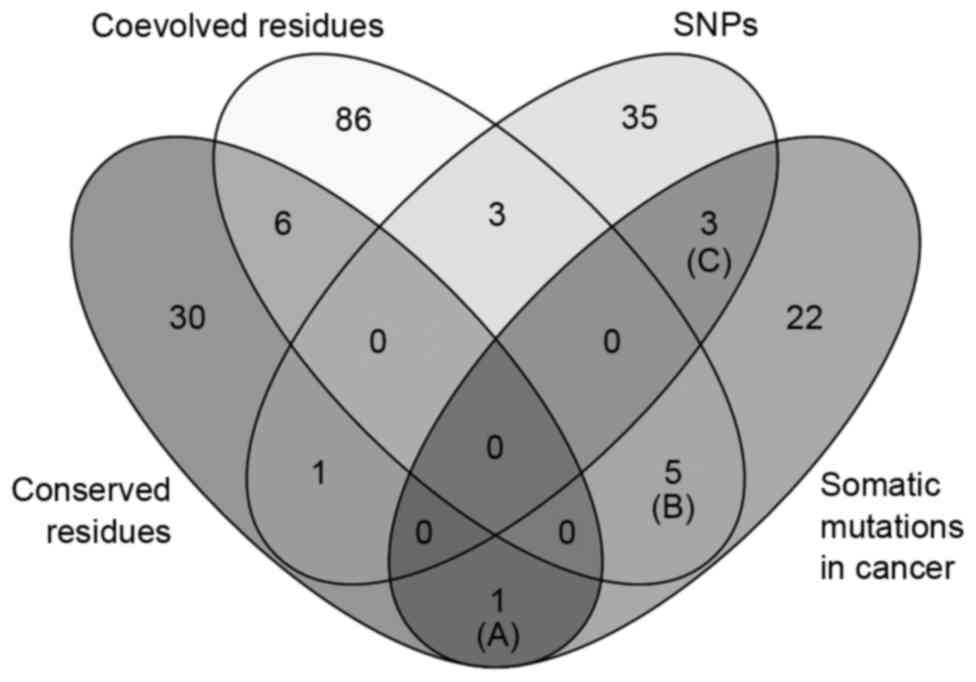
and neck, skin, liver and bladder cancer (Table II). Venn diagram analysis of the
amino acid variations in the four categories (conserved residues,
coevolved residues, SNPs and somatic mutations in cancer) showed
that a subgroup of somatic mutation sites in cancer belonged to
conserved residues (one residue), coevolved residues (five
residues) and SNPs (three residues), as shown in Fig. 4. The conserved residue (Gln319) was
mutated in stomach cancer (Fig. 4;
Table IIIA). The five coevolved
amino acids were found to be mutated in liver, uterine, bladder,
lung and thyroid cancer (Fig. 4;
Table IIIB). The three SNP minor
alleles were found in somatic mutations of stomach cancer and
melanoma (Fig. 4; Table IIIC).
| Table II.Somatic mutations of leucine-rich
glioma inactivated 3 in cancer tissues. |
Table II.
Somatic mutations of leucine-rich
glioma inactivated 3 in cancer tissues.
| Cancer study | Sample ID | Amino acid
change | Type | VAF (Normal) | VAF (Tumor) |
|---|
| Uterine (TCGA
pub) |
TCGA-D1-A17F-01 | X277_splice | Splice | NA | 0.42 |
| Uterine (TCGA
pub) |
TCGA-AP-A056-01 | G302S | Missense | NA | 0.41 |
| Uterine (TCGA
pub) |
TCGA-B5-A0JY-01 | F223V | Missense | NA | 0.37 |
| Uterine (TCGA
pub) |
TCGA-D1-A103-01 | S242F | Missense | NA | 0.37 |
| Uterine (TCGA
pub) |
TCGA-D1-A163-01 | R433C | Missense | NA | 0.37 |
| Uterine (TCGA
pub) |
TCGA-BG-A0M2-01 | K447R | Missense | NA | 0.32 |
| Uterine (TCGA
pub) |
TCGA-E6-A1LZ-01 | E237* | Nonsense | NA | 0.27 |
| Uterine (TCGA
pub) |
TCGA-AX-A05Z-01 | F92L | Missense | NA | 0.24 |
| Uterine (TCGA
pub) |
TCGA-B5-A0JY-01 | D210A | Missense | NA | 0.22 |
| Uterine (TCGA
pub) |
TCGA-B5-A11E-01 | S349F | Missense | NA | 0.17 |
| Uterine (TCGA
pub) |
TCGA-AP-A0LM-01 | D331N | Missense | NA | 0.12 |
| Uterine (TCGA
pub) |
TCGA-AP-A0LM-01 | A482T | Missense | NA | 0.11 |
| Uterine (TCGA) |
TCGA-D1-A17F-01 | X277_splice | Splice | NA | 0.42 |
| Uterine (TCGA) |
TCGA-AP-A056-01 | G302S | Missense | NA | 0.41 |
| Uterine (TCGA) |
TCGA-B5-A0JY-01 | F223V | Missense | NA | 0.37 |
| Uterine (TCGA) |
TCGA-D1-A103-01 | S242F | Missense | NA | 0.37 |
| Uterine (TCGA) |
TCGA-D1-A163-01 | R433C | Missense | NA | 0.37 |
| Uterine (TCGA) |
TCGA-BG-A0M2-01 | K447R | Missense | NA | 0.32 |
| Uterine (TCGA) |
TCGA-E6-A1LZ-01 | E237* | Nonsense | NA | 0.27 |
| Uterine (TCGA) |
TCGA-AX-A05Z-01 | F92L | Missense | NA | 0.24 |
| Uterine (TCGA) |
TCGA-B5-A0JY-01 | D210A | Missense | NA | 0.22 |
| Uterine (TCGA) |
TCGA-B5-A11E-01 | S349F | Missense | NA | 0.17 |
| Uterine (TCGA) |
TCGA-AP-A0LM-01 | D331N | Missense | NA | 0.12 |
| Uterine (TCGA) |
TCGA-AP-A0LM-01 | A482T | Missense | NA | 0.11 |
| Stomach (Pfizer
UHK) | pfg072T |
L159Wfsa4 | FS del | NA | 0.31 |
| Stomach (TCGA
pub) |
TCGA-FP-7829-01 | Q491H | Missense | NA | 0.53 |
| Stomach (TCGA
pub) |
TCGA-BR-8680-01 | T312A | Missense | NA | 0.50 |
| Stomach (TCGA
pub) |
TCGA-CD-A4MJ-01 | G302S | Missense | NA | 0.38 |
| Stomach (TCGA
pub) |
TCGA-BR-A4QL-01 | R327H | Missense | NA | 0.33 |
| Stomach (TCGA
pub) |
TCGA-HU-A4H3-01 | Q491R | Missense | NA | 0.22 |
| Stomach (TCGA
pub) |
TCGA-BR-6452-01 | R433H | Missense | NA | 0.19 |
| Stomach (TCGA
pub) |
TCGA-B7-5816-01 | R375H | Missense | NA | 0.16 |
| Stomach (TCGA
pub) |
TCGA-CG-4437-01 | R327H | Missense | NA | 0.15 |
| Stomach
(UTokyo) |
GC_313T-GC_313N | Q319K | Missense | NA | 0.12 |
| Lung adenocarcinoma
(TCGA pub) |
TCGA-44-2656-01 | E507* | Nonsense | NA | 0.19 |
| Lung adeno (TCGA
pub) |
TCGA-91-6829-01 | Q460L | Missense | NA | 0.16 |
| Lung adeno
(TCGA) |
TCGA-44-2656-01 | E507a | Nonsense | NA | 0.19 |
| Lung adeno
(TCGA) |
TCGA-91-6829-01 | Q460L | Missense | NA | 0.16 |
| Lung squ (TCGA
pub) |
TCGA-66-2795-01 | L117F | Missense | NA | 0.47 |
| Lung squ (TCGA
pub) |
TCGA-66-2785-01 | R430G | Missense | NA | 0.25 |
| Lung squ
(TCGA) |
TCGA-66-2795-01 | L117F | Missense | NA | 0.47 |
| Lung squ
(TCGA) |
TCGA-66-2785-01 | R430G | Missense | NA | 0.25 |
| Head and neck
(Broad) | HN_62854 | R514W | Missense | NA | 0.19 |
| Head and neck (TCGA
pub) |
TCGA-DQ-7588-01 | K56Rfsa13 | FS del | NA | 0.26 |
| Head and neck (TCGA
pub) |
TCGA-CQ-6228-01 | P276T | Missense | NA | 0.05 |
| Head and neck
(TCGA) |
TCGA-DQ-7588-01 | K56Rfsa13 | FS del | NA | 0.26 |
| Head and neck
(TCGA) |
TCGA-CQ-6228-01 | P276T | Missense | NA | 0.05 |
| Melanoma
(TCGA) |
TCGA-ER-A42K-06 | T46I | Missense | NA | 0.88 |
| Melanoma
(TCGA) |
TCGA-FW-A3R5-06 | R430C | Missense | NA | 0.31 |
| Melanoma
(TCGA) |
TCGA-FW-A3R5-06 | R406C | Missense | NA | 0.26 |
| Melanoma
(TCGA) |
TCGA-FS-A4FC-06 | R430C | Missense | NA | 0.22 |
| Liver (AMC) | H060607 | Y539N | Missense | NA | 0.27 |
| Liver (TCGA) |
TCGA-ED-A4XI-01 | G302D | Missense | NA | 0.18 |
| Liver (TCGA) |
TCGA-ES-A2HS-01 | Q91R | Missense | NA | 0.13 |
| Bladder (TCGA) |
TCGA-FD-A3SM-01 | Q525H | Missense | NA | 0.47 |
| Bladder (TCGA) |
TCGA-G2-A2EO-01 | D160H | Missense | NA | 0.13 |
| Breast (TCGA
2015) |
TCGA-AN-A0FJ-01 | D320E | Missense | NA | 0.34 |
| Breast (TCGA
2015) |
TCGA-D8-A1XQ-01 | A351V | Missense | NA | 0.11 |
| Thyroid (TCGA
pub) |
TCGA-EL-A3N3-01 | E215G | Missense | NA | 0.28 |
| Thyroid (TCGA) |
TCGA-EL-A3N3-01 | E215G | Missense | NA | 0.28 |
| DLBC (TCGA) |
TCGA-G8-6324-01 | A461T | Missense | NA | 0.46 |
| DLBC (TCGA) |
TCGA-FF-8046-01 | R514Q | Missense | 0.02 | 0.17 |
| Prostate
(SU2C) | SC_9097 | R314H | Missense | NA | 0.89 |
| chRCC (TCGA) |
TCGA-KN-8428-01 | A107T | Missense | NA | 0.13 |
| Table III.Somatic mutations of leucine-rich
glioma inactivated 3 in cancer tissues. |
Table III.
Somatic mutations of leucine-rich
glioma inactivated 3 in cancer tissues.
| A, Conserved
residues |
|---|
|
|---|
| Amino acid
change | Sample ID | Tissue | VAF |
|---|
| Q319K |
GC_313T-GC_313N | Stomach | 0.12 |
|
| B, Coevolved
residues |
|
| Amino acid
change | Coevolution
cluster | Sample
ID | Tissue | VAF |
|
| Q91R | Cluster a |
TCGA-ES-A2HS-01 | Liver | 0.13 |
| F92L | Cluster a |
TCGA-AX-A05Z-01 | Uterine | 0.24 |
| D160H | Cluster b |
TCGA-G2-A2EO-01 | Bladder | 0.13 |
| L117F | F108, Y116 |
TCGA-66-2795-01 | Lung | 0.47 |
| E215G | T188, F203 |
TCGA-EL-A3N3-01 | Thyroid | 0.28 |
|
| C, SNPs |
|
| Amino acid
change | SNP ID | Global
MAF | Sample
ID | Tissue | VAF |
|
| R327H | rs143158388 | 0.0002 |
TCGA-BR-A4QL-01 | Stomach | 0.33 |
| R327H | rs143158388 | 0.0002 |
TCGA-CG-4437-01 | Stomach | 0.15 |
| R433H | rs113893603 | 0.0006 |
TCGA-BR-6452-01 | Stomach | 0.19 |
| R430C | rs531970563 | 0.0002 |
TCGA-FW-A3R5-06 | Melanoma | 0.31 |
| R430C | rs531970563 | 0.0002 |
TCGA-FW-A4FC-06 | Melanoma | 0.22 |
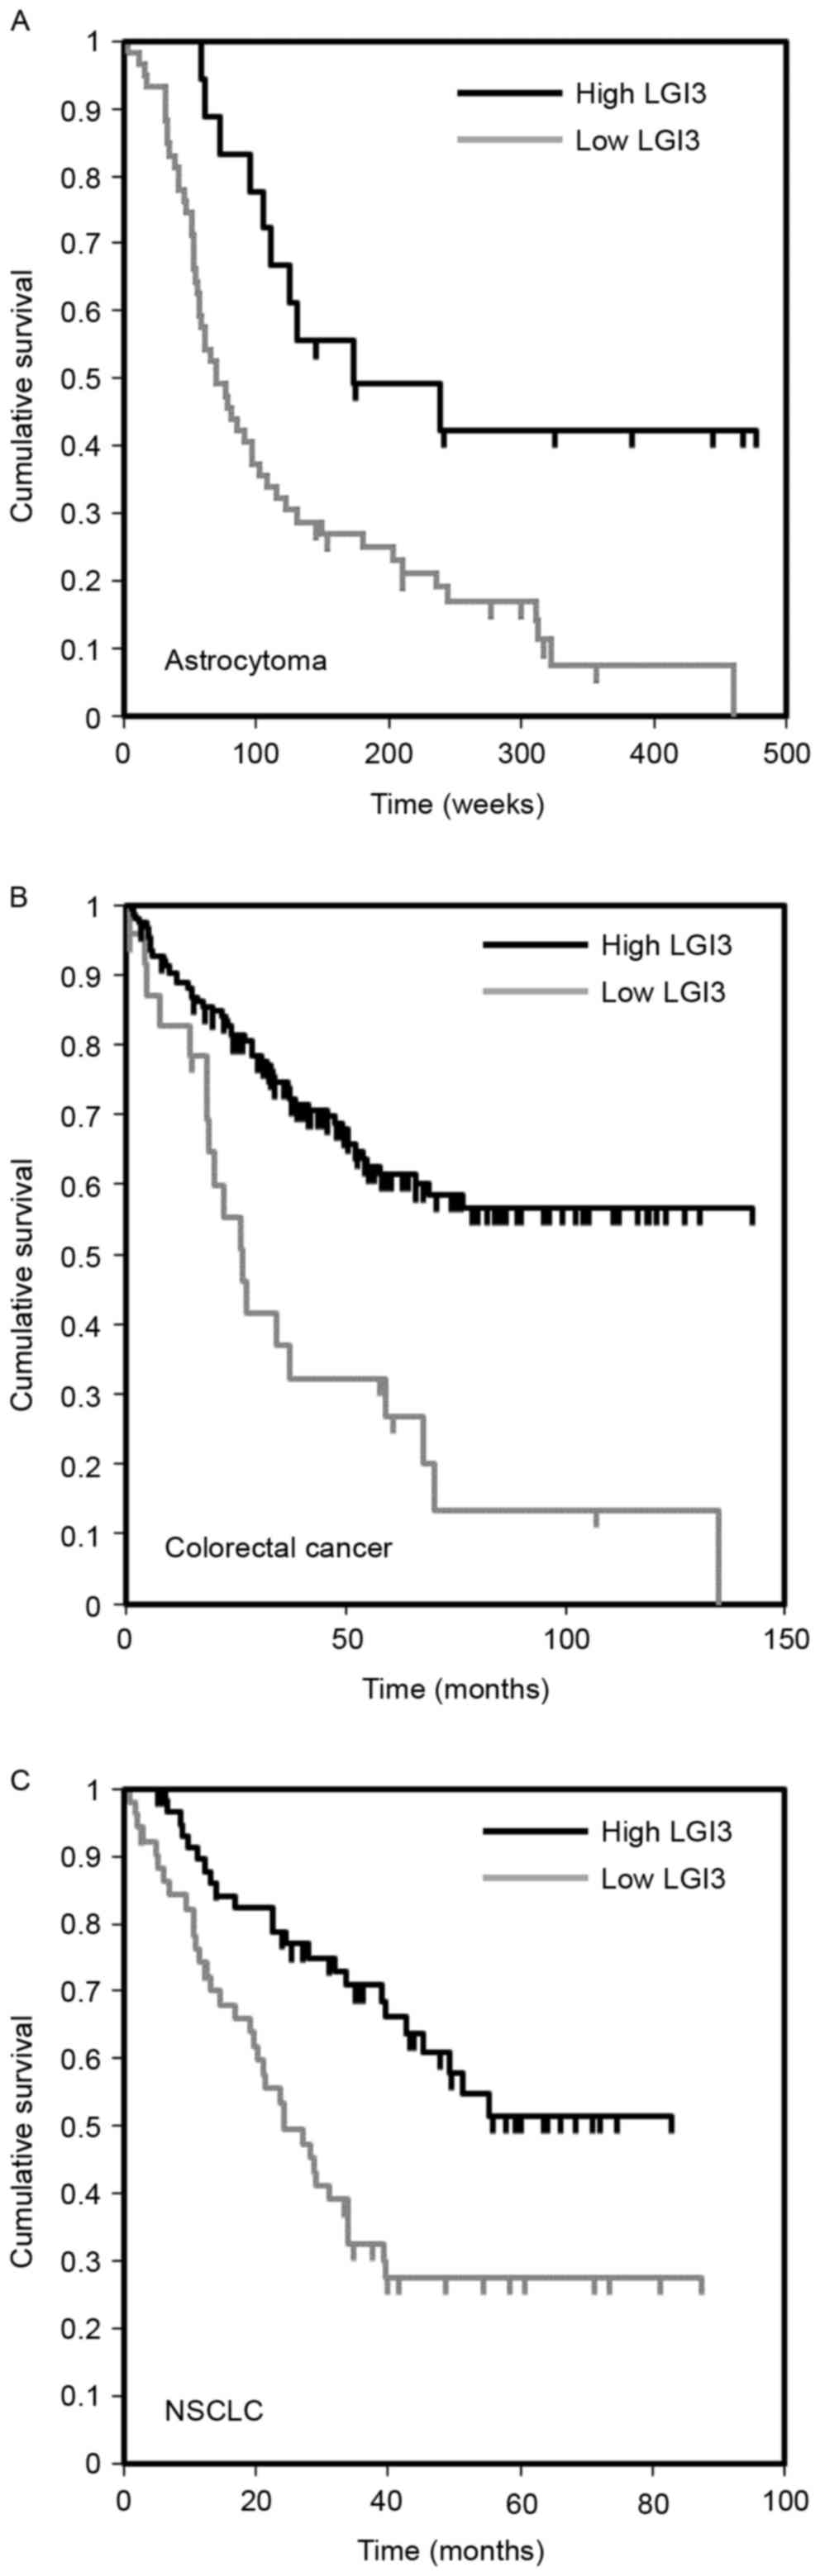
Prognostic significance of the
expression of LGI3 in cancer
A previous study reported that LGI3 is expressed in
various tumor cell lines (17). To
examine the significance of the expression of LGI3 in the prognosis
of cancer, the gene expression microarray datasets of cancer
patient cohorts were analyzed. The results revealed an association
between the expression level of LGI3 and cancer prognosis in brain
cancer (astrocytoma), colorectal cancer and non-small cell lung
cancer (Fig. 5A-C; Table IV). In these types of cancer
cohorts (18–21), a lower expression of LGI3 was
significantly correlated with poor patient survival rates (Fig. 5).
| Table IV.Dataset description of somatic
associations between expression microarray analyses of leucine-rich
glioma inactivated 3 and cancer prognosis. |
Table IV.
Dataset description of somatic
associations between expression microarray analyses of leucine-rich
glioma inactivated 3 and cancer prognosis.
| Dataset | Cancer | Subtype | Patients (n) | Cutoff point | P-value |
|---|
| GSE4271-GPL97 | Brain | Astrocytoma | 77 | 0.77 | 0.0457 |
| GSE17536 | Colorectal |
| 177 | 0.14 | 0.0007 |
| GSE3141 | Lung | NSCLC | 111 | 0.47 | 0.0147 |
Discussion
LGI3 is a member of the LGI protein family, which
consists of four secreted proteins (LGI1, 2, 3 and 4) (1,22).
Protein members of the LGI family are distinct in tissue
distribution and physiological function (22,23).
Our previous studies supported the roles of LGI3 as a cytokine in
adipose tissues and the skin (4–9). The
founding member of the LGI family, LGI1, was shown to be deficient
in malignant gliomas due to gene rearrangements and was suggested
to be a tumor suppressor gene (24). LGI protein members have been shown
to be differentially expressed in various tumor cell types,
including glioma, neuroblastoma, melanoma, colon cancer and breast
cancer (17). These results
indicated genetic alterations of these genes during tumorigenesis.
To examine the association between LGI3 and cancer, the present
study performed integrative analyses using phylogenetic and
coevolution analyses, combined with the analyses of genomic
variations and expression array data.
The phylogenetic tree of the LGI3 protein was
restricted to vertebrates and formed the class-specific clusters of
mammals, bird, reptiles and fish (Fig.
1). In particular, the highly conserved mammalian cluster of
LGI3 sequences supports the validity of mammalian model systems in
investigations of associations between cancer and LGI3 sequence
variations. Conserved amino acid residues were relatively frequent
in the EPTP2 and EPTP3 domains, suggesting their structural and
functional importance (Fig. 2).
Coevolution analysis revealed clusters with a high degree of
coevolution of amino acid residues (Fig. 3). These conserved or coevolved
residues may serve as crucial amino acids for the biologically
active, native protein structure. Conserved residues are often
found in global hinges in proteins, whereas coevolution propensity
is associated with substrate or ligand recognition sites (25). Although the structure and ligand
interactions of LGI3 protein remain to be fully elucidated, genetic
variations of the conserved and coevolved residues are predicted to
perturb its normal structure and function. Of 42 functionally
relevant SNPs with a known global MAF (Table I), one SNP residue (Gly466) at a
conserved residue and three SNPs (Asn73, Gln204 and Tyr241) at
coevolved residues were predicted to affect the structure and
function of LGI3.
The comparative analysis of somatic mutations in
cancer, amino acid sequence variations and coevolution revealed
eight somatic mutations, which occurred at coevolved or polymorphic
residues (Fig. 4). These variants
were found in various types of cancer (Table IIIB and C). All somatic mutations
at coevolved amino acids located in LRR domains, which are
predicted to be involved in protein-protein interactions for homo-
or heterodimerization (22,26).
As coevolved amino acids have been implicated in intramolecular
interactions and protein network formation (12,27),
functional investigations on variations of these amino acids may
provide insight into the involvement of LGI3 in tumorigenesis. All
SNPs with somatic mutations in stomach cancer and melanoma were
rare variants (global MAF <0.001). Rare SNPs are often
associated with cancer predisposition (28,29).
The expression of LGI3 is widespread in various
tissues, including the brain, lung, skin, adipose tissues, heart,
placenta, liver, muscle, kidney and pancreas (1,4,5,16).
Predominant expression and its functional elucidation has been
reported in the brain, adipose tissue and skin (3–5,9). A
previous report showed that LGI3 was expressed in glioma,
neuroblastoma, melanoma, colon cancer and breast cancer cells
(17). Among four LGI family
members, LGI3 was the only member expressed significantly in
gliomas, melanomas and neuroblastoma (17). The present study found that the
expression of LGI3 was associated with the prognosis of brain,
colorectal and lung cancer (Fig.
5). The expression levels of LGI3 in these types of cancer were
positively correlated with survival rates. This suggested that LGI3
may function as a suppressor of tumor progression. Somatic
mutations and associations between expression and prognosis were
found in lung cancer (Tables
IIIB and IV). LGI3 was shown
to transduce signals in its target cells through proteins
implicated in cancer, including ADAM23, Akt, β-catenin, focal
adhesion kinase, MDM2, p53, NF-κB and microphthalmia-associated
transcription factor (3,5,6,9,30–33).
Perturbation of these proteins by somatic mutations and the altered
expression of LGI3 may account for its role in the pathogenesis and
prognosis of cancer. These results warrant further investigations
on the correlation between LGI3 sequence variations, and the
expression and multiple clinical parameters of cancer.
Cytokine networks have important regulatory roles in
cancer and numerous cytokines are involved in inflammatory immune
responses to tumors (11,34). Cytokines are important in chronic
inflammation, which may lead to carcinogenesis (34). Obesity increases cancer risk
through cytokine perturbations by metabolic inflammation,
particularly in the liver, pancreas and gastrointestinal tract
(35). TNF-α and adiponectin have
been shown to be regulated by LGI3 in adipose tissues in obesity
(8,9) and associated with various types of
cancer (10,11). Diet-induced obesity has also been
shown to elevate TNF-α and local inflammation, which may promote
colorectal cancer and hepatocellular carcinoma (36). Adiponectin has been shown to be
inversely correlated with the risk of endometrial, breast, colon,
renal, gastric and prostate cancer (10). In conclusion, LGI3 may be involved
in the cytokine network involved in various types of cancer and
have a potential role in cancer prognosis.
Acknowledgements
This study was supported by the Basic Science
Research Program through the National Research Foundation of Korea
funded by the Ministry of Education (grant no.
NRF-2015R1D1A1A01056981).
References
|
1
|
Lee SE, Lee AY, Park WJ, Jun DH, Kwon NS,
Baek KJ, Kim YG and Yun HY: Mouse LGI3 gene: Expression in brain
and promoter analysis. Gene. 372:8–17. 2006. View Article : Google Scholar : PubMed/NCBI
|
|
2
|
Park WJ, Lee SE, Kwon NS, Baek KJ, Kim DS
and Yun HY: Leucine-rich glioma inactivated 3 associates with
syntaxin 1. Neurosci Lett. 444:240–244. 2008. View Article : Google Scholar : PubMed/NCBI
|
|
3
|
Park WJ, Lim YY, Kwon NS, Baek KJ, Kim DS
and Yun HY: Leucine-rich glioma inactivated 3 induces neurite
outgrowth through Akt and focal adhesion kinase. Neurochem Res.
35:789–796. 2010. View Article : Google Scholar : PubMed/NCBI
|
|
4
|
Kim HA, Park WJ, Jeong HS, Lee HE, Lee SH,
Kwon NS, Baek KJ, Kim DS and Yun HY: Leucine-rich glioma
inactivated 3 regulates adipogenesis through ADAM23. Biochim
Biophys Acta. 1821:914–922. 2012. View Article : Google Scholar : PubMed/NCBI
|
|
5
|
Lee SH, Jeong YM, Kim SY, Jeong HS, Park
KC, Baek KJ, Kwon NS, Yun HY and Kim DS: Ultraviolet B-induced LGI3
secretion protects human keratinocytes. Exp Dermatol. 21:716–718.
2012. View Article : Google Scholar : PubMed/NCBI
|
|
6
|
Jeong HS, Jeong YM, Kim J, Lee SH, Choi
HR, Park KC, Kim BJ, Baek KJ, Kwon NS, Yun HY and Kim DS:
Leucine-rich glioma inactivated 3 is a melanogenic cytokine in
human skin. Exp Dermatol. 23:600–602. 2014. View Article : Google Scholar : PubMed/NCBI
|
|
7
|
Jeong YM, Park WJ, Kim MK, Baek KJ, Kwon
NS, Yun HY and Kim DS: Leucine-rich glioma inactivated 3 promotes
HaCaT keratinocyte migration. Wound Repair Regen. 21:634–640. 2013.
View Article : Google Scholar : PubMed/NCBI
|
|
8
|
Kim HA, Kwon NS, Baek KJ, Kim DS and Yun
HY: Leucine-rich glioma inactivated 3 associates negatively with
adiponectin. Cytokine. 62:206–209. 2013. View Article : Google Scholar : PubMed/NCBI
|
|
9
|
Kim HA, Kwon NS, Baek KJ, Kim DS and Yun
HY: Leucine-rich glioma inactivated 3 and tumor necrosis factor-α
regulate mutually through NF-κB. Cytokine. 72:220–223. 2015.
View Article : Google Scholar : PubMed/NCBI
|
|
10
|
Dalamaga M, Diakopoulos KN and Mantzoros
CS: The role of adiponectin in cancer: A review of current
evidence. Endocr Rev. 33:547–594. 2012. View Article : Google Scholar : PubMed/NCBI
|
|
11
|
Lippitz BE: Cytokine patterns in patients
with cancer: A systematic review. Lancet Oncol. 14:e218–e228. 2013.
View Article : Google Scholar : PubMed/NCBI
|
|
12
|
Fares MA and McNally D: CAPS: Coevolution
analysis using protein sequences. Bioinformatics. 22:2821–2822.
2006. View Article : Google Scholar : PubMed/NCBI
|
|
13
|
Cerami E, Gao J, Dogrusoz U, Gross BE,
Sumer SO, Aksoy BA, Jacobsen A, Byrne CJ, Heuer ML, Larsson E, et
al: The cBio cancer genomics portal: An open platform for exploring
multidimensional cancer genomics data. Cancer Discov. 2:401–404.
2012. View Article : Google Scholar : PubMed/NCBI
|
|
14
|
Gao J, Aksoy BA, Dogrusoz U, Dresdner G,
Gross B, Sumer SO, Sun Y, Jacobsen A, Sinha R, Larsson E, et al:
Integrative analysis of complex cancer genomics and clinical
profiles using the cBioPortal. Sci Signal. 6:Pl12013. View Article : Google Scholar : PubMed/NCBI
|
|
15
|
Mizuno H, Kitada K, Nakai K and Sarai A:
PrognoScan: A new database for meta-analysis of the prognostic
value of genes. BMC Med Genomics. 2:182009. View Article : Google Scholar : PubMed/NCBI
|
|
16
|
Gu W, Wevers A, Schröder H, Grzeschik KH,
Derst C, Brodtkorb E, de Vos R and Steinlein OK: The LGI1 gene
involved in lateral temporal lobe epilepsy belongs to a new
subfamily of leucine-rich repeat proteins. FEBS Lett. 519:71–76.
2002. View Article : Google Scholar : PubMed/NCBI
|
|
17
|
Rossi MR, Huntoon K and Cowell JK:
Differential expression of the LGI and SLIT families of genes in
human cancer cells. Gene. 356:85–90. 2005. View Article : Google Scholar : PubMed/NCBI
|
|
18
|
Phillips HS, Kharbanda S, Chen R, Forrest
WF, Soriano RH, Wu TD, Misra A, Nigro JM, Colman H, Soroceanu L, et
al: Molecular subclasses of high-grade glioma predict prognosis,
delineate a pattern of disease progression, and resemble stages in
neurogenesis. Cancer Cell. 9:157–173. 2006. View Article : Google Scholar : PubMed/NCBI
|
|
19
|
Smith JJ, Deane NG, Wu F, Merchant NB,
Zhang B, Jiang A, Lu P, Johnson JC, Schmidt C, Bailey CE, et al:
Experimentally derived metastasis gene expression profile predicts
recurrence and death in patients with colon cancer.
Gastroenterology. 138:958–968. 2010. View Article : Google Scholar : PubMed/NCBI
|
|
20
|
Bild AH, Yao G, Chang JT, Wang Q, Potti A,
Chasse D, Joshi MB, Harpole D, Lancaster JM, Berchuck A, et al:
Oncogenic pathway signatures in human cancers as a guide to
targeted therapies. Nature. 439:353–357. 2006. View Article : Google Scholar : PubMed/NCBI
|
|
21
|
Wilkerson MD, Yin X, Hoadley KA, Liu Y,
Hayward MC, Cabanski CR, Muldrew K, Miller CR, Randell SH, Socinski
MA, et al: Lung squamous cell carcinoma mRNA expression subtypes
are reproducible, clinically important, and correspond to normal
cell types. Clin Cancer Res. 16:4864–4875. 2010. View Article : Google Scholar : PubMed/NCBI
|
|
22
|
Kegel L, Aunin E, Meijer D and Bermingham
JR: LGI proteins in the nervous system. ASN Neuro. 5:167–181. 2013.
View Article : Google Scholar : PubMed/NCBI
|
|
23
|
Kegel L, Jaegle M, Driegen S, Aunin E,
Leslie K, Fukata Y, Watanabe M, Fukata M and Meijer D: Functional
phylogenetic analysis of LGI proteins identifies an interaction
motif crucial for myelination. Development. 141:1749–1756. 2014.
View Article : Google Scholar : PubMed/NCBI
|
|
24
|
Chernova OB, Somerville RP and Cowell JK:
A novel gene, LGI1, from 10q24 is rearranged and downregulated in
malignant brain tumors. Oncogene. 17:2873–2881. 1998. View Article : Google Scholar : PubMed/NCBI
|
|
25
|
Liu Y and Bahar I: Sequence evolution
correlates with structural dynamics. Mol Biol Evol. 29:2253–2263.
2012. View Article : Google Scholar : PubMed/NCBI
|
|
26
|
Kobe B and Deisenhofer J: A structural
basis of the interactions between leucine-rich repeats and protein
ligands. Nature. 374:183–186. 1995. View
Article : Google Scholar : PubMed/NCBI
|
|
27
|
Tillier ER and Charlebois RL: The human
protein coevolution network. Genome Res. 19:1861–1871. 2009.
View Article : Google Scholar : PubMed/NCBI
|
|
28
|
Grin B, Loeb S, Roehl K, Cooper PR,
Catalona WJ and Helfand BT: A rare 8q24 single nucleotide
polymorphism (SNP) predisposes North American men to prostate
cancer and possibly more aggressive disease. BJU Int. 115:101–105.
2015. View Article : Google Scholar : PubMed/NCBI
|
|
29
|
Wu Q, Lu S, Wang L, Hu J, Qiao F, Qiu X,
Zhao C, Lao Y, Song Y and Fan H: DNMT3A rs36012910 A>G
polymorphism and gastric cancer susceptibility in a Chinese
population. Mol Biol Rep. 39:10949–10955. 2012. View Article : Google Scholar : PubMed/NCBI
|
|
30
|
Costa FF, Verbisck NV, Salim AC, Ierardi
DF, Pires LC, Sasahara RM, Sogayar MC, Zanata SM, Mackay A, O'Hare
M, et al: Epigenetic silencing of the adhesion molecule ADAM23 is
highly frequent in breast tumors. Oncogene. 23:1481–1488. 2004.
View Article : Google Scholar : PubMed/NCBI
|
|
31
|
Ji Z, Erin Chen Y, Kumar R, Taylor M,
Jenny Njauw CN, Miao B, Frederick DT, Wargo JA, Flaherty KT,
Jönsson G and Tsao H: MITF modulates therapeutic resistance through
EGFR signaling. J Invest Dermatol. 135:1863–1872. 2015. View Article : Google Scholar : PubMed/NCBI
|
|
32
|
Sulzmaier FJ, Jean C and Schlaepfer DD:
FAK in cancer: Mechanistic findings and clinical applications. Nat
Rev Cancer. 14:598–610. 2014. View
Article : Google Scholar : PubMed/NCBI
|
|
33
|
Uzdensky AB, Demyanenko SV and Bibov MY:
Signal transduction in human cutaneous melanoma and target drugs.
Curr Cancer Drug Targets. 13:843–866. 2013. View Article : Google Scholar : PubMed/NCBI
|
|
34
|
West NR, McCuaig S, Franchini F and Powrie
F: Emerging cytokine networks in colorectal cancer. Nat Rev
Immunol. 15:615–629. 2015. View
Article : Google Scholar : PubMed/NCBI
|
|
35
|
Font-Burgada J, Sun B and Karin M: Obesity
and cancer: The oil that feeds the flame. Cell Metab. 23:48–62.
2016. View Article : Google Scholar : PubMed/NCBI
|
|
36
|
Catalán V, Gómez-Ambrosi J, Rodríguez A
and Frühbeck G: Adipose tissue immunity and cancer. Front Physiol.
4:2752013. View Article : Google Scholar : PubMed/NCBI
|