Epithelial ovarian cancer is a heterogeneous group
of neoplasms that is divided into histological subgroups, each with
their own underlying molecular genetic events (1). The serous type of epithelial ovarian
cancer accounts for between 75 and 80% of epithelial ovarian
carcinomas; it is the most common type of ovarian cancer and is the
most life-threatening type of gynecological malignancy (2). However, relatively limited information
is known about the molecular genetics of the initiation and
progression of serous ovarian cancer (SOC).
Experimentally validated data have demonstrated that
differentially expressed genes and microRNAs (miRNAs/miRs) serve
key functions in the pathogenesis of SOC (1,3,4). Delineation of the underlying molecular
mechanisms involved in the initiation of SOC may increase
understanding of the pathogenesis of SOC, and may serve as the
theoretical basis of the development of novel diagnostic tests and
therapeutic strategies (2).
Transcription factors (TFs) and miRNAs are principal
regulators of gene expression (5).
TFs are specific proteins that may activate gene transcription
independently or indirectly (6). In
addition, TFs are primary and important factors that may promote or
suppress gene expression at the transcriptional level (7).
miRNAs are non-coding single-stranded RNAs of 22
nucleotides in length that constitute a novel class of gene
regulators. miRNAs affect the expression of genes at a
post-transcriptional level by binding to complementary sequences on
target mRNAs (8). A previous study
demonstrated that miRNAs control a variety of biological processes,
including cell differentiation, cell proliferation, apoptosis,
stress-resistance and fat metabolism (9). The study of the associations between
miRNAs and cancer has become an active topic in recent studies.
Genes that are regulated by miRNA are known as
target genes. miRNA affects the expression of proteins by
regulating target genes; therefore, identifying and validating
target genes of specific miRNAs may be a useful strategy for
developing novel treatments (10).
Host genes are a class of genes within which miRNAs are embedded
(11). A previous study revealed that
miRNAs are transcribed in parallel with host transcripts, and two
transcriptional classes of miRNAs, exonic and intronic, were
identified (12). Baskerville and
Bartel (13) demonstrated that
intronic miRNA and its host gene exhibit a close association.
miRNAs and host genes may cooperate to regulate a number of
biological functions; dysregulation of this system may affect the
development of cancer (14).
A number of genes and miRNAs have been demonstrated
to be expressed at different levels in SOC compared with healthy
tissue, but were identified in a dispersed form and not as part of
a regulatory network. Previous studies have focused on one or a
number of genes or miRNAs (1,3,4) In the
present study, all genes or miRNAs and the experimentally validated
associations between these molecules, including miRNA gene
targeting, TF regulation of miRNAs and miRNAs located in host
genes, were analyzed. Three regulatory networks were constructed: A
differentially expressed network, a related network and a global
network. Except for host genes, all genes and miRNAs in the
differentially expressed network were differentially expressed. The
signaling pathways in the differentially expressed network were
extracted and compared in three networks to reveal the pathogenesis
of SOC. In addition, the upstream and the downstream elements of
the differentially expressed genes and miRNAs in three networks
(which include genes, miRNAs and targets) were analyzed, and focus
was placed on the similarities and differences between these
elements to identify key elements that may affect the development
of SOC.
All SOC data selected were obtained from databases
and relevant studies. The National Center for Biotechnology
Information (NCBI) database (http://www.ncbi.nlm.nih.gov/gene) was used to ensure
each miRNA and gene was referred to by its official name only. The
experimentally validated dataset of human miRNAs and the
corresponding target genes were selected from the Tarbase
(diana.imis.athena-innovation.gr/DianaTools/index.php?r=tarbase/index)
(15), miRTarBase (mirtarbase.mbc.nctu.edu.tw) (16) and miRecords (c1.accurascience.com/miRecords) (17), and the dataset were termed set U1. Due
to increasing interest on the interactions between miRNAs and human
TFs, the dataset from TransmiR, a manually built database of
TF-miRNA-regulating associations (http://www.cuilab.cn/transmir), was selected, and the
dataset was termed set U2. The host genes of human miRNAs were
selected from NCBI and miRbase (http://www.mirbase.org/) (18), and the dataset were termed set U3.
Differentially expressed genes of SOC were selected primarily from
relevant studies (cited below where appropriate) and a limited
number were selected from the NCBI Single Nucleotide Polymorphism
database, and the dataset of differentially expressed genes were
termed U4. Differentially expressed miRNAs of SOC were primarily
selected from mir2Disease (http://www.mir2disease.org/) (19) and relevant studies (20–75), and
this dataset were termed set U5. Similarly, the SOC-related miRNAs
were primarily selected from relevant studies (20–75) and
this dataset were termed set U7.
The SOC-associated genes were selected through three
different methods. A number of SOC-associated genes were selected
from the GeneCards database (http://www.genecards.org) and others were identified
in relevant studies (20–75). In addition, there are 31 TFs predicted
using the P-match method and were considered to be SOC-associated
genes. The UCSC database (genome.ucsc.edu) (76)
was used to download the 1,000-nt promoter region sequences of the
targets of differentially expressed miRNAs, which were used as the
input to predict the TFs and miRNAs they regulate. The P-match
method combines pattern matching and weight matrix approaches
(77). P-match was used in the
present study to identify transcription factor binding sites
(TFBSs) in 1,000 nt promoter region sequences and map TFBSs onto
promoter region of targets. The matrix library of P-match comes
from the TRANScription FACtor database (78), which enables a large variety of
different TF binding sites to be searched. The dataset of the
SOC-associated genes was termed set U6.
The following three regulatory networks of SOC were
constructed: The differentially expressed network, the related
network and the global network. The differentially expressed
network contained the key elements and pathways and was considered
the core network. All associations between TFs, miRNAs, target
genes and host genes were combined to construct the global network.
All associations between differentially expressed miRNAs and the
corresponding host genes in the set U3 were included in the
differentially expressed network. All differentially expressed
genes and differentially expressed miRNAs were mapped to the global
network and their associations were combined. These associations
also belong to differentially expressed network. The two parts of
these associations were combined to obtain the differentially
expressed network. Using the same method as that used for the
related elements, the related network was constructed. Cytoscape
software (version 3.0.0; Institute for Systems Biology, Seattle,
WA, USA) was used to present the network graphically and in order
to analyze the regulatory pathways more easily.
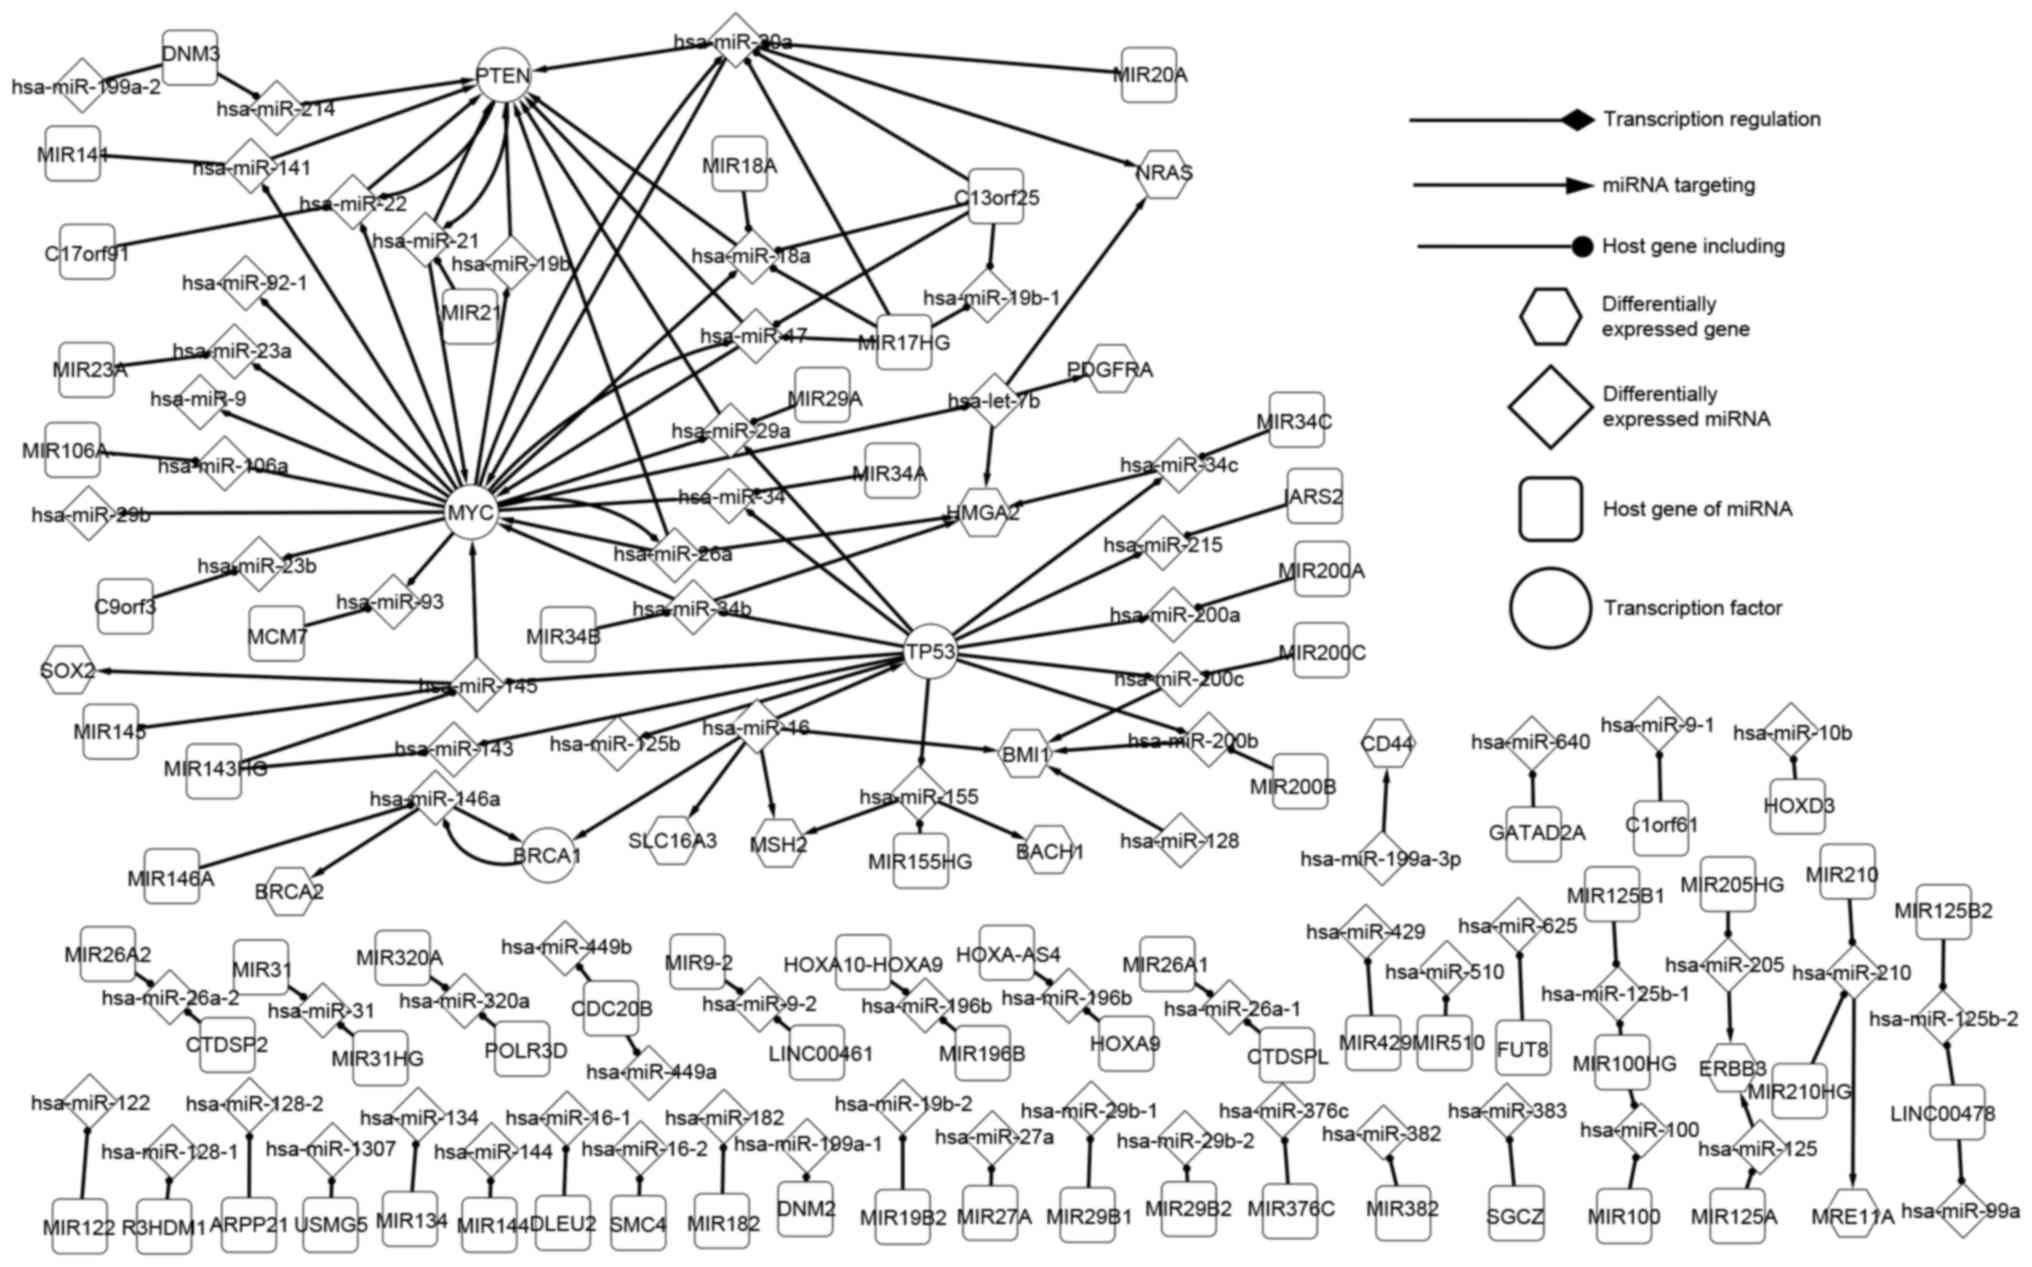
The differentially expressed network is the core SOC
network because, except for host genes, all elements were
differentially expressed. As such, the differentially expressed
network is the core network, which may reveal the pathogenic
mechanism of SOC. This network consisted of four TFs [BRCA1, DNA
repair associated (BRCA1), MYC proto-oncogene, bHLH transcription
factor (MYC), phosphatase and tensin homolog (PTEN) and tumor
protein p53 (TP53)], 12 differentially expressed genes (which are
targets of miRNA), 65 miRNAs and 72 host genes. As presented in
Fig. 1, the essential regulatory
associations between significant factors were observed. The network
was composed of three associations, including TFs regulating
miRNAs, miRNAs targeting target genes and miRNAs located in host
genes. In the differentially expressed network, a number of data
linkages present special characteristics and, when SOC emerges, the
network balance may be broken. The linkages between elements may
provide information of the regulatory associations of SOC.
The SOC-related network included differentially
expressed genes and miRNAs and associated genes and miRNAs. As can
be observed in Fig. 1, the
differentially expressed network is part of the related network
because the SOC-related network contains an increased number of
elements and pathways, which may influence the development of SOC,
and it is complicated compared with the differentially expressed
network. In the related network, there were 38 TFs including 4
differentially expressed TFs, 110 miRNAs and a number of targets of
miRNAs. Due to the complexity of the related network, primary focus
was placed on the regulatory associations between differentially
expressed elements and associated elements.
The present study found that MYC, a differentially
expressed gene, regulates 2 SOC-associated miRNAs (hsa-let-7a and
hsa-miR-146a) in the related network. In the differentially
expressed network, hsa-miR-34c targeted HMGA2. hsa-miR-34c targets
3 genes in the related network, enhancer of zeste 2 polycomb
repressive complex 2 subunit (EZH2), MYB proto-oncogene like 2
(MYBL2) and B cell lymphoma 2. It has been suggested that miR-34c
may suppress the expression of EZH2 and MYBL2 in SOC (79). Hsa-miR-31 is a differentially
expressed miRNA in SOC (81). In the
differentially expressed network, hsa-miR-31 is only located in 2
host genes. No genes regulate hsa-miR-31 and it target no genes;
however, in the related network, it targets several genes.
Creighton et al (81)
identified that functional overexpression of miR-31, the most
under-expressed miRNA in serous ovarian cancer, repressed predicted
miR-31 gene targets including the cell cycle regulator E2F2, miR31
and cyclin dependent kinase inhibitor 2A. Furthermore, miR-31
overexpression may affect many genes underlying SOC disease
progression (81). Without
differentially expressed factors, the regulatory associations
between elements may influence the tumorigenesis of SOC. Yang et
al (82) suggested that miR-506
expression was associated with decreased Snail family
transcriptional repressor 2 and vimentin, elevated
epithelial-cadherin, and improved prognosis for patients with SOC.
The related network enables the underlying molecular mechanism of
SOC to be explored.
A global network is an experimentally validated
biological network in the human body, which contains all the
experimentally validated interactions between miRNAs and genes.
Therefore, the differentially expressed and the related networks
were included in the global network. The global network was used as
the reference when the two other networks were constructed and
studied.
If miRNAs were differentially expressed, their
corresponding host genes were considered to be differentially
expressed genes, as mutation of the host gene may make the miRNAs
located within it similarly differentially expressed. The host
genes and corresponding miRNAs demonstrate important
characteristics. A host gene includes a number of miRNAs that
target genes, either alone or together. MIR17HG is a cluster host
gene that includes four miRNAs (hsa-miR-17, hsa-miR-18a,
hsa-miR-19b-1 and hsa-miR-20a), of which three (hsa-miR-17,
hsa-miR-18a, hsa-miR-20a) together target PTEN (Fig. 1). Furthermore, the three miRNAs are
regulated by MYC. Therefore, miRNA may locate in several host
genes. In addition, hsa-miR-20a and hsa-miR-18a locate in MIR20A
and MIR18, respectively. Hsa-miR-31 locates in MIR31 and MIR31HG
(Fig. 1). It has been hypothesized
that overexpression of miR-31 results in decreased cell
proliferation, clonogenic potential, cell migration and invasion in
SOC (83). Hsa-miR-21 and hsa-miR-22,
which form a self-adaption association with PTEN locate in MIR21
and C17orf91, respectively (Fig.
1).
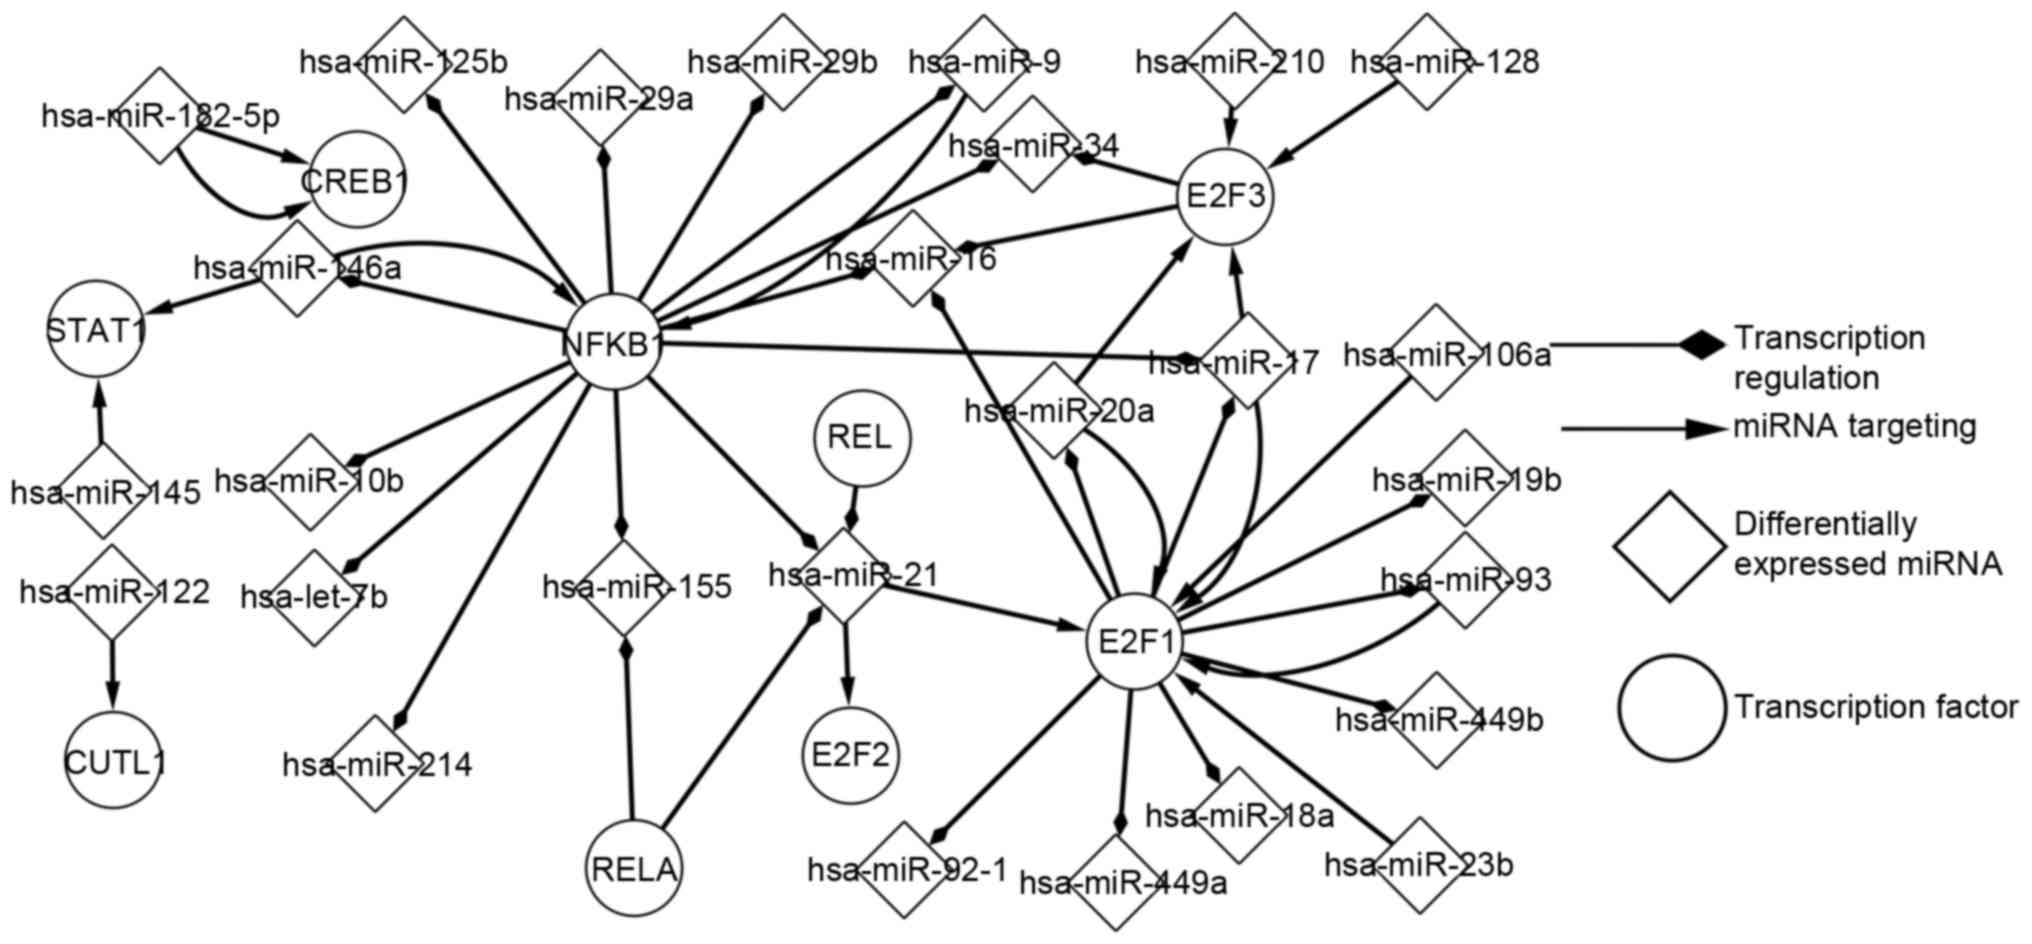
Using the P-match algorithm enabled the predicted
TFs to be determined. Regulatory associations between predicted TFs
and differentially expressed miRNAs were analysed (Fig. 2). As presented in Fig. 2, E2F1 and nuclear factor-κB subunit 1
(NFKB1) were identified to be more marked, compared with other
elements, in the development of SOC. E2F1 regulates 10 miRNAs and
it is regulated by 6 miRNAs. NFKB1 regulates 13 miRNAs and it is
regulated by 2 miRNAs. The differential expression of a miRNA may
indirectly influence a different miRNA, by targeting TFs; for
example, hsa-miR-128 targets E2F3, which regulates hsa-miR-34.
Similarly, the differential expression of a predicted TF may
indirectly influence a predicted TF, by regulating a differentially
expressed miRNA. Additionally, this network consisted of a number
of FBLs; for instance, E2F1 separately forms FBLs with
hsa-miR-106a, hsa-miR-20a, hsa-miR-17 and hsa-miR-93. NFKB1
separately form FBLs with hsa-miR-9 and hsa-miR-146a. In addition,
CAMP responsive element binding protein 1 and hsa-miR-182-5p form
FBLs. The transcription network of predicted TFs and miRNAs is
important for the analysis of the pathogenesis of SOC.
In order to analyze the network of SOC, the focus
was placed on the core elements and adjacent nodes. The upstream
and downstream elements of differentially expressed genes, miRNAs
and predicted TFs in three networks (differentially expressed
network, related network and global network), were extracted and
listed separately to analyze the characteristics.
The precursors and successors of differentially
expressed genes are listed in three levels. The precursors are
miRNAs that target genes and the successors are miRNAs that are
regulated by genes. PTEN and MYC are the much more marked compared
with other genes. As presented in Table
I, the upstream and downstream elements of MYC and the
regulatory associations were observed (some miRNAs in the global
network are omitted as they are not associated with SOC). MYC has 6
types of adjacent nodes (three successors and three predecessors).
In the differentially expressed network, 6 miRNAs target MYC, MYC
regulates 17 miRNAs, and hsa-miR-17, hsa-miR-20a and hsa-miR-26a
separately form FBLs with MYC. In the related network, seven miRNAs
target MYC and MYC regulates 18 miRNAs. In the global network, 19
miRNAs target MYC which regulates 57 miRNAs. The precursors may
regulate successors indirectly by influencing MYC. For example, the
mutation of hsa-miR-21 may influence the expression of hsa-miR-18a
by up- or downregulating the expression of MYC. As presented in
Fig. 1, MYC may influence the
expression of a number of other genes by regulating its successors.
MYC regulates hsa-miR-20a and hsa-miR-20a targets neuroblastoma RAS
viral oncogene homolog (NRAS); therefore, MYC may affect NRAS. BMI1
only has 3 types of predecessors and it does not regulate any
miRNA; therefore, BMI1 may be the last actor in the network of
SOC.
Similarly, the pathways of each differentially
expressed miRNA were extracted, compared and analyzed in the same
way to the method by which the regulatory pathways of
differentially expressed genes were analyzed. The precursors and
successors of differentially expressed miRNAs were listed in three
levels. To describe the results, hsa-miR-17 is used as an example.
Table II presents the upstream and
downstream elements of hsa-miR-17 and the regulatory associations.
In the differentially expressed network, it was indicated that MYC
regulates hsa-miR-17 and hsa-miR-17 targets PTEN and MYC. In
addition, hsa-miR-17 and MYC form FBLs. In the related network, six
more genes regulate hsa-miR-17, which itself targets 14 more genes.
Cyclin D1 (CCND1) and E2F1 separately form FBLs with hsa-miR-17 in
the related network, and CCND1 and E2F1 are TFs in the related
network. Therefore, it is indicated that the mutation of hsa-miR-17
may influence a number of other elements. In the global network,
there are 12 genes regulating hsa-miR-17 which, itself, targets 47
genes. The results of the present study suggested that hsa-miR-17
is a crucial miRNA in the progression of SOC. hsa-miR-128 deserves
more attention because it is not regulated by any gene. That is to
say hsa-miR-128 is the ‘starter’ in the network of SOC (it
regulates elements but is not regulated by elements in the SOC
network) and it is the switch of SOC. The regulation of those
switches would be a notable issue.
The same method as that used to analyze the
regulatory pathways of differentially expressed genes was used to
extract, compare and analyze the pathways of TFs predicted using
the P-match method in SOC. The miRNAs associated with these TFs
were listed in three networks and not all TFs have precursors and
successors. Here, the focus is on NFKB1 as a representative example
because its precursors and successors are uniformly distributed in
three networks. Table III presents
the upstream and downstream elements of hsa-miR-17 and the
regulatory associations. In the differentially expressed network, 2
miRNAs target NFKB1, NFKB1 regulates 13 miRNAs, and hsa-miR-146a
and hsa-miR-9 separately form FBLs with NFKB1. In the related
network, NFKB1 only regulates one additional miRNA compared with
the differentially expressed network. In the global network, NFKB1
was the target of 8 miRNAs and it regulates 34 miRNAs. The results
of the present study indicated that NFKB1 exhibits an increased
likelihood to influence the development of SOC. A number of TFs,
including E2F4, do not have precursors or successors and these TFs
exhibit small effects on the development of SOC.
In the present study, differentially expressed
genes, differentially expressed miRNAs, TFs predicted using the
P-match method and the interactions between them were focused on.
From the aforementioned networks, a number of signaling pathways
include ≥3 elements. For example, hsa-miR-16 targets TP53 and TP53
regulates hsa-miR-29a. All these pathways have important functions
in SOC as elements within them are differentially expressed in SOC,
but some pathways are only proposed notionally and their functions
remain unclear in SOC. In other types of carcinoma, miRNAs serve a
key role; for example, in human breast cancer, miR-145 exhibited a
pro-apoptotic effect, dependent on TP53 activation, and that TP53
activation may, in turn, stimulate miR-145 expression (84). Data from the present study suggests
that TFs that are predicted using the P-match method exhibit
potential associations with differentially expressed miRNAs.
However, whether they are closely associated with SOC remains
unknown.
In conclusion, the present study constructed 3
regulatory networks, the differentially expressed network, the
related network and the global network, to analyze the associations
between genes and miRNAs in SOC. Certain signaling pathways and
elements were highlighted to analyze the potential regulation
mechanism of SOC. The results of the present study identified
pathways associated with SOC and may be used to assist gene therapy
of SOC. The function of a number of elements and signaling pathways
remain unknown.
The present study was supported by the Science and
Technology Development Project of Jilin Province (grant no.
20160414009GH), the National Natural Science Foundation of China
(grant nos. 61300147 and 61472159), the China Postdoctoral Science
Foundation (grant no. 2014M551185), the Electronic Commerce
Engineering Laboratory Project of Jilin Province (grant no.
2014N143), the Science and Technology Program of Changchun (grant
no. 14GH014), the Premier-Discipline Enhancement Scheme supported
by Zhuhai Government and the Premier Key-Discipline Enhancement
Scheme supported Guangdong Government Funds.
|
1
|
Nam EJ, Yoon H, Kim SW, Kim H, Kim YT, Kim
JH, Kim JW and Kim S: microRNA expression profiles in serous
ovarian carcinoma. Clin Cancer Res. 14:2690–2695. 2008. View Article : Google Scholar : PubMed/NCBI
|
|
2
|
Singer G, Kurman RJ, Chang HW, Cho SK and
Shih IeM: Diverse tumorigenic pathways in ovarian serous carcinoma.
Am J Pathol. 160:1223–1228. 2002. View Article : Google Scholar : PubMed/NCBI
|
|
3
|
Soussi T and Béroud C: Assessing TP53
status in human tumours to evaluate clinical outcome. Nat Rev
Cancer. 1:233–240. 2001. View
Article : Google Scholar : PubMed/NCBI
|
|
4
|
Yu Z, Kim J, He L, Creighton CJ, Gunaratne
PH, Hawkins SM and Matzuk MM: Functional analysis of miR-34c as a
putative tumor suppressor in high-grade serous ovarian cancer. Biol
Reprod. 91:1132014. View Article : Google Scholar : PubMed/NCBI
|
|
5
|
Hobert O: Gene regulation by transcription
factors and microRNAs. Science. 319:1785–1786. 2008. View Article : Google Scholar : PubMed/NCBI
|
|
6
|
Polakis P: Wnt signaling and cancer. Genes
Dev. 4:1837–1851. 2000.
|
|
7
|
Tran DH, Satou K, Ho TB and Pham TH:
Computational discovery of miR-TF regulatory modules in human
genome. Bioinformation. 4:371–377. 2010. View Article : Google Scholar : PubMed/NCBI
|
|
8
|
Calin GA and Croce CM: microRNA signatures
in human cancers. Nat Rev Cancer. 6:857–866. 2006. View Article : Google Scholar : PubMed/NCBI
|
|
9
|
Ambros V: microRNA pathways in flies and
worms: Growth, death, fat, stress, and timing. Cell. 113:673–676.
2003. View Article : Google Scholar : PubMed/NCBI
|
|
10
|
Li M, Li J, Ding X, He M and Cheng SY:
microRNA and cancer. AAPS J. 2:309–317. 2010. View Article : Google Scholar
|
|
11
|
Gao X, Qiao Y, Han D, Zhang Y and Ma N:
Enemy or partner: Relationship between intronic micrornas and their
host genes. IUBMB Life. 64:835–840. 2012. View Article : Google Scholar : PubMed/NCBI
|
|
12
|
Rodriguez A, Griffiths-Jones S, Ashurst JL
and Bradley A: Identification of mammalian microRNA host genes and
transcription units. Genome Res. 14:1902–1910. 2004. View Article : Google Scholar : PubMed/NCBI
|
|
13
|
Baskerville S and Bartel DP: Microarray
profiling of microRNAs reveals frequent coexpression with
neighboring miRNAs and host genes. RNA. 11:241–247. 2005.
View Article : Google Scholar : PubMed/NCBI
|
|
14
|
Cao G, Huang B, Liu Z, Zhang J, Xu H, Xia
W, Li J, Li S, Chen L, Ding H, et al: Intronic miR-301 feedback
regulates its host gene, ska2, in A549 cells by targeting MEOX2 to
affect ERK/CREB pathways. Biochem Biophys Res Commun. 396:978–982.
2010. View Article : Google Scholar : PubMed/NCBI
|
|
15
|
Papadopoulos GL, Reczko M, Simossis VA,
Sethupathy P and Hatzigeorgiou AG: The database of experimentally
supported targets: A functional update of TarBase. Nucleic Acids
Res. 37:(Database Issue). D155–D158. 2009. View Article : Google Scholar : PubMed/NCBI
|
|
16
|
Hsu SD, Tseng YT, Shrestha S, Lin YL,
Khaleel A, Chou CH, Chu CF, Huang HY, Lin CM, Ho SY, et al:
miRTarBase update 2014: An information resource for experimentally
validated miRNA-target interactions. Nucleic Acids Res.
42:(Database Issue). D78–D85. 2014. View Article : Google Scholar : PubMed/NCBI
|
|
17
|
Xiao F, Zuo Z, Cai G, Kang S, Gao X and Li
T: miRecords: An integrated resource for microRNA-target
interactions. Nucleic Acids Res. 37:(Database Issue). D105–D110.
2009. View Article : Google Scholar : PubMed/NCBI
|
|
18
|
Kozomara A and Griffiths-Jones S: miRBase:
Integrating microRNA annotation and deep-sequencing data. Nucleic
Acids Res. 39:(Database Issue). D152–D157. 2011. View Article : Google Scholar : PubMed/NCBI
|
|
19
|
Jiang Q, Wang Y, Hao Y, Juan L, Teng M,
Zhang X, Li M, Wang G and Liu Y: miR2Disease: A manually curated
database for microRNA deregulation in human disease. Nucleic Acids
Res. 37:(Database Issue). D98–D104. 2009. View Article : Google Scholar : PubMed/NCBI
|
|
20
|
Dang CV: MYC on the path to cancer. Cell.
149:22–35. 2012. View Article : Google Scholar : PubMed/NCBI
|
|
21
|
Ivan C, Hu W, Bottsford-Miller J, Zand B,
Dalton HJ, Liu T, Huang J, Nick AM, Lopez-Berestein G, Coleman RL,
et al: Epigenetic analysis of the Notch superfamily in high-grade
serous ovarian cancer. Gynecol Oncol. 128:506–511. 2013. View Article : Google Scholar : PubMed/NCBI
|
|
22
|
Singer G, Kurman RJ, Chang HW, Cho SK and
Shih IeM: Diverse tumorigenic pathways in ovarian serous carcinoma.
Am J Pathol. 160:1223–1228. 2002. View Article : Google Scholar : PubMed/NCBI
|
|
23
|
Schmid S, Bieber M, Zhang F, Zhang M, He
B, Jablons D and Teng NN: Wnt and hedgehog gene pathway expression
in serous ovarian cancer. Int J Gynecol Cancer. 21:975–980. 2011.
View Article : Google Scholar : PubMed/NCBI
|
|
24
|
Ghosh S, Albitar L, LeBaron R, Welch WR,
Samimi G, Birrer MJ, Berkowitz RS and Mok SC: Up-regulation of
stromal versican expression in advanced stage serous ovarian
cancer. Gynecol Oncol. 119:114–120. 2010. View Article : Google Scholar : PubMed/NCBI
|
|
25
|
Ouellet V, Guyot MC, Le Page C,
Filali-Mouhim A, Lussier C, Tonin PN, Provencher DM and Mes-Masson
AM: Tissue array analysis of expression microarray candidates
identifies markers associated with tumor grade and outcome in
serous epithelial ovarian cancer. Int J Cancer. 119:599–607. 2006.
View Article : Google Scholar : PubMed/NCBI
|
|
26
|
Thériault BL, Cybulska P, Shaw PA, Gallie
BL and Bernardini MQ: The role of KIF14 in patient-derived primary
cultures of high-grade serous ovarian cancer cells. J Ovarian Res.
7:1232014. View Article : Google Scholar : PubMed/NCBI
|
|
27
|
Luo LY, Kim E, Cheung HW, Weir BA, Dunn
GP, Shen RR and Hahn WC: The tyrosine kinase adaptor protein FRS2
is oncogenic and amplified in high-grade serous ovarian cancer. Mol
Cancer Res. 13:502–509. 2015. View Article : Google Scholar : PubMed/NCBI
|
|
28
|
Zhao M, Sun J and Zhao Z: Synergetic
regulatory networks mediated by oncogene-driven microRNAs and
transcription factors in serous ovarian cancer. Mol Biosyst.
9:3187–3198. 2013. View Article : Google Scholar : PubMed/NCBI
|
|
29
|
Xiangjun He, Jing Yang, Qi Zhang, Heng Cui
and Yujun Zhang: Shortening of the 3′untranslated region: An
important mechanism leading to overexpression of HMGA2 in serous
ovarian cancer. Chin Med J. 127:494–499. 2014.PubMed/NCBI
|
|
30
|
Ouellet V, Le Page C, Guyot MC, Lussier C,
Tonin PN, Provencher DM and Mes-Masson AM: SET complex in serous
epithelial ovarian cancer. Int J Cancer. 119:2119–2126. 2006.
View Article : Google Scholar : PubMed/NCBI
|
|
31
|
Kwon JY, Seo YR and Ahn WS: Recognition of
potential predictive markers for diagnosis in Korean serous ovarian
cancer patients at stage IIIc using array comparative genomic
hybridization with high resolution. Mol Cell Toxicol. 7:772011.
View Article : Google Scholar
|
|
32
|
Bi FF, Li D and Yang Q: Promoter
hypomethylation, especially around the E26 transformation-specific
motif and increased expression of poly (ADP-ribose) polymerase 1 in
BRCA-mutated serous ovarian cancer. BMC Cancer. 13:902013.
View Article : Google Scholar : PubMed/NCBI
|
|
33
|
Dai W, Zeller C, Masrour N, Siddiqui N,
Paul J and Brown R: Promoter CpG island methylation of genes in key
cancer pathways associates with clinical outcome in high-grade
serous ovarian cancer. Clin Cancer Res. 19:5788–5797. 2013.
View Article : Google Scholar : PubMed/NCBI
|
|
34
|
Montavon C, Gloss BS, Warton K, Barton CA,
Statham AL, Scurry JP, Tabor B, Nguyen TV, Qu W, Samimi G, et al:
Prognostic and diagnostic significance of DNA methylation patterns
in high grade serous ovarian cancer. Gynecol Oncol. 124:582–588.
2012. View Article : Google Scholar : PubMed/NCBI
|
|
35
|
Amankwah EK, Wang Q, Schildkraut JM, Tsai
YY, Ramus SJ, Fridley BL, Beesley J, Johnatty SE, Webb PM,
Chenevix-Trench G, et al: Polymorphisms in stromal genes and
susceptibility to serous epithelial ovarian cancer: A report from
the ovarian cancer association consortium. PLoS One. 6:e196422011.
View Article : Google Scholar : PubMed/NCBI
|
|
36
|
Kashuba V, Dmitriev AA, Krasnov GS,
Pavlova T, Ignatjev I, Gordiyuk VV, Gerashchenko AV, Braga EA,
Yenamandra SP, Lerman M, et al: NotI microarrays: Novel epigenetic
markers for early detection and prognosis of high grade serous
ovarian cancer. Int J Mol Sci. 13:13352–13377. 2012. View Article : Google Scholar : PubMed/NCBI
|
|
37
|
Kurita T, Izumi H, Kagami S, Kawagoe T,
Toki N, Matsuura Y, Hachisuga T and Kohno K: Mitochondrial
transcription factor A regulates BCL2L1 gene expression and is a
prognostic factor in serous ovarian cancer. Cancer Sci.
103:239–244. 2012. View Article : Google Scholar : PubMed/NCBI
|
|
38
|
Berchuck A, Iversen ES, Luo J, Clarke JP,
Horne H, Levine DA, Boyd J, Alonso MA, Secord AA, Bernardini MQ, et
al: Microarray analysis of early stage serous ovarian cancers
demonstrates profiles predictive of favorable outcome. Clin Cancer
Res. 15:2448–2455. 2009. View Article : Google Scholar : PubMed/NCBI
|
|
39
|
Hjerpe E, Brage SE, Stolt Frostvik M,
Johansson H, Shoshan M and Avall-Lundqvist E: Metabolic markers and
HSP60 in chemonaive serous solid ovarian cancer versus ascites. Int
J Gynecol Cancer. 24:1389–1394. 2014. View Article : Google Scholar : PubMed/NCBI
|
|
40
|
Cowin PA, George J, Fereday S, Loehrer E,
Van Loo P, Cullinane C, Etemadmoghadam D, Ftouni S, Galletta L,
Anglesio MS, et al: LRP1B deletion in high-grade serous ovarian
cancers is associated with acquired chemotherapy resistance to
liposomal doxorubicin. Cancer Res. 72:4060–4073. 2012. View Article : Google Scholar : PubMed/NCBI
|
|
41
|
Tanwar PS, Mohapatra G, Chiang S, Engler
DA, Zhang L, Kaneko-Tarui T, Ohguchi Y, Birrer MJ and Teixeira JM:
Loss of LKB1 and PTEN tumor suppressor genes in the ovarian surface
epithelium induces papillary serous ovarian cancer. Carcinogenesis.
35:546–553. 2014. View Article : Google Scholar : PubMed/NCBI
|
|
42
|
Tamir A, Jag U, Sarojini S, Schindewolf C,
Tanaka T, Gharbaran R, Patel H, Sood A, Hu W, Patwa R, et al:
Kallikrein family proteases KLK6 and KLK7 are potential early
detection and diagnostic biomarkers for serous and papillary serous
ovarian cancer subtypes. J Ovarian Res. 7:1092014. View Article : Google Scholar : PubMed/NCBI
|
|
43
|
He QZ, Luo XZ, Wang K, Zhou Q, Ao H, Yang
Y, Li SX, Li Y, Zhu HT and Duan T: Isolation and characterization
of cancer stem cells from high-grade serous ovarian carcinomas.
Cell Physiol Biochem. 33:173–184. 2014. View Article : Google Scholar : PubMed/NCBI
|
|
44
|
Callahan MJ, Nagymanyoki Z, Bonome T,
Johnson ME, Litkouhi B, Sullivan EH, Hirsch MS, Matulonis UA, Liu
J, Birrer MJ, et al: Increased HLA-DMB expression in the tumor
epithelium is associated with increased CTL infiltration and
improved prognosis in advanced-stage serous ovarian cancer. Clin
Cancer Res. 23:7667–7673. 2008. View Article : Google Scholar
|
|
45
|
Li YL, Ye F, Hu Y, Lu WG and Xie X:
Identification of suitable reference genes for gene expression
studies of human serous ovarian cancer by real-time polymerase
chain reaction. Anal Biochem. 394:110–116. 2009. View Article : Google Scholar : PubMed/NCBI
|
|
46
|
Li YL, Ye F, Cheng XD, Hu Y, Zhou CY, Lü
WG and Xie X: Identification of glia maturation factor beta as an
independent prognostic predictor for serous ovarian cancer. Eur J
Cancer. 46:2104–2118. 2010. View Article : Google Scholar : PubMed/NCBI
|
|
47
|
Borley J, Ghaem-Maghami S, Honeyfield L,
Williamson R and Brown R: Hypomethylation of MSX1 is associated
with decreased gene expression, poor progression free survival and
chemotherapy resistance in serous ovarian cancer. An Int J Obstetr
Gynaecol. 120:2492013.
|
|
48
|
Singh H, Li Y, Fuller PJ, Harrison C, Rao
J, Stephens AN and Nie G: HtrA3 is downregulated in cancer cell
lines and significantly reduced in primary serous and granulosa
cell ovarian tumors. J Cancer. 4:152–164. 2013. View Article : Google Scholar : PubMed/NCBI
|
|
49
|
Kumtepe Y, Halici Z, Sengul O, Kunak CS,
Bayir Y, Kilic N, Cadirci E, Pulur A and Bayraktutan Z: High serum
HTATIP2/TIP30 level in serous ovarian cancer as prognostic or
diagnostic marker. Eur J Med Res. 18:182013. View Article : Google Scholar : PubMed/NCBI
|
|
50
|
Sayer RA, Lancaster JM, Pittman J, Gray J,
Whitaker R, Marks JR and Berchuck A: High insulin-like growth
factor-2 (IGF-2) gene expression is an independent predictor of
poor survival for patients with advanced stage serous epithelial
ovarian cancer. Gynecol Oncol. 96:355–361. 2005. View Article : Google Scholar : PubMed/NCBI
|
|
51
|
Emmanuel C, Chiew YE, George J,
Etemadmoghadam D, Anglesio MS, Sharma R, Russell P, Kennedy C,
Fereday S, Hung J, et al: Genomic classification of serous ovarian
cancer with adjacent borderline differentiates RAS pathway and
TP53-mutant tumors and identifies NRAS as an oncogenic driver. Clin
Cancer Res. 20:6618–6630. 2014. View Article : Google Scholar : PubMed/NCBI
|
|
52
|
Yoshihara K, Tajima A, Komata D, Yamamoto
T, Kodama S, Fujiwara H, Suzuki M, Onishi Y, Hatae M, Sueyoshi K,
et al: Gene expression profiling of advanced-stage serous ovarian
cancers distinguishes novel subclasses and implicates ZEB2 in tumor
progression and prognosis. Cancer Sci. 100:1421–1428. 2009.
View Article : Google Scholar : PubMed/NCBI
|
|
53
|
Yu Z, Kim J, He L, Creighton CJ, Gunaratne
PH, Hawkins SM and Matzuk MM: Functional analysis of miR-34c as a
putative tumor suppressor in high-grade serous ovarian cancer. Biol
Reprod. 91:1132014. View Article : Google Scholar : PubMed/NCBI
|
|
54
|
Merritt MA, Parsons PG, Newton TR, Martyn
AC, Webb PM, Green AC, Papadimos DJ and Boyle GM: Expression
profiling identifies genes involved in neoplastic transformation of
serous ovarian cancer. BMC Cancer. 9:3782009. View Article : Google Scholar : PubMed/NCBI
|
|
55
|
Newton TR, Parsons PG, Lincoln DJ,
Cummings MC, Wyld DK, Webb PM, Green AC and Boyle GM: Expression
profiling correlates with treatment response in women with advanced
serous epithelial ovarian cancer. Int J Cancer. 119:875–883. 2006.
View Article : Google Scholar : PubMed/NCBI
|
|
56
|
Bateman NW, Jaworski E, Ao W, Wang G,
Litzi T, Dubil E, Marcus C, Conrads KA, Teng PN, Hood BL, et al:
Elevated AKAP12 in paclitaxel-resistant serous ovarian cancer cells
is prognostic and predictive of poor survival in patients. J
Proteome Res. 14:1900–1910. 2015. View Article : Google Scholar : PubMed/NCBI
|
|
57
|
Bashashati A, Ha G, Tone A, Ding J,
Prentice LM, Roth A, Rosner J, Shumansky K, Kalloger S, Senz J, et
al: Distinct evolutionary trajectories of primary high-grade serous
ovarian cancers revealed through spatial mutational profiling. J
Pathol. 231:21–34. 2013. View Article : Google Scholar : PubMed/NCBI
|
|
58
|
Jannesari-Ladani F, Hossein G and
Izadi-Mood N: Differential Wnt11 expression related to Wnt5a in
high- and low-grade serous ovarian cancer: Implications for
migration, adhesion and survival. Asian Pac J Cancer Prev.
15:1489–1495. 2014. View Article : Google Scholar : PubMed/NCBI
|
|
59
|
Ye Q, Chen L, Yin X, Liu YJ, Ji Q and Zhao
E: Development of serous ovarian cancer is associated with the
expression of homologous recombination pathway proteins. Pathol
Oncol Res. 20:931–938. 2014. View Article : Google Scholar : PubMed/NCBI
|
|
60
|
Karst AM, Jones PM, Vena N, Ligon AH, Liu
JF, Hirsch MS, Etemadmoghadam D, Bowtell DD and Drapkin R: Cyclin
E1 deregulation occurs early in secretory cell transformation to
promote formation of fallopian tube-derived high-grade serous
ovarian cancers. Cancer Res. 74:1141–1152. 2014. View Article : Google Scholar : PubMed/NCBI
|
|
61
|
Martins FC, Santiago Id, Trinh A, Xian J,
Guo A, Sayal K, Jimenez-Linan M, Deen S, Driver K, Mack M, et al:
Combined image and genomic analysis of high-grade serous ovarian
cancer reveals PTEN loss as a common driver event and prognostic
classifier. Genome Biol. 15:5262014. View Article : Google Scholar : PubMed/NCBI
|
|
62
|
Tashiro H, Miyazaki K, Okamura H, Iwai A
and Fukumoto M: c-myc over-expression in human primary ovarian
tumours: Its relevance to tumour progression. Int J Cancer.
50:828–833. 1992. View Article : Google Scholar : PubMed/NCBI
|
|
63
|
Kannan K, Coarfa C, Rajapakshe K, Hawkins
SM, Matzuk MM, Milosavljevic A and Yen L: CDKN2D-WDFY2 is a
cancer-specific fusion gene recurrent in high-grade serous ovarian
carcinoma. PLoS Genet. 10:e10042162014. View Article : Google Scholar : PubMed/NCBI
|
|
64
|
Schildkraut JM, Iversen ES, Wilsonv MA,
Clyde MA, Moorman PG, Palmieri RT, Whitaker R, Bentley RC, Marks JR
and Berchuck A: Association between DNA damage response and repair
genes and risk of invasive serous ovarian cancer. PLoS One.
5:e100612010. View Article : Google Scholar : PubMed/NCBI
|
|
65
|
Shah NR, Tancioni I, Ward KK, Lawson C,
Chen XL, Jean C, Sulzmaier FJ, Uryu S, Miller NL, Connolly DC and
Schlaepfer DD: Analyses of merlin/NF2 connection to FAK inhibitor
responsiveness in serous ovarian cancer. Gynecol Oncol.
134:104–111. 2014. View Article : Google Scholar : PubMed/NCBI
|
|
66
|
Koti M, Siu A, Clément I, Bidarimath M,
Turashvili G, Edwards A, Rahimi K, Mes-Masson AM and Squire JA: A
distinct pre-existing inflammatory tumour microenvironment is
associated with chemotherapy resistance in high-grade serous
epithelial ovarian cancer. Br J Cancer. 112:1215–1222. 2015.
View Article : Google Scholar : PubMed/NCBI
|
|
67
|
Cheon DJ, Tong Y, Sim MS, Dering J, Berel
D, Cui X, Lester J, Beach JA, Tighiouart M, Walts AE, et al: A
collagen-remodeling gene signature regulated by TGF-β signaling is
associated with metastasis and poor survival in serous ovarian
cancer. Clin Cancer Res. 20:711–723. 2014. View Article : Google Scholar : PubMed/NCBI
|
|
68
|
Zhou J, Gong G, Tan H, Dai F, Zhu X, Chen
Y, Wang J, Liu Y, Chen P, Wu X and Wen J: Urinary microRNA-30a-5p
is a potential biomarker for ovarian serous adenocarcinoma. Oncol
Rep. 33:2915–2923. 2015. View Article : Google Scholar : PubMed/NCBI
|
|
69
|
Li J, Li L, Li Z, Gong G, Chen P, Liu H,
Wang J, Liu Y and Wu X: The role of miR-205 in the VEGF-mediated
promotion of human ovarian cancer cell invasion. Gynecol Oncol.
137:125–133. 2015. View Article : Google Scholar : PubMed/NCBI
|
|
70
|
Swiercz A, Dansonka-Mieszkowska A, Goryca
K, Kulinczak M, Zajdel M, Chechlinska M, Rembiszewska A,
Kupryjańczyk J and Siwicki KJ: 273 MiR-7 Expression depends on TP53
mutational status in primary serous ovarian cancer. Eur J Cancer.
48 Suppl 5:S66–S67. 2012. View Article : Google Scholar
|
|
71
|
Furlong F, Fitzpatrick P, O'Toole S,
Phelan S, McGrogan B, Maguire A, O'Grady A, Gallagher M, Prencipe
M, McGoldrick A, et al: Low MAD2 expression levels associate with
reduced progression-free survival in patients with high-grade
serous epithelial ovarian cancer. J Pathol. 226:746–755. 2012.
View Article : Google Scholar : PubMed/NCBI
|
|
72
|
Jang SG, Yoo CW, Park SY, Kang S and Kim
HK: Low expression of miR-449 in gynecologic clear cell carcinoma.
Int J Gynecol Cancer. 24:1558–1563. 2014. View Article : Google Scholar : PubMed/NCBI
|
|
73
|
Kan CW, Hahn MA, Gard GB, Maidens J, Huh
JY, Marsh DJ and Howell VM: Elevated levels of circulating
microRNA-200 family members correlate with serous epithelial
ovarian cancer. BMC Cancer. 12:6272012. View Article : Google Scholar : PubMed/NCBI
|
|
74
|
Chong GO, Jeon HS, Han HS, Son JW, Lee YH,
Hong DG, Lee YS and Cho YL: Differential microRNA expression
profiles in primary and recurrent epithelial ovarian cancer.
Anticancer Res. 35:2611–2617. 2015.PubMed/NCBI
|
|
75
|
Zhang P, Wang M, Jie ZH, Shuang T, Yan XY,
Zhou YY and Wu JL: Detection and significance of miR-210 in
chemotherapy resistant and chemotherapy sensitive ovarian serous
carcinoma. J China Med Univ. 43:487–492. 2014.
|
|
76
|
Fujita PA, Rhead B, Zweig AS, Hinrichs AS,
Karolchik D, Cline MS, Goldman M, Barber GP, Clawson H, Coelho A,
et al: The UCSC genome browser database: Update 2011. Nucleic Acids
Res. 39:(Database Issue). D876–D882. 2011. View Article : Google Scholar : PubMed/NCBI
|
|
77
|
Chekmenev DS, Haid C and Kel AE: P-Match:
Transcription factor binding site search by combining patterns and
weight matrices. Nucleic Acids Res. 33:W432–W437. 2005. View Article : Google Scholar : PubMed/NCBI
|
|
78
|
Wingender E, Dietze P, Karas H and Knüppel
R: TRANSFAC: A database on transcription factors and their DNA
binding sites. Nucleic Acids Res. 24:238–241. 1996. View Article : Google Scholar : PubMed/NCBI
|
|
79
|
Petitjean A, Achatz MI, Borresen-Dale AL,
Hainaut P and Olivier M: TP53 mutations in human cancers:
Functional selection and impact on cancer prognosis and outcomes.
Oncogene. 26:2157–2165. 2007. View Article : Google Scholar : PubMed/NCBI
|
|
80
|
Cancer Genome Atlas Research Network:
Integrated genomic analyses of ovarian carcinoma. Nature.
474:609–615. 2011. View Article : Google Scholar : PubMed/NCBI
|
|
81
|
Creighton CJ, Fountain MD, Yu Z, Nagaraja
AK, Zhu H, Khan M, Olokpa E, Zariff A, Gunaratne PH, Matzuk MM and
Anderson ML: Molecular profiling uncovers a p53-associated role for
microRNA-31 in inhibiting the proliferation of serous ovarian
carcinomas and other cancers. Cancer Res. 70:1906–1915. 2010.
View Article : Google Scholar : PubMed/NCBI
|
|
82
|
Yang D, Sun Y, Hu L, Zheng H, Ji P, Pecot
CV, Zhao Y, Reynolds S, Cheng H, Rupaimoole R, et al: Integrated
analyses identify a master microRNA regulatory network for the
mesenchymal subtype in serous ovarian cancer. Cancer Cell.
23:186–199. 2013. View Article : Google Scholar : PubMed/NCBI
|
|
83
|
Ibrahim FF, Jamal R, Syafruddin SE,
Mutalib Ab NS, Saidin S, MdZin RR, Mollah Hossain MM and Mokhtar
NM: microRNA-200c and microRNA-31 regulate proliferation, colony
formation, migration and invasion in serous ovarian cancer. J
Ovarian Res. 8:562015. View Article : Google Scholar : PubMed/NCBI
|
|
84
|
Spizzo R, Nicoloso MS, Lupini L, Lu Y,
Fogarty J, Rossi S, Zagatti B, Fabbri M, Veronese A, Liu X, et al:
miR-145 participates with TP53 in a death-promoting regulatory loop
and targets estrogen receptor-alpha in human breast cancer cells.
Cell Death Differ. 17:246–254. 2010. View Article : Google Scholar : PubMed/NCBI
|