Introduction
Osteosarcoma (OS) is an invasive malignant neoplasm
of the bones that originates from primitive transformed cells
(1). OS is often derived from the
metaphyseal region of tubular long bones, with 10, 19, and 42% of
OS cases occurring in the humerus, tibia, and femur, respectively
(2). OS is the most common type of
bone cancer among children and teenagers (3). In pediatric patients, OS ranks eighth
among all types of cancer incidence, accounting for ~20% of all
primary bone cancers and 2.4% of all malignant tumors (4). Therefore, assessing the key genes
associated with OS is crucial.
The downregulation of naked cuticle homolog 2 and
alterations in its associated signaling pathways contribute to
tumor growth and metastasis in patients with OS (5). Ribophorin II may represent a promising
therapeutic target for OS, as silencing it promotes the regulation
of lethal OS phenotypes (6). Cluster
of differentiation 276 molecules belongs to the B7 family of
costimulatory molecules and is associated with metastasis and
survival in patients with OS, and its expression in OS cells may
serve to control invasive malignancy and tumor immunity (7). By inhibiting epithelial cadherin
expression and inducing the epithelial-mesenchymal transition (EMT)
in OS cells, the overexpression of the transcription factor (TF)
snail family transcriptional repressor 1 (SNAI1) serves a function
in tumor progression by promoting invasion and metastasis (8). Overexpression of EMT-associated TFs,
including SNAI1, twist family bHLH transcription factor 1 and zinc
finger E-box binding homeobox 1 is involved in the progression of
osteosarcoma, and molecules or chemotherapeutic agents targeting
these TFs may be used to treat OS by helping to control metastasis
(9). Furthermore, Al-Romaih et
al (10) demonstrated that a
significant loss of 5′ CpG island methylation in growth arrest and
DNA damage inducible α is associated with the induction of
apoptosis in OS cells. However, the mechanisms underlying OS cell
apoptosis remain to be fully understood.
In 2015, Endo-Munoz et al (11) identified molecules that may promote OS
metastasis through multiomics analysis, confirmed this function
in vitro and in vivo, and demonstrated that the
plasminogen activator, urokinase (UPA)/UPA receptor axis
contributed to OS metastasis. Since different procedures may yield
different results, the present study further analyzed the data from
the Endo-Munoz et al study (11) using bioinformatics. Initially, the
differentially expressed genes (DEGs) in the metastatic OS cell
lines were identified. Secondly, bidirectional hierarchical
clustering and an unpaired Student's t-test were performed to
confirm the DEGs between the metastatic and the non-metastatic
samples. Thirdly, a protein-protein interaction (PPI) network for
the DEGs was constructed and enrichment analysis was conducted for
the DEGs corresponding to the proteins of this network, to identify
key genes. Finally, the TFs and CpG islands of the promoter regions
of key genes were identified.
Materials and methods
Data source
The microarray GSE49003 dataset (11) was obtained from the database of the
Gene Expression Omnibus (www.ncbi.nlm.nih.gov/geo) (12), and was sequenced on the GPL6947
Illumina HumanHT-12 V3.0 expression beadchip (Illumina, Inc., San
Diego, CA, USA). GSE49003 included 3 metastatic OS KRIB cell lines,
3 metastatic OS KHOS cell lines, 3 non-metastatic OS U2OS cell
lines, and 3 non-metastatic OS HOS cell lines. These OS cell lines
were provided by the Basil Hetzel Institute of the University of
Adelaide (Adelaide, Australia). The cells were cultured in
Dulbecco's modified Eagle's medium supplemented with 10% fetal calf
serum and pregnancy-specific glycoproteins in a 5% CO2
atmosphere for 24 h at 37°C until 80% confluent (11).
Data preprocessing and differential
expression analysis
Based on the platform annotation information of
GSE49003, probes were transformed into their corresponding gene
symbols. For probes that corresponded to the same gene, their
values were averaged to obtain the gene expression value.
Subsequently, log2 transformation and normalization were performed
for the data. The DEGs between non-metastatic and metastatic
samples were identified using the limma package in R (www.bioconductor.org/packages/release/bioc/html/limma.html)
(13). Using the Benjamini-Hochberg
method (14) via the multtest package
in R, the P-values were adjusted according to the false discovery
rate (FDR; thresholds, FDR <0.05 and |log2 fold
change| >1). Following the extraction of the gene expression
values in each sample, bidirectional hierarchical clustering
(15) based on Euclidean distance
(16) was performed using the
pheatmap package in R (https://cran.r-project.org/web/packages/pheatmap/index.html)
(17). To determine whether the DEGs
distinguished metastatic and non-metastatic samples, an unpaired
Student's t-test (18) was used to
compare the expression of the DEGs between the samples. P<0.05
was considered to indicate a statistically significant
difference.
PPI network analysis
The Search Tool for the Retrieval of Interacting
Genes (STRING; http://string-db.org/) includes
verified and predicted interactions (19). Cytoscape software (version 3.2.0;
Institute for Systems Biology, Seattle, WA, USA) was used to
construct a unified framework by integrating gene expression data
with biomolecular interaction networks (20). The interactions among the DEGs were
searched for using the STRING database (version 10.0) (19), with a combined score >0.8 as the
threshold. Subsequently, the PPI network was visualized using
Cytoscape software (version 3.2.0) (20). The number of interactions associated
with a given node corresponded to the degree for the node. In
addition, the nodes that exhibited increased degrees were hub
nodes.
Enrichment analysis for the DEGs
corresponding to the proteins of the PPI network
Gene Ontology (GO; http://www.geneontology.org/) includes the molecular
functions, biological processes and cellular components associated
with genes and their products (21).
The Kyoto Encyclopedia of Genes and Genomes (KEGG; www.genome.jp/kegg) integrates chemical, genomic and
systemic functional information on genes, and may be applied in
pathway mapping (22). Using Database
for Annotation, Visualization and Integrated Discovery software
(version 6.7; david.abcc.ncifcrf.gov) (23), the DEGs corresponding to the proteins
of the PPI network underwent functional enrichment analysis, with
an FDR threshold of <0.05. Furthermore, the KEGG Orthology-Based
Annotation System server (kobas.cbi.pku.edu.cn/home.do) (24) was used to perform pathway annotation
and enrichment analysis for the DEGs corresponding to the proteins
of the PPI network, with P<0.05 was considered to indicate a
statistically significant difference.
Search for the TFs and CpG islands of
the promoter regions of key genes
TRANSFAC (http://www.gene-regulation.com/pub/databases.html) is
a database that integrates eukaryotic transcriptional regulatory
information, including information on TFs, transcription regulation
relationships and TF binding sites (25). Using the TRANSFAC database (version
11.2) (25), the TFs in the promoter
regions of key genes were searched for. CpG islands are present in
the majority of mammalian gene promoters and are characterized by
an increased frequency of non-methylated CpG dinucleotides
(26). Abnormal CpG island
hypermethylation is common in certain types of cancer and may
promote tumor progression by inhibiting tumor suppressor gene
expression (27). The promoter
sequences of the key genes were downloaded from Ensembl (http://pre.ensembl.org) (28), and their CpG islands were predicted
using CpG Island Searcher software (cpgislands.usc.edu) (29). The thresholds were as follows: GC
>50%, CpG observed/expected value >0.6, and CpG island length
>200 bp.
Results
DEG analysis
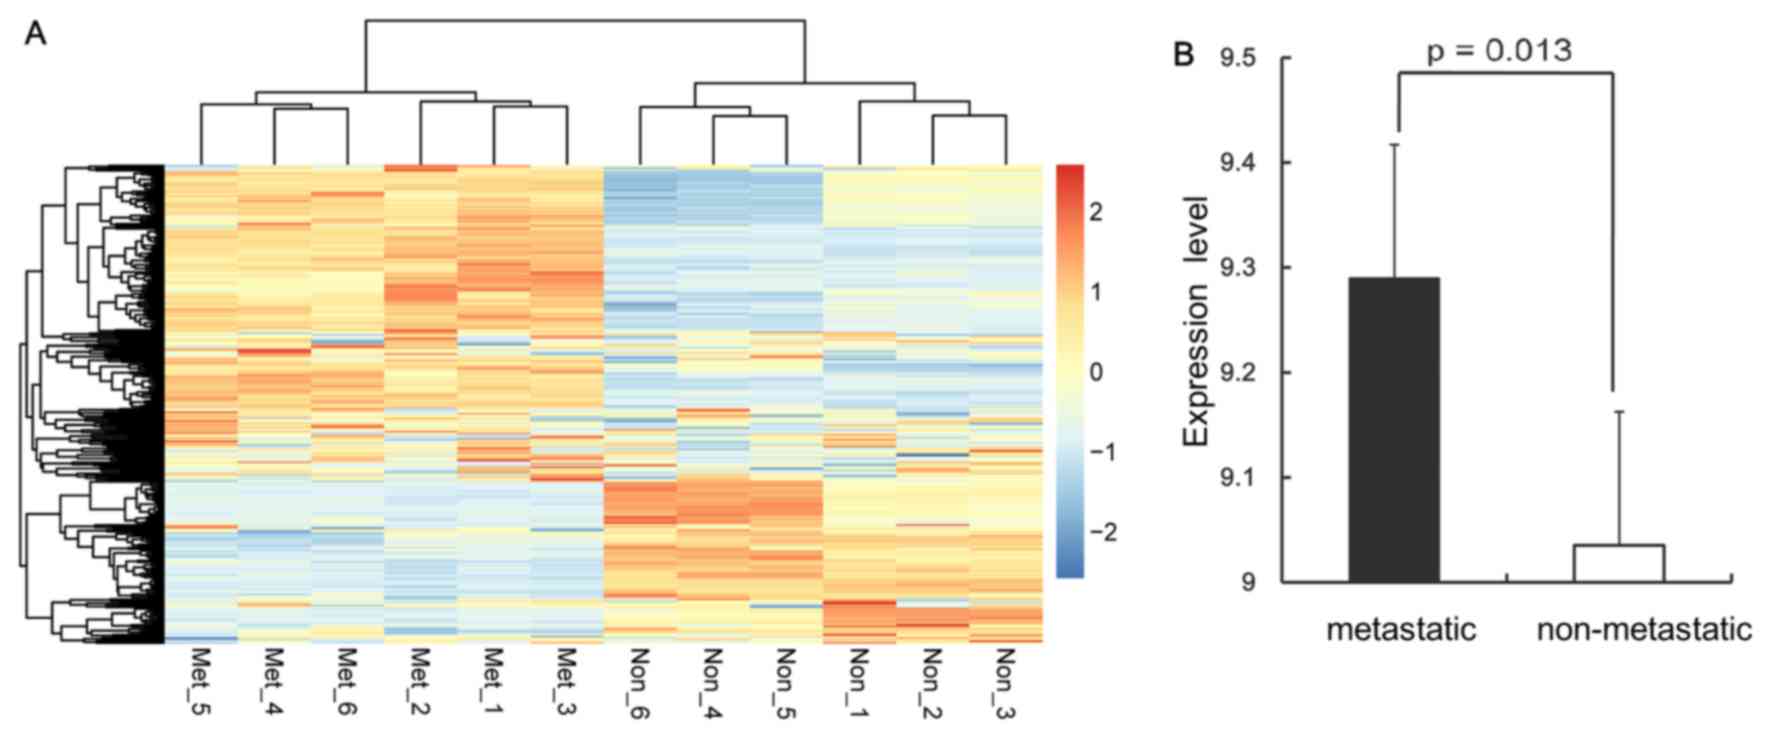
A total of 323 DEGs were identified between the
metastatic and non-metastatic samples. Of these, 189 genes were
upregulated and 134 were downregulated. Bidirectional hierarchical
clustering indicated that the DEGs differentiated the metastatic
samples from the non-metastatic samples (Fig. 1A). The t-test revealed that the DEGs
were significantly differentially expressed and more likely to be
upregulated than downregulated (Fig.
1B).
PPI network construction and
enrichment analysis
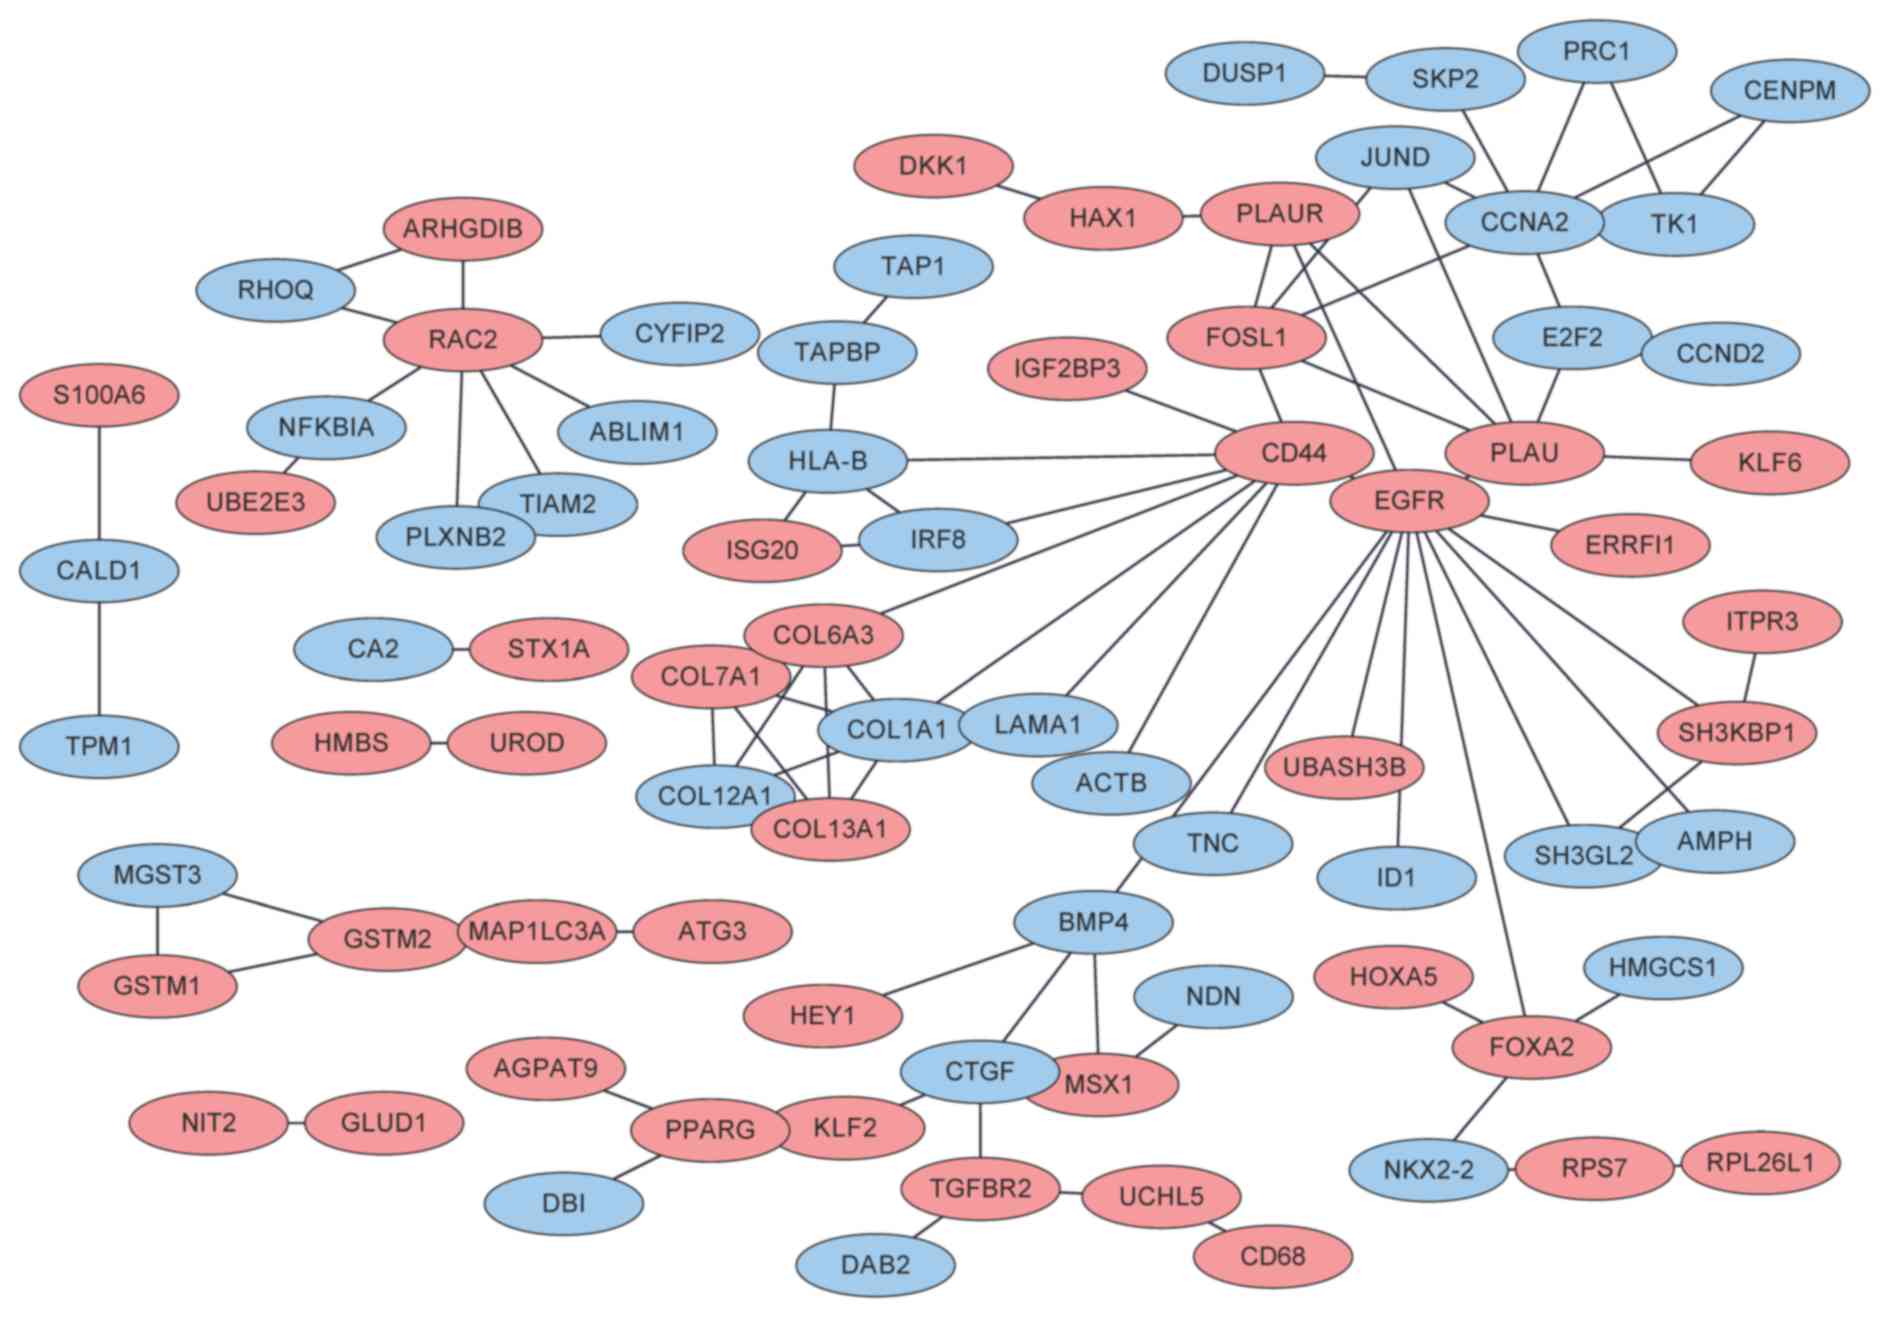
The PPI network consisted of 80 nodes (42
corresponding to the products of upregulated genes; 38
corresponding to the products of downregulated genes) and 93
interactions (Fig. 2). Upregulated
expression of epidermal growth factor receptor (EGFR, degree=12)
was associated with an increased degree. For the DEGs corresponding
to the proteins of the PPI network, a total of 7 GO terms were
enriched, including cytoskeleton organization (FDR=0.003084;
associated with EGFR), response to endogenous stimulus
(FDR=0.008481) and response to organic substance (FDR=0.009596;
associated with EGFR; Table I). Only
the signaling pathways of focal adhesion (P=0.006078; associated
with EGFR) and extracellular matrix-receptor interaction
(P=0.013264) were enriched for the DEGs corresponding to the
proteins of the PPI network (Table
II).
 | Table I.Enriched functions for the
differentially expressed genes, corresponding to the proteins of
the protein-protein interaction network. |
Table I.
Enriched functions for the
differentially expressed genes, corresponding to the proteins of
the protein-protein interaction network.
| Term | Count | P-value | False discovery
rate | Gene symbol |
|---|
| GO:0007010 -
Cytoskeleton organization | 10 |
3.29×10⁻⁵ | 0.003084 | EGFR, BMP4, MSX1,
COL13A1, HOXA5, CTGF, JUND, TGFBR2, COL12A1, COL1A1 |
| GO:0009719 -
Response to endogenous stimulus | 11 |
3.63×10⁻⁵ | 0.008481 | BMP4, DUSP1, CCND2,
PPARG, TGFBR2, HMGCS1, RHOQ, CA2, COL1A1, FOSL1, CCNA2 |
| GO:0010033 -
Response to organic substance | 16 |
2.64×10⁻⁶ | 0.009596 | EGFR, BMP4, TGFBR2,
PPARG, HMGCS1, NFKBIA, RHOQ, MSX1, CD44, DUSP1, CCND2, ID1, CA2,
COL1A1, FOSL1, CCNA2 |
| GO:0009725 -
Response to hormone stimulus | 10 |
9.72×10⁻⁵ | 0.01414 | BMP4, DUSP1, CCND2,
PPARG, TGFBR2, RHOQ, CA2, COL1A1, FOSL1, CCNA2 |
| GO:0042127 -
Regulation of cell proliferation | 14 |
1.47×10⁻⁴ | 0.015592 | BMP4, EGFR, S100A6,
NDN, TGFBR2, PPARG, NFKBIA, LAMA1, MSX1, RAC2, CCND2, FOSL1, CCNA2,
PLAU |
| GO:0006928 - Cell
motion | 11 |
1.37×10⁻⁴ | 0.015959 | ACTB, LAMA1, NDN,
CD44, ID1, CTGF, CALD1, TPM1, PLAU, PLAUR, ARHGDIB |
| GO:0006357 -
Regulation of transcription from RNA polymerase II promoter | 13 |
2.77×10⁻⁴ | 0.022896 | BMP4, KLF6, FOXA2,
PPARG, RHOQ, NFKBIA, MSX1, HEY1, ID1, JUND, IRF8, FOSL1,
NKX2-2 |
| Table II.Pathways enriched for the
differentially expressed genes corresponding to the proteins of the
protein-protein interaction network. |
Table II.
Pathways enriched for the
differentially expressed genes corresponding to the proteins of the
protein-protein interaction network.
| ID | Signaling
pathway | Count | P-value | Gene symbol |
|---|
| hsa04510 | Focal adhesion | 8 | 0.006078 | EGFR, ACTB, LAMA1,
RAC2, CCND2, TNC, COL6A3, COL1A1 |
| hsa04512 | Extracellular
matrix-receptor interaction | 5 | 0.013264 | LAMA1, CD44, TNC,
COL6A3, COL1A1 |
Search for the TFs and CpG islands of
the promoter regions of key genes
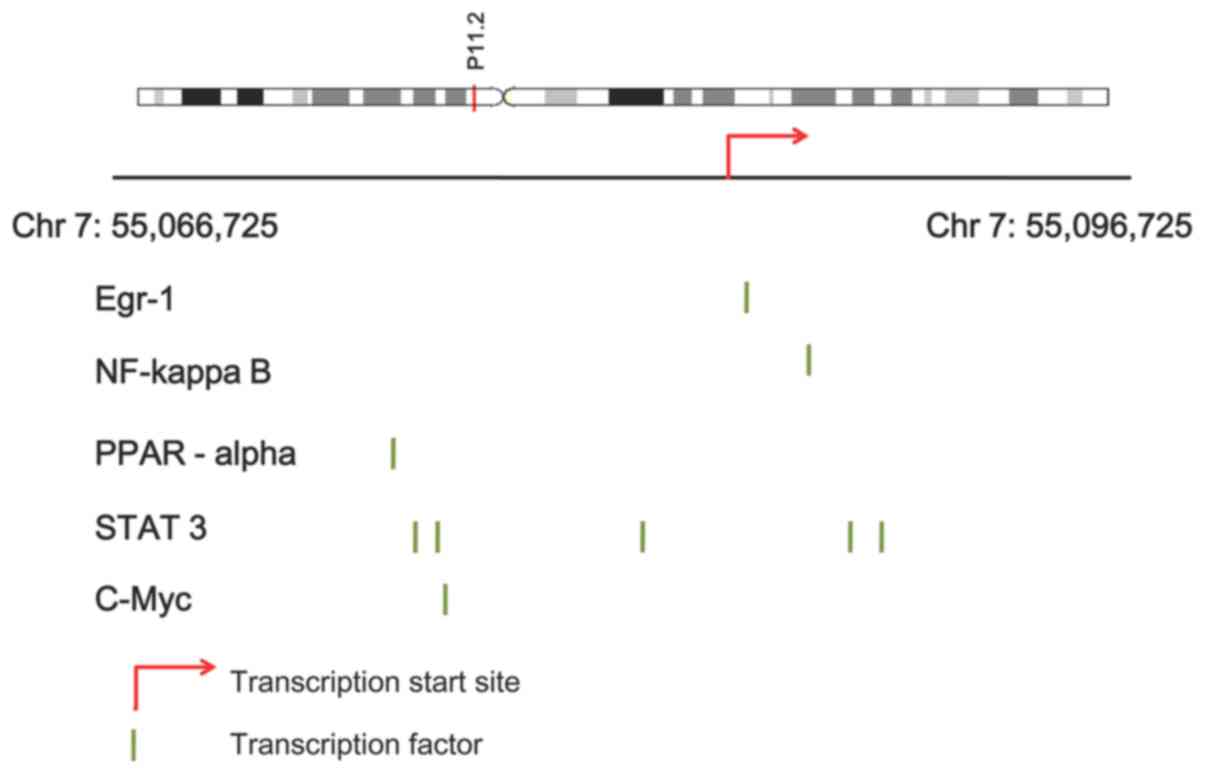
Using the TRANSFAC database, the TFs in the promoter
regions of EGFR were searched. Finally, the TFs early growth
response 1 (EGR1), nuclear factor (NF)-κB complex subunits,
peroxisome proliferator activated receptor α (PPARA), signal
transducer and activator of transcription 3 (STAT3) and MYC
proto-oncogene (MYC) were identified in the promoter region of EGFR
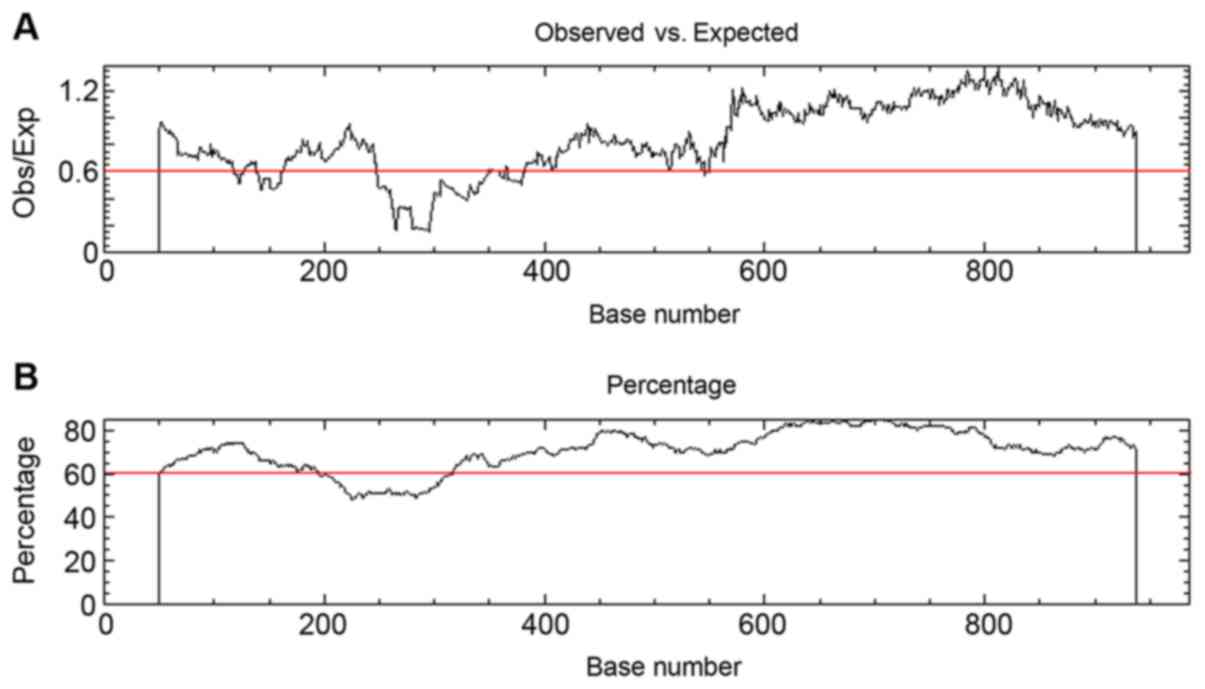
(Fig. 3). The promoter sequence of
EGFR was downloaded, and multiple CpG islands, starting from the
400 bp of the promoter sequence, were predicted (Fig. 4).
Discussion
In the present study, a total of 323 DEGs were
identified between the metastatic and non-metastatic samples. Of
these, 189 genes were upregulated and 134 were downregulated.
Bidirectional hierarchical clustering and a t-test indicated that
the DEGs distinguished the metastatic and non-metastatic samples,
and were significantly differentially expressed. In the PPI network
constructed for the DEGs, upregulated EGFR exhibited a higher
degree and therefore was identified to be highly interconnected
with other proteins. Enrichment analysis revealed that EGFR was
enriched in cytoskeleton organization, organic substance response,
and the signaling pathway of focal adhesion. Expression and genomic
gains of EGFR, and deletions of the phosphatase and tensin homolog,
are common in OS (30). In addition,
the EGFR signaling pathway may be inhibited by microRNA (miR)-143
by regulating matrix metallopeptidase 9 (MMP9) expression in OS;
therefore, EGFR, MMP9 and miR143 may serve as therapeutic targets
for inhibiting OS invasion (31). The
nuclear expression of erb-b2 receptor tyrosine kinase 4 (ERBB4)and
the cell surface expression of ERBB2 and EGFR may contribute to OS
progression, indicating that therapy targeting the expression of
these genes may benefit patients with OS (32). EGFR expression has been previously
suggested to serve a critical function in the progression of OS, is
increased in OS cell lines, and its downstream signaling molecule
MAPK1 serves as a prognostic factor in patients with OS (33). Mammalian CpG island methylation may
result in transcriptional silencing, and 3′ CpG island methylation
serves a function in developmental gene regulation (34). Multiple CpG islands starting from the
400 bp of the EGFR promoter sequence were predicted, and these
regions possessed an increased likelihood of undergoing
methylation, compared with regions <400 bp, which may serve a
function in regulating EGFR expression.
Using the TRANSFAC database, the TFs EGR1, NF-κB
complex subunits, PPARA, STAT3 and MYC were identified in the
promoter region of EGFR. EGR1 may be expressed in normal bone cells
following stimulation with neurotransmitters, hormones and growth
factors, which serve functions in bone formation (35). Lysophosphatidic acid-induced
upregulation of EGR1 expression is accompanied by a time-dependent
decrease in periostin expression in MG-63 osteosarcoma cells, and
therefore EGR1 may influence periostin expression in these cells
(36). Downregulating solute carrier
family 16 member 1 (SLC16A1) expression has been demonstrated to
regulate the NF-κB complex subunits signaling pathway, which may
result in tumor growth and metastasis inhibition in OS, while
increased SLC16A1 expression has been revealed to predict poor
overall survival in patients with OS (37). Since PPAR agonists may induce
apoptosis and inhibit proliferation in OS cells, effective PPAR
agonists may be used as adjuvant therapeutic drugs for patients
with OS (38). The TF STAT3 has been
reported to serve functions in tumor cell survival, growth,
differentiation, metastasis, apoptosis and drug resistance
(39,40). In multidrug resistant OS cells, the
STAT3 signaling pathway is activated, and STAT3 phosphorylation and
nuclear translocation are inhibited by the synthetic oleanane
triterpenoid CDDO-Me, which may induce apoptosis (41). Dihydrofolate reductase, MYC and other
prognostic markers may be used to identify patients with early
stage OS that exhibit an increased risk of adverse outcomes
(42). Furthermore, the protein
expression of MYC, p53, BCL2, and the apoptotic index may be used
to predict the progression and prognosis of OS, and for selecting
an optimal treatment (43).
Therefore, the TFs EGR1, NF-κB complex subunits, PPARA, STAT3 and
MYC identified in the promoter region of EGFR may also function in
the progression of OS.
To conclude, the present study identified a total of
323 DEGs between the metastatic and non-metastatic samples. The
methylation of the CpG islands, starting from the 400 bp of the
EGFR promoter sequence, may be used to regulate EGFR expression.
Furthermore, the TFs EGR1, NF-κB complex subunits, PPARA, STAT3 and
MYC identified in the promoter region of EGFR may be associated
with the progression of OS. However, the results of the present
study, predicted by bioinformatics, require further study for
validation.
Glossary
Abbreviations
Abbreviations:
|
OS
|
osteosarcoma
|
|
DEG
|
differentially expressed gene
|
|
PPI
|
protein-protein interaction
|
|
TF
|
transcription factor
|
|
EMT
|
epithelial-mesenchymal transition
|
|
SNAI1
|
snail family transcriptional repressor
1
|
|
FDR
|
false discovery rate
|
|
STRING
|
Search Tool for the Retrieval of
Interacting Genes
|
|
GO
|
Gene Ontology
|
|
EGR1
|
early growth response 1
|
|
PPARA
|
peroxisome proliferator activated
receptor α
|
|
STAT3
|
signal transducer and activator of
transcription 3
|
|
MYC
|
MYC proto-oncogene
|
|
MAPK
|
mitogen-activated protein kinase
|
|
ERBB
|
erb-b2 receptor tyrosine kinase
|
|
SLC16A1
|
solute carrier family 16 member 1
|
References
|
1
|
Luetke A, Meyers PA, Lewis I and Juergens
H: Osteosarcoma treatment - where do we stand? A state of the art
review. Cancer Treat Rev. 40:523–532. 2014. View Article : Google Scholar : PubMed/NCBI
|
|
2
|
Moore DD and Luu HH: Osteosarcoma. Cancer
Treat Res. 162:65–92. 2014. View Article : Google Scholar : PubMed/NCBI
|
|
3
|
Ottaviani G, Jaffe N, Eftekhari F, Raymond
AK and Yasko AW: Pediatric and Adolescent Osteosarcoma. Springer;
Berlin: 2011
|
|
4
|
Ottaviani G and Jaffe N: The epidemiology
of osteosarcoma. Cancer Treat Res. 152:3–13. 2009. View Article : Google Scholar : PubMed/NCBI
|
|
5
|
Zhao S, Kurenbekova L, Gao Y, Roos A,
Creighton CJ, Rao P, Hicks J, Man TK, Lau C, Brown AM, et al: NKD2,
a negative regulator of Wnt signaling, suppresses tumor growth and
metastasis in osteosarcoma. Oncogene. 34:5069–5079. 2015.
View Article : Google Scholar : PubMed/NCBI
|
|
6
|
Fujiwara T, Takahashi RU, Kosaka N, Nezu
Y, Kawai A, Ozaki T and Ochiya T: RPN2 gene confers osteosarcoma
cell malignant phenotypes and determines clinical prognosis. Mol
Ther Nucleic Acids. 3:e1892013. View Article : Google Scholar
|
|
7
|
Wang L, Zhang Q, Chen W, Shan B, Ding Y,
Zhang G, Cao N, Liu L and Zhang Y: B7-H3 is overexpressed in
patients suffering osteosarcoma and associated with tumor
aggressiveness and metastasis. PLoS One. 8:e706892013. View Article : Google Scholar : PubMed/NCBI
|
|
8
|
Yang H, Zhang Y, Zhou Z, Jiang X and Shen
A: Transcription factor Snai1-1 induces osteosarcoma invasion and
metastasis by inhibiting E-cadherin expression. Oncol Lett.
8:193–197. 2014. View Article : Google Scholar : PubMed/NCBI
|
|
9
|
Yang G, Yuan J and Li K: EMT transcription
factors: Implication in osteosarcoma. Med Oncol. 30:6972013.
View Article : Google Scholar : PubMed/NCBI
|
|
10
|
Al-Romaih K, Sadikovic B, Yoshimoto M,
Wang Y, Zielenska M and Squire JA: Decitabine-induced demethylation
of 5′ CpG island in GADD45A leads to apoptosis in osteosarcoma
cells 1. Neoplasia. 10:471–480. 2008. View Article : Google Scholar : PubMed/NCBI
|
|
11
|
Endo-Munoz L, Cai N, Cumming A, Macklin R,
Merida de Long L, Topkas E, Mukhopadhyay P, Hill M and Saunders NA:
Progression of osteosarcoma from a non-Metastatic to a metastatic
phenotype is causally associated with activation of an autocrine
and paracrine uPA axis. PLoS One. 10:e01335922015. View Article : Google Scholar : PubMed/NCBI
|
|
12
|
Barrett T, Wilhite SE, Ledoux P,
Evangelista C, Kim IF, Tomashevsky M, Marshall KA, Phillippy KH,
Sherman PM, Holko M, et al: NCBI GEO: Archive for functional
genomics data sets-update. Nucleic Acids Res. 41(Database issue):
D991–D995. 2013.PubMed/NCBI
|
|
13
|
Ritchie ME, Phipson B, Wu D, Hu Y, Law CW,
Shi W and Smyth GK: Limma powers differential expression analyses
for RNA-sequencing and microarray studies. Nucleic acids Res.
43:e472015. View Article : Google Scholar : PubMed/NCBI
|
|
14
|
Haynes W: Benjamini-Hochberg
methodEncyclopedia of Systems Biology. Springer; New York, NY: pp.
782013, View Article : Google Scholar
|
|
15
|
Jarabo A, Buisan R and Gutierrez D:
Bidirectional clustering for scalable VPL-based global
illumination. Spanish Computer Graphics Conference. Moreno JL and
Sber M: Eurographics Association; pp. 1–9. 2015; http://dx.doi.org/10.2312/ceig.20151196
|
|
16
|
Draisma J, Horobeţ E, Ottaviani G,
Sturmfels B and Thomas RR: The Euclidean distance degree of an
algebraic varietyFoundations of Computational Mathematics. 16.
Springer-Verlag; New York, NY: pp. 99–149, 1-51. 2016, View Article : Google Scholar
|
|
17
|
Kolde R: Pheatmap: Pretty Heatmaps.
2015.https://cran.r-project.org/web/packages/pheatmap/index.htmlJuly
2–2015
|
|
18
|
De Winter JCF: Using the Student's
‘t’-test with extremely small sample sizes. Pract Assess Res Eval.
18:122013.
|
|
19
|
Szklarczyk D, Franceschini A, Kuhn M,
Simonovic M, Roth A, Minguez P, Doerks T, Stark M, Muller J, Bork
P, et al: The STRING database in 2011: Functional interaction
networks of proteins, globally integrated and scored. Nucleic Acids
Res. 39(Database issue): D561–D568. 2011. View Article : Google Scholar : PubMed/NCBI
|
|
20
|
Shi Z, Rui W, Feng Y and Guo J:
Bioinformatics Study on Relationship of Hyperlipidemia and
Phospholipids based on Cytoscape Software. Atlantis Press; pp.
357–360. 2014
|
|
21
|
Gene Ontology Consortium, . Gene Ontology
Consortium: Going forward. Nucleic Acids Res. 43(Database Issue):
D1049–D1056. 2015.PubMed/NCBI
|
|
22
|
Kotera M, Moriya Y, Tokimatsu T, Kanehisa
M and Goto S: KEGG and GenomeNet, new developments, metagenomic
analysisEncyclopedia of Metagenomics. Nelson K: Springer; New York,
NY: pp. 329–339. 2015
|
|
23
|
Jiao X, Sherman BT, Huang da W, Stephens
R, Baseler MW, Lane HC and Lempicki RA: DAVID-WS: A stateful web
service to facilitate gene/protein list analysis. Bioinformatics.
28:1805–1806. 2012. View Article : Google Scholar : PubMed/NCBI
|
|
24
|
Xie C, Mao X, Huang J, Ding Y, Wu J, Dong
S, Kong L, Gao G, Li CY and Wei L: KOBAS 2.0: A web server for
annotation and identification of enriched pathways and diseases.
Nucleic Acids Res. 39:W316–W322. 2011. View Article : Google Scholar : PubMed/NCBI
|
|
25
|
Matys V, Kel-Margoulis OV, Fricke E,
Liebich I, Land S, Barre-Dirrie A, Reuter I, Chekmenev D, Krull M,
Hornischer K, et al: TRANSFAC and its module TRANSCompel:
Transcriptional gene regulation in eukaryotes. Nucleic Acids Res.
34(Database issue): D108–D110. 2006. View Article : Google Scholar : PubMed/NCBI
|
|
26
|
Blackledge NP, Thomson JP and Skene PJ:
CpG island chromatin is shaped by recruitment of ZF-CxxC proteins.
Cold Spring Har Perspect Biol. 5:a0186482013. View Article : Google Scholar
|
|
27
|
Sproul D, Kitchen RR, Nestor CE, Dixon JM,
Sims AH, Harrison DJ, Ramsahoye BH and Meehan RR: Tissue of origin
determines cancer-associated CpG island promoter hypermethylation
patterns. Genome Biol. 13:R842012. View Article : Google Scholar : PubMed/NCBI
|
|
28
|
Parker A, Proctor G and Spudich G: Ensembl
2012. Advances in Immunology. 2011.
|
|
29
|
Takai D and Jones PA: The CpG island
searcher: A new WWW resource. In Silico Biol. 3:235–340.
2003.PubMed/NCBI
|
|
30
|
Freeman SS, Allen SW, Ganti R, Wu J, Ma J,
Su X, Neale G, Dome JS, Daw NC and Khoury JD: Copy number gains in
EGFR and copy number losses in PTEN are common events in
osteosarcoma tumors. Cancer. 113:1453–1461. 2008. View Article : Google Scholar : PubMed/NCBI
|
|
31
|
Wang Q, Cai J, Wang J, Xiong C and Zhao J:
miR-143 inhibits EGFR-signaling-dependent osteosarcoma invasion.
Tumour Biol. 35:12743–12748. 2014. View Article : Google Scholar : PubMed/NCBI
|
|
32
|
Hughes DP, Thomas DG, Giordano TJ, Baker
LH and McDonagh KT: Cell surface expression of epidermal growth
factor receptor and Her-2 with nuclear expression of Her-4 in
primary osteosarcoma. Cancer Res. 64:2047–2053. 2004. View Article : Google Scholar : PubMed/NCBI
|
|
33
|
Do SI, Jung WW, Kim HS and Park YK: The
expression of epidermal growth factor receptor and its downstream
signaling molecules in osteosarcoma. Int J Oncol. 34:797–803.
2009.PubMed/NCBI
|
|
34
|
Yu DH, Ware C, Waterland RA, Zhang J, Chen
MH, Gadkari M, Kunde-Ramamoorthy G, Nosavanh LM and Shen L:
Developmentally programmed 3′ CpG island methylation confers
tissue- and cell-type-specific transcriptional activation. Mol Cell
Biol. 33:1845–1858. 2013. View Article : Google Scholar : PubMed/NCBI
|
|
35
|
Mcmahon AP, Champion JE, McMahon JA and
Sukhatme VP: Developmental expression of the putative transcription
factor Egr-1 suggests that Egr-1 and c-fos are coregulated in some
tissues. Development. 108:281–287. 1990.PubMed/NCBI
|
|
36
|
Windischhofer W, Huber E, Rossmann C,
Semlitsch M, Kitz K, Rauh A, Devaney T, Leis HJ and Malle E:
LPA-induced suppression of periostin in human osteosarcoma cells is
mediated by the LPA(1)/Egr-1 axis. Biochimie. 94:1997–2005. 2012.
View Article : Google Scholar : PubMed/NCBI
|
|
37
|
Zhao Z, Wu MS, Zou C, Tang Q, Lu J, Liu D,
Wu Y, Yin J, Xie X, Shen J, et al: Downregulation of MCT1 inhibits
tumor growth, metastasis and enhances chemotherapeutic efficacy in
osteosarcoma through regulation of the NF-κB pathway. Cancer Lett.
342:150–158. 2013. View Article : Google Scholar : PubMed/NCBI
|
|
38
|
Wagner ER, He BC, Chen L, Zuo GW, Zhang W,
Shi Q, Luo Q, Luo X, Liu B, Luo J, et al: Therapeutic Implications
of PPARgamma in Human Osteosarcoma. PPAR Res. 2010:9564272010.
View Article : Google Scholar : PubMed/NCBI
|
|
39
|
Lai R, Navid F, Rodriguez-Galindo C, Liu
T, Fuller CE, Ganti R, Dien J, Dalton J, Billups C and Khoury JD:
STAT3 is activated in a subset of the Ewing sarcoma family of
tumours. J Pathol. 208:624–632. 2006. View Article : Google Scholar : PubMed/NCBI
|
|
40
|
Chen CL, Loy A, Ling C, Chan C, Hsieh FC,
Cheng G, Wu B, Qualman SJ, Kunisada K, Keiko YT and Lin J: Signal
transducer and activator of transcription 3 is involved in cell
growth and survival of human rhabdomyosarcoma and osteosarcoma
cells. BMC Cancer. 7:1112007. View Article : Google Scholar : PubMed/NCBI
|
|
41
|
Ryu K, Susa M, Choy E, Yang C, Hornicek
FJ, Mankin HJ and Duan Z: Oleanane triterpenoid CDDO-Me induces
apoptosis in multidrug resistant osteosarcoma cells through
inhibition of Stat3 pathway. BMC Cancer. 10:1872010. View Article : Google Scholar : PubMed/NCBI
|
|
42
|
Scionti I, Michelacci F, Pasello M,
Hattinger CM, Alberghini M, Manara MC, Bacci G, Ferrari S,
Scotlandi K, Picci P and Serra M: Clinical impact of the
methotrexate resistance-associated genes C-MYC and dihydrofolate
reductase (DHFR) in high-grade osteosarcoma. Ann Oncol.
19:1500–1508. 2008. View Article : Google Scholar : PubMed/NCBI
|
|
43
|
Wu X, Cai ZD, Lou LM and Zhu YB:
Expressions of p53, c-MYC, BCL-2 and apoptotic index in human
osteosarcoma and their correlations with prognosis of patients.
Cancer Epidemiol. 36:212–216. 2012. View Article : Google Scholar : PubMed/NCBI
|