Introduction
Epidemiological studies have revealed that 70% of
tumors in humans result from environmental hazards and that among
the many environmental hazards, 70–90% are chemical carcinogens, of
which arylamines are an important type. Most arylamines are not
active carcinogens themselves, but are transformed into carcinogens
in the human body by relevant enzymes such as arylamine
N-acetyltransferases (NATs). Furthermore, NATs represent the first
and the rate-limiting step in the reactions leading to the
activation of arylamines. Arylamine N-acetyltransferasesv (NATs)
are phase II metabolizing enzymes that can transfer the acetyl
group from AcCoA onto arylamines, activating arylamines into
carcinogens. Thus, the activity of NATs in the human body is
closely associated with the susceptibility to tumors. Tiang et
al revealed that NAT1 is a novel target for breast cancer
treatment (1), and concomitantly we
reported that the NAT enzyme is a new inhibitor of apoptosis
(2). Sugamori et al revealed
that NAT deficiency reduces the risk for ABP-induced liver tumors
(3). To date, studies of active
ingredients on NAT activity have been focused on lung (4), colon (5–7),
prostate cancer (8), and mouse
leukemia (9), while relatively
little research has been performed on the relationship between the
occurrence of hepatocarcinoma and NATs. Furthermore, researchers
reported that aqueous extract of Solanum nigrum L. affected
the NAT enzyme activity and gene expression in human gastric and
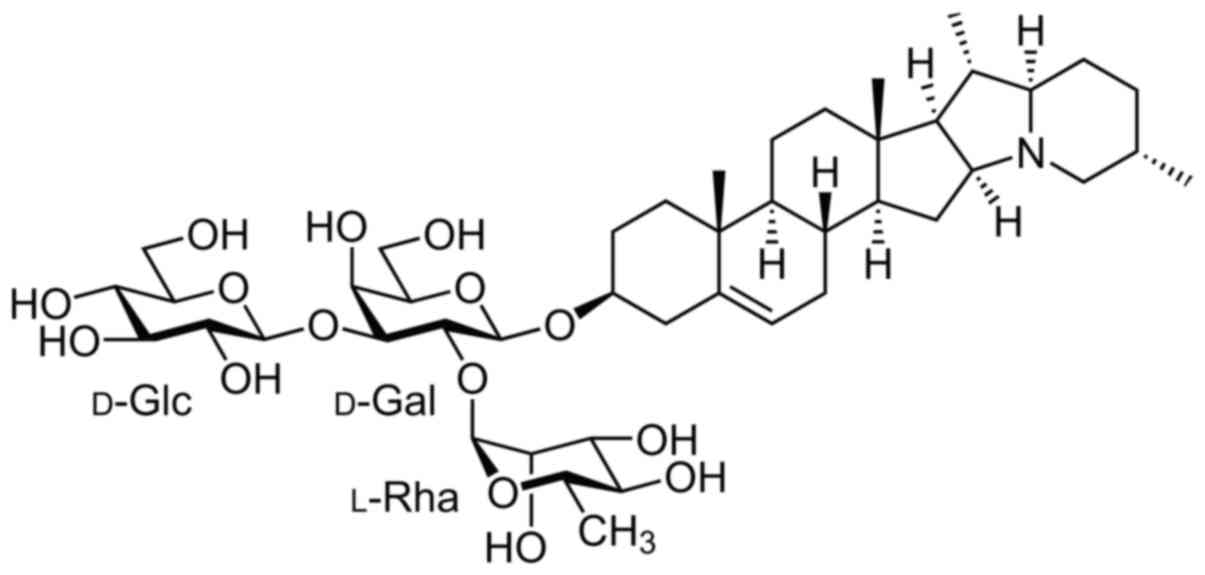
colon cancer (10,11). α-solanine, as displayed in Fig. 1 which reveals its molecular
structure, is one of the chemical components in Solanum
nigrum L. (12,13). The question arised as to whether
α-solanine could affect NAT enzyme activity. We previously revealed
that α-solanine had a cytotoxic effect on HepG2 cells (14), therefore it was speculated that
α-solanine could affect the NAT activity in HepG2 cells and may be
a target of proliferation inhibition. Subsequently, in the present
study, we observed the effect of α-solanine on the activity, gene
expression, and kinetics of arylamine N-acetyltransferase in HepG2
cells.
Materials and methods
Cell line and cell culture
The human liver cancer HepG2 cell line was obtained
from the Institute of Cancer Prevention and Control of Harbin
Medical University (Harbin, Heilongjiang, China). The cells were
grown in RPMI-1640 medium containing 10% fetal bovine serum at 37°C
in a humidified atmosphere containing 5% CO2. Cells were
harvested by trypsinization with 0.25% trypsin solution and
suspended in culture medium before use.
Chemicals and reagents
α-solanine, 2-aminofluorene (2-AF), acetylcarnitine,
carnitine acetyltransferase, 2-acetylaminofluorene (2-AAF), Tris,
DTT, leupeptin, AcCoA, BSA, DEPC, DTNB and agarose were obtained
from Sigma-Aldrich (St. Louis, MO, USA). PMSF and EB were obtained
from Amresco, LLC (Solon, OH, USA). RPMI-1640, trypsin and TRIzol
were obtained from Thermo Fisher Scientific, Inc. (Waltham, MA,
USA). Fetal bovine serum was purchased from GE Healthcare Life
Sciences (Pittsburgh, PA, USA). The NAT primer was obtained from
Sangon Biotech Co., Ltd. (Shanghai, China) and the RT-PCR kit was
obtained from Takara Bio, Inc. (Kusatsu, Shiga, Japan).
Preparation of HepG2 cell lysates
HepG2 cells (1×10⁷) were placed in 2 ml
of lysis buffer [20 mM Tris-HCl (pH 7.5), 1 mM DTT, 1 mM EDTA, 50
µM PMSF and 10 µm leupeptin] and ultrasonicated for 20 min at 4°C.
The suspension was centrifuged for 1 min at 9,000 × g and then the
supernatant was centrifuged for 60 min at 10,000 × g. Subsequently,
the supernatant was kept on ice for NAT activity. The Bradford
assay was used for protein determination.
NAT activity determination by
HPLC
NAT activity was calculated by total amounts of
acetylated 2-AF (2-AAF), which were determined by HPLC (Waters
Corp., Milford, MA, USA). The HPLC conditions were: a Symmetry
Shield RP C18 column (4.6 mm × 250 mm, 5 µm, 100 Å), a
mobile phase consisting of 20 mM KH2PO4 (pH
4.5):CH3CN = 53:47, a 2487 UV detector (wavelength 288
nm) and a column temperature of 25±5°C. The peak area was
automatically integrated using the Empower workstation software.
The standard curve was plotted using GraphPad Prism 5 software,
with the concentration of the standard sample 2-AAF and the peak
area as the horizontal and the vertical axis, respectively. A
regression equation for the standard curve was calculated using
GraphPad Prism 5 software.
α-solanine affects NAT activity in
HepG2 intact cells
HepG2 cells at the logarithmic growth phase were
incubated with 45 µM of 2-AF as the substrate and different
concentrations of α-solanine (0, 0.016, 0.08, 0.4, 2 and 10 µg/ml)
for 24 h, or 2 µg/ml α-solanine at different treatment time-points
(12, 24, 36 and 48 h). Then, the culture medium was centrifuged for
10 min at 3,500 × g, and the supernatants were immediately
extracted with equal volumes of ethyl acetate:methanol (95:5). The
supernatants were then evaporated until the samples were dry, after
which the residue was dissolved in 2 ml of methanol. The amounts of
the 2-AAF in the samples were assessed using HPLC with an automatic
sample injection of 20 µl. The retention time was about 13.5 min
for 2-AAF and about 17 min for 2-AF. NAT activity was examined
through HPLC analysis of the yield of 2-AAF and expressed as nmol
acetylated substrate/106 cells.
α-solanine affects NAT acivity in
HepG2 lysates
The amount of 2-AAF (2-AF acetylated by
AcCoA-dependent NAT) was used as a measurement for NAT activity in
HepG2 lysates. The total volume of the reaction mixture was 550 µl,
including 250 µl of the cytoplasm solution and 100 µl of the
cycling mixture [50 mM Tris-HCl (pH 7.5), 0.2 mM EDTA, 2 mM DTT, 15
mM acetylcarnitine, and 2 U/ml carnitine acetyltransferase]. A
suitable amount of 2-AF and α-solanine were added to reach a final
concentration of 0.04 mM for 2-AF, and 0.016, 0.08, 0.4, 2 and 10
µg/ml, respectively, for α-solanine. The reaction was started by
adding AcCoA (0.45 mM, final concentration). Distilled water (200
µl) was added instead of AcCoA in the blank control reactions. The
mixtures were incubated for 6 h at 37°C and 900 µl of acetonitrile
was added to terminate the reaction. Then the mixtures were
filtered and the NAT activity was determined as aforementioned.
α-solanine affects the kinetic
constants of NAT in intact HepG2 cells or lysates
For the intact cells, HepG2 cells co-treated with or
without 2 µM α-solanine and different concentrations of AF (5.625,
11.25, 22.5, 45 and 90 µM) were used to assess NAT activity as
aforementioned. For the cytoplasm groups, cell lysates co-treated
with or without 2 µM α-solanine and different concentrations of AF
(20.45, 40.90, 81.80, 163.60 and 327.20 µM) were used to assess NAT
activity as aforementioned. The data was used to draw the
Lineweaver-Burk's double-reciprocal plot and calculate the
Michaelis-Menten constant (Km) and maximum reaction rate
(Vmax) according to
V0=Vmax[S]Km+[S]1V0=Km+[S]Vmax[S]=KmVmax1[S]+1Vmax
the following formula:
The S is the concentration of the substrate (2-AF),
the V0 is the reaction rate, which is associated with
the amount of 2-AAF produced.
α-solanine affects the gene expression
of NAT1 and NAT2
Total RNA was extracted from HepG2 cells 24 h after
treatment with different concentrations (0.016, 0.08, 0.4, 2 and 10
µg/ml) of α-solanine. TRIzol (1 ml) was added after the cells were
rinsed with DEPC (diethyl pyrocarbonate)-treated water and after 30
min, the suspension was placed in 1.5-ml Eppendorf tubes.
Chloroform (0.2 ml) was added, and the tubes were vigorously shaken
for 15 sec to allow thorough mixing. The aqueous phase was then
placed in other Eppendorf tubes and the same volume of isopropanol
was added before the samples were centrifuged for 15 min at 12,000
× g. The supernatant was discarded, and the precipitation was the
total RNA. The subsequent procedures for conducting reverse
transcription and PCR were exactly the same as those in the
instruction manual [Takara RNA PCR kit (AMV) Ver.3.0; Takara Bio,
Otsu, Japan]. Each amplification for NAT1 was performed for 30
cycles, one cycle profile consisted of denaturation at 94°C for 30
sec, annealing at 58°C for 30 sec and extension at 72°C for 80 sec.
For NAT2 each amplification was performed for 26 cycles, one cycle
profile consisted of denaturation at 94°C for 30 sec, annealing at
58°C for 30 sec and extension at 72°C for 60 sec. PCR products were
visualized by eletrophoresis using 1.5% agarose gels and quantified
with Tianneng GIS gel analyzing software (Tianneng, Shanghai,
China). Parallel reactions were run using human-actin as a control
for RT-PCR.
The sequence of the primers was as follows:
B-MDIEA-NAT1, 5′-CACCCGGATCCGGGATCATGGACATTGAA GC-3′, nt 435–454,
GenBank accession no. X17059; VPKHGD-X-NAT1,
5′-GGTCCTCGAGTCAATCACCATGTTTGGGCAC-3′, nt 1295–1278, GenBank
accession no. X17059; FP1-NAT2, 5′-CTAGTTCCTGGTTGCTGGCC-3′, nt
79–98, GenBank accession no. NM-000015; RP1-NAT2,
5′-TAACGTGAGGGTAGAGAGGA-3′, nt 1073–1054, GenBank accession no.
NM-000015; Act b1, 5′-GCTCGTCGTCGACAACGGCTC-3′, nt 94–114, GenBank
accession no. NM-001101; Act2 b2, 5′-CAAACATGATCTGGGTCATCTTCTC-3′
and nt 446–422, GenBank accession no. NM-001101 (15).
Statistical analysis
The data are presented as the mean ± SD. Statistical
analysis of group differences was performed using Student's t-test.
A value of P<0.05 was considered to be statistically
significant.
Results
α-solanine affects NAT activity in
HepG2 intact cells
The effects of α-solanine on NAT activity in HepG2
intact cells were observed by HPLC. The amount of 2-AAF transformed
from 2-AF was used to assess NAT activity. Suspensions of HepG2
cells treated with 45 µM of 2-AF and with various concentrations
(0.016, 0.08, 0.4, 2 and 10 µg/ml) of α-solanine exhibited a
decreased amount of 2-AAF produced when compared to the control
(not treated with α-solanine) (Fig.
2A). The amount of 2-AAF produced gradually increased with the
increase in treatment time (12, 24, 36 and 48 h). However, the
amount of 2-AAF produced was significantly lower for α-solanine
than for the control (Fig. 2B). The
data indicated that α-solanine induced a dose- and time-dependent
reduction of NAT activity in intact HepG2 cells.
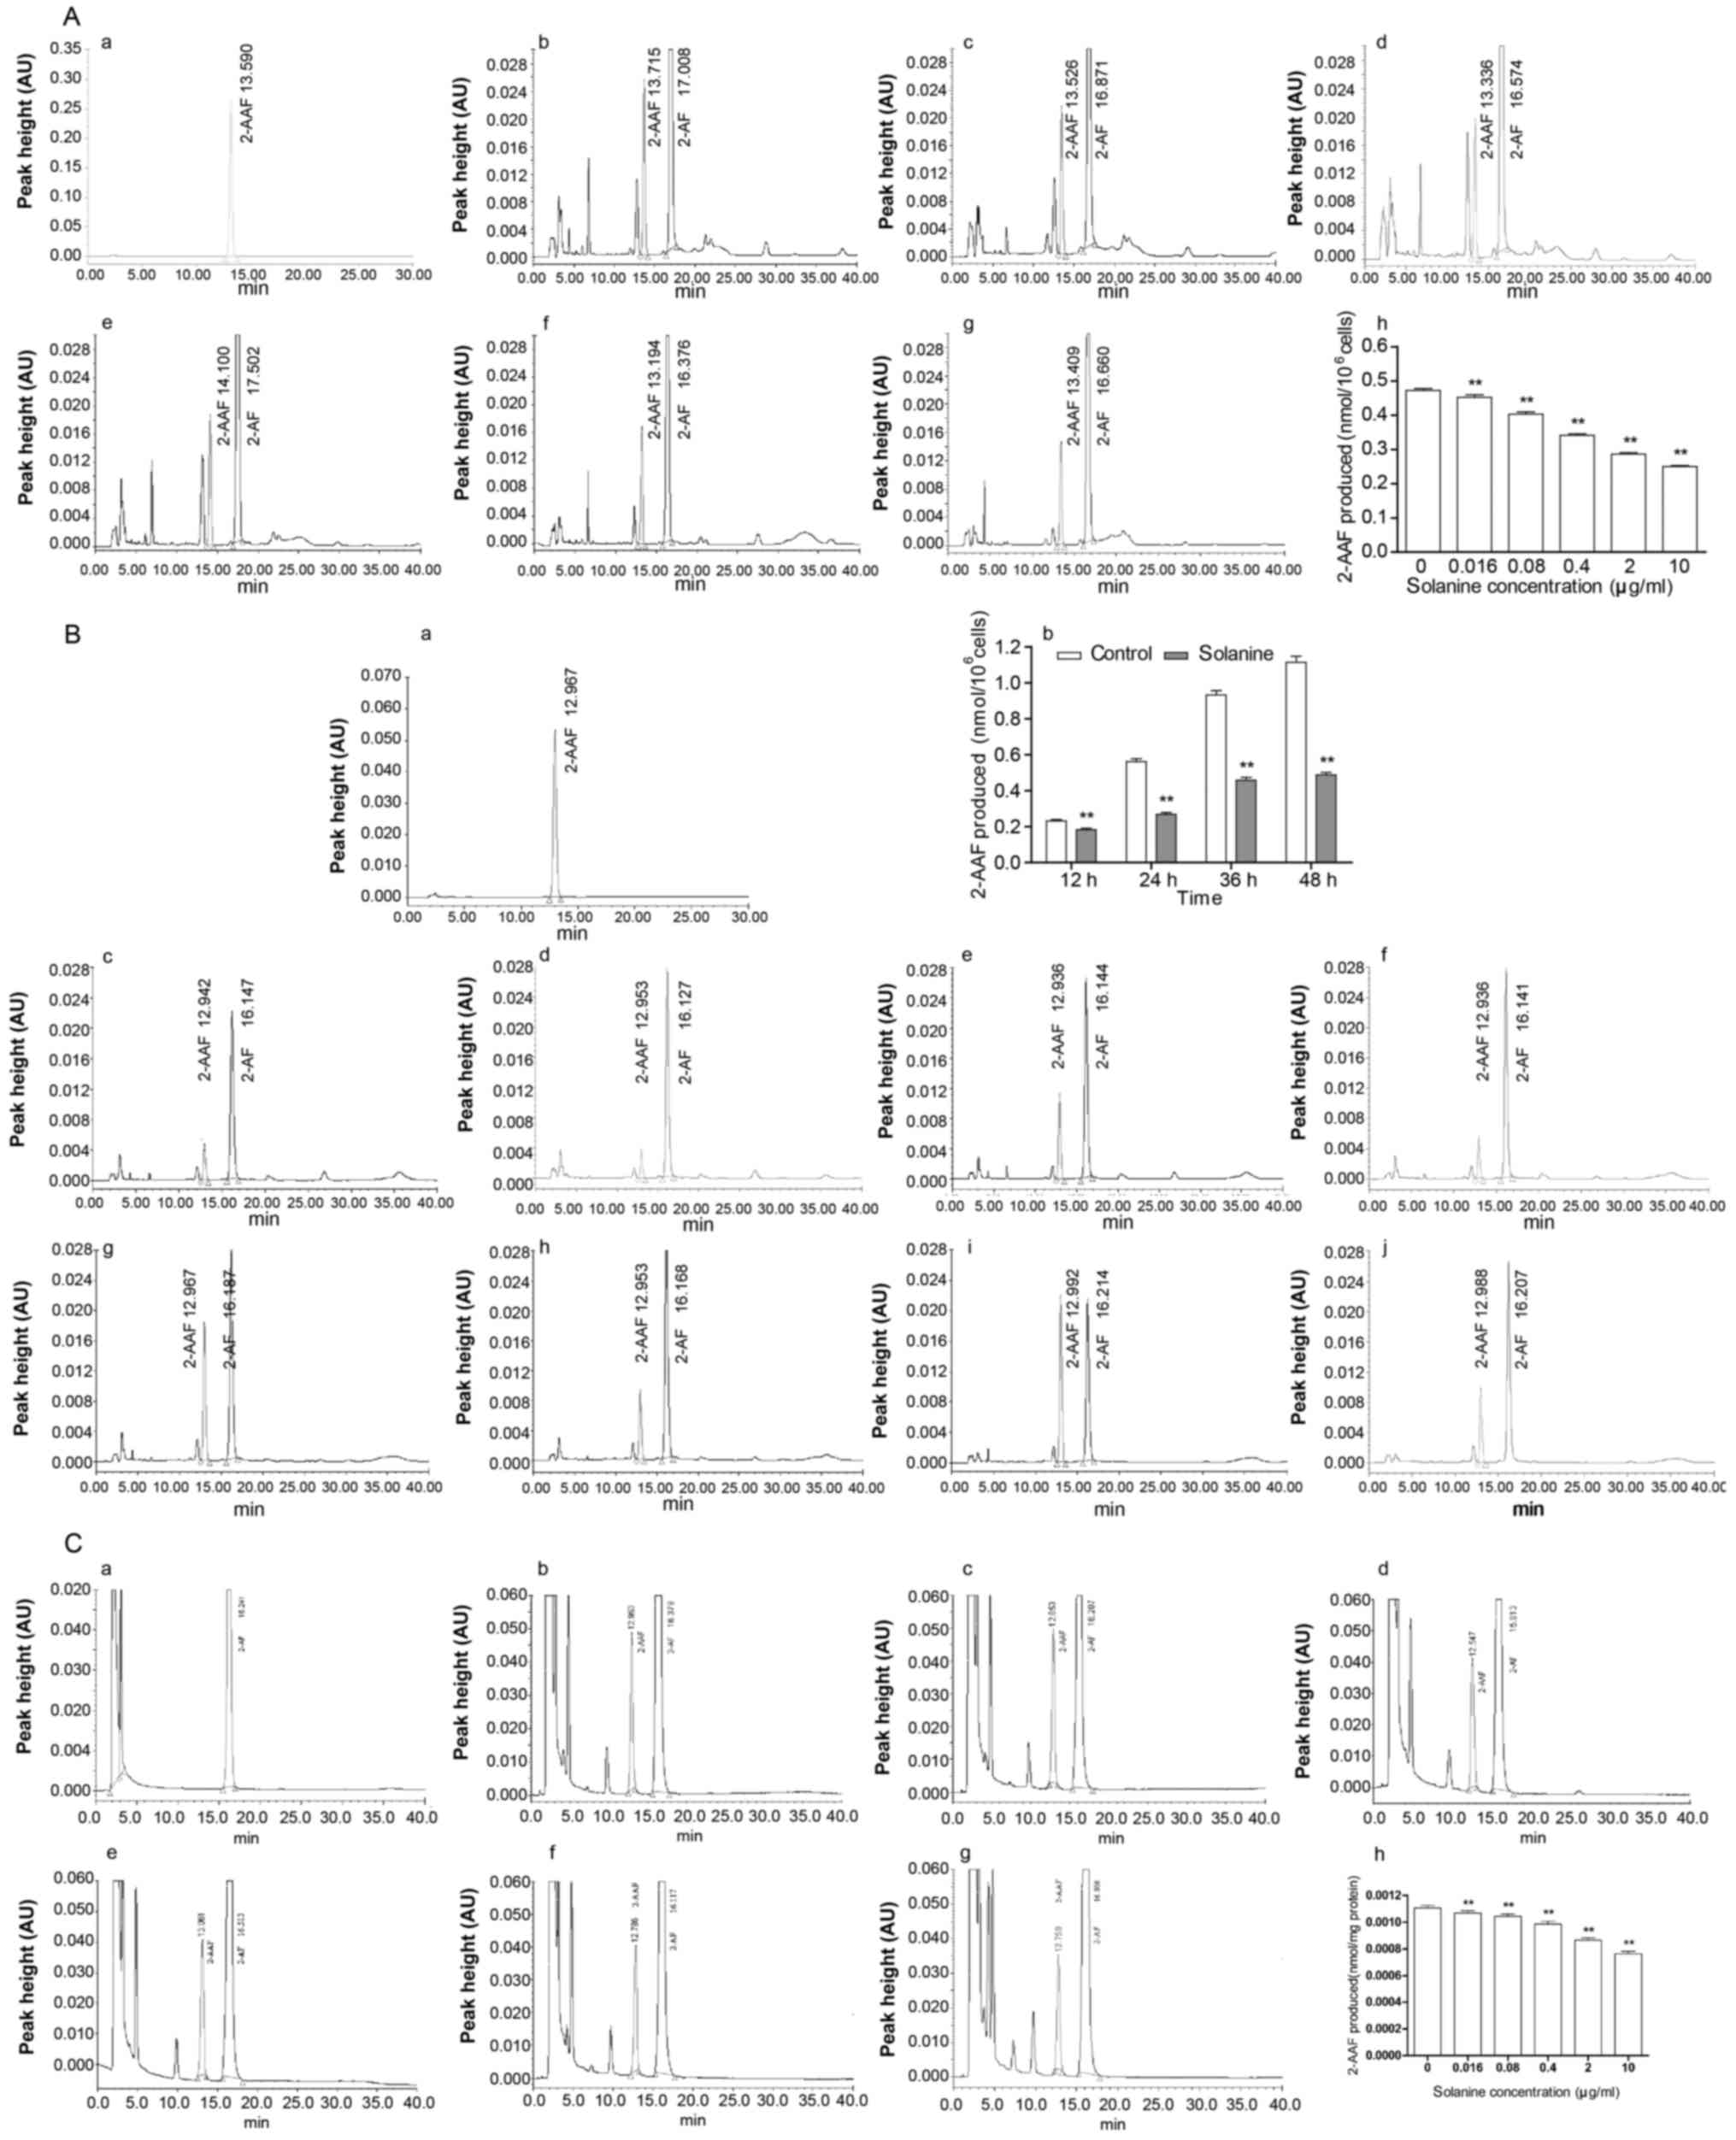 | Figure 2.Effect of α-solanine on NAT activity
in HepG2 cells. The amounts of 2-AAF (the acetylated AF) were used
to represent NAT activity. (A) The effect of α-solanine at various
concentrations on NAT activity in intact HepG2 cells. (a) 2-AAF
standard substance, (b) control, (c) 0.016 µg/ml α-solanine, (d)
0.08 µg/ml α-solanine, (e) 0.4 µg/ml α-solanine, (f) 2 µg/ml
α-solanine, (g) 10 µg/ml α-solanine and (h) histogram of 2-AAF
produced. (B) The effect of α-solanine at various treatment times
on NAT activity in intact HepG2 cells. (a) 2-AAF standard
substance, (b) histogram of 2-AAF produced. (c) 12-h control, (d)
12 h of α-solanine, (e) 24-h control, (f) 24 h of α-solanine, (g)
36-h control, (h) 36 h of α-solanine, (i) 48-h control, (j) 48 h of
α-solanine. (C) The effect of α-solanine on NAT activity in the
cytoplasm of HepG2 cells. (a) blank control, (b) negative control,
(c) 0.0032 µg/ml α-solanine, (d) 0.016 µg/ml α-solanine, (e) 0.08
µg/ml α-solanine, (f) 0.4 µg/ml α-solanine, (g) 2.0 µg/ml
α-solanine and (h) histogram of 2-AAF produced. |
α-solanine affects NAT acivity in
HepG2 lysates
The effects of α-solanine on NAT activity in the
lysates of HepG2 cells were observed by HPLC. The amount of 2-AAF
transformed from 2-AF was used to assess the NAT activity. Lysates
of HepG2 cells treated with a suitable amount of 2-AF and with
various concentrations of α-solanine (0.016, 0.08, 0.4, 2 and 10
µg/ml) exhibited decreased amounts of 2-AAF produced than the
control (not treated with α-solanine) (Fig. 2C). The results indicated that
α-solanine induced dose-dependent reduction of NAT activity in the
lysates of HepG2 cells.
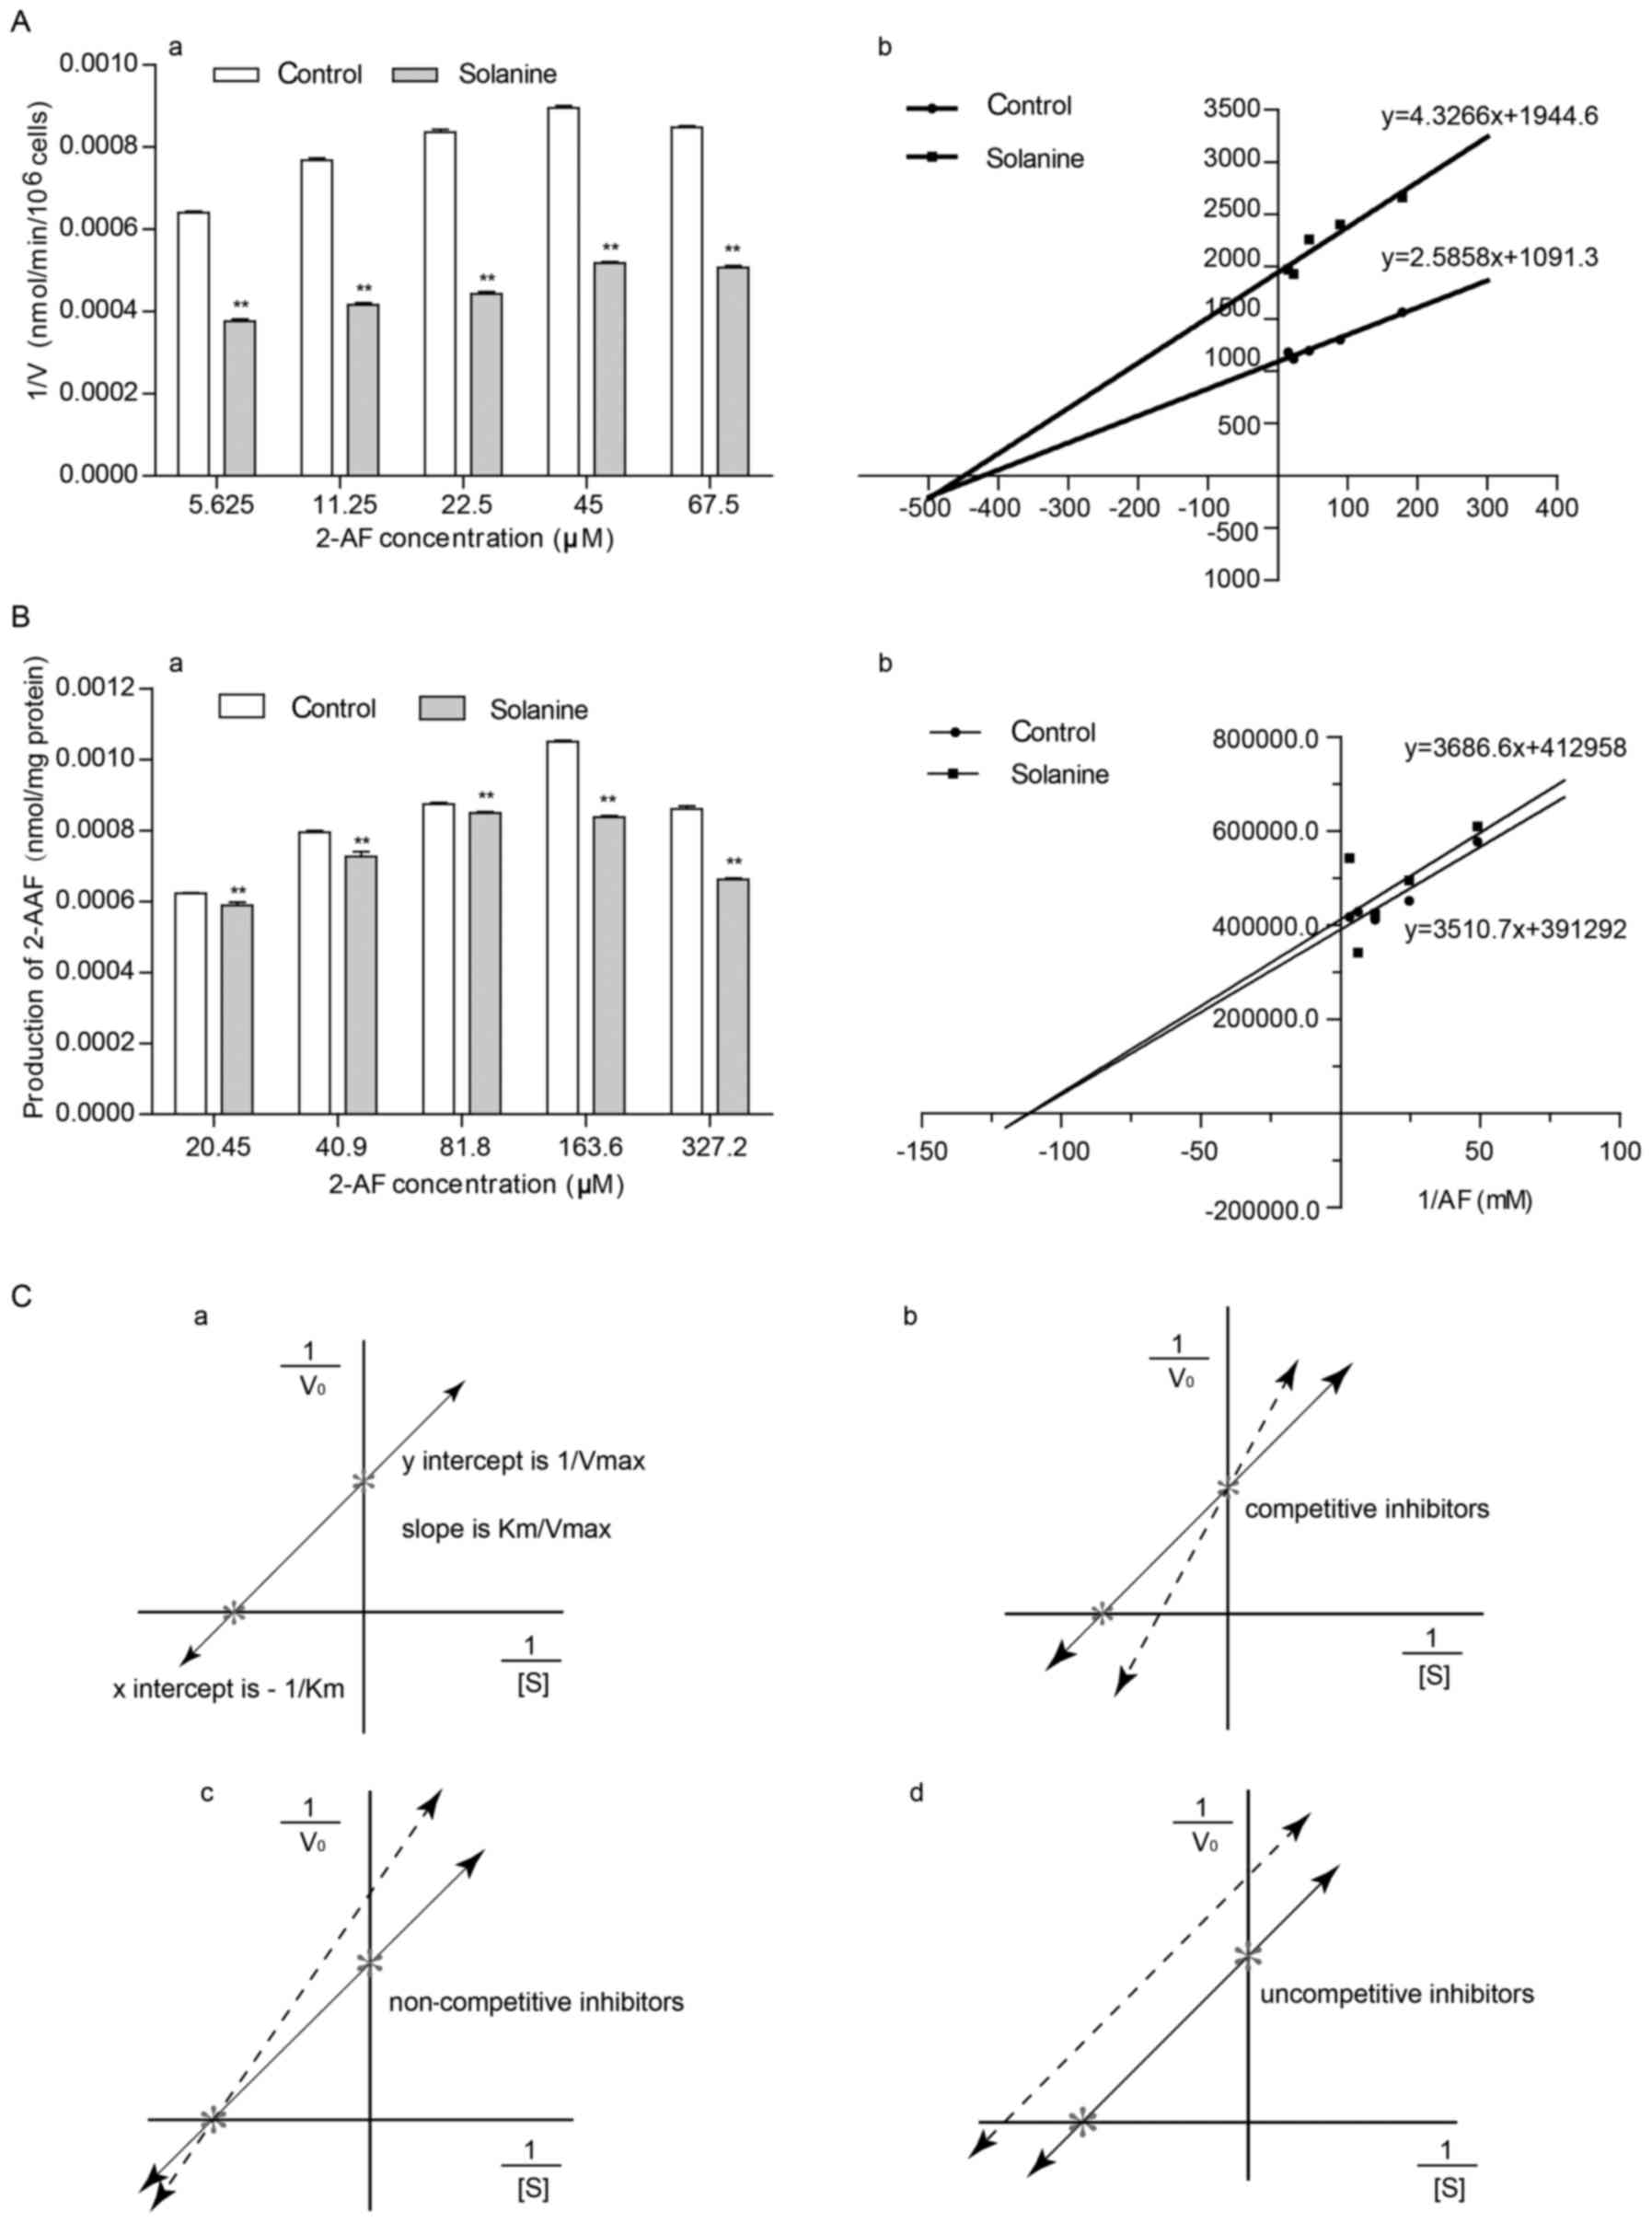
α-solanine affects the kinetic
constants of NAT in intact HepG2 cells or lysates
The effect of α-solanine on the production of 2-AAF
in intact HepG2 cells or lysates with various substrate (2-AF)
concentrations (5.625, 11.25, 22.5, 45 and 67.5 µM in intact HepG2
cells, and 20.45, 40.90, 81.80, 163.60 and 327.20 µM for the
cytoplasm of HepG2 cells) was examined by HPLC. The results
revealed the same pattern for both intact cells and the cytoplasm,
namely, the amount of 2-AAF produced and the concentration of the
substrate 2-AF gradually increased within a certain range and that
with the same substrate concentration, α-solanine could inhibit the
formation of 2-AAF (Fig. 3A-a and
B-a; Tables I and II). A double-reciprocal plot was produced
in order to observe the effect of α-solanine on the kinetic
constants for NAT (Fig. 3A-b and
B-b, Table III) and it was
discovered that α-solanine could decrease Vmax (the
maximum reaction rate), but had no effect on Km
(Michaelis-Menten constant), which revealed that α-solanine is a
non-competitive inhibitor (Fig. 3A-b,
B-b and C).
 | Table I.The effect of α-solanine on the
production of 2-AAF in intact HepG2 cells at different substrate
(2-AF) concentrations. |
Table I.
The effect of α-solanine on the
production of 2-AAF in intact HepG2 cells at different substrate
(2-AF) concentrations.
|
| 2-AAF peak areas
(AU) | Production of 2-AAF
(nmol/106 cells) |
|---|
|
|
|
|
|---|
| 2-AF (µM) | Control | α-solanine | Control | α-solanine |
|---|
| 5.625 |
818641.00±1098.50 |
479033.33±1635.47 |
6.40×10⁻⁴±3.97×10⁻⁶ |
3.76×10⁻⁴±4.39×10⁻⁶b |
| 11.25 |
984393.33±2024.22 |
531009.33±2731.91 |
7.68×10⁻⁴±4.69×10⁻⁶ |
4.16×10⁻⁴±5.24×10⁻⁶b |
| 22.5 |
1071720.00±4632.22 |
565358.67±1996.34 |
8.36×10⁻⁴±6.72×10⁻⁶ |
4.43×10⁻⁴±4.67×10⁻⁶b |
| 45 |
1147756.67±3051.63 |
661883.33±701.21 |
8.95×10⁻⁴±5.49×10⁻⁶ |
5.18×10⁻⁴±3.66×10⁻⁶b |
| 67.5 |
1086149.00±13513.75 |
648047.33±8991.60 |
8.48×10⁻⁴±1.32×10⁻⁶ |
5.07×10⁻⁴±1.01×10⁻⁶b |
| Table II.The effect of α-solanine on the yield
of 2-AAF in the cytoplasm of HepG2 cells at different substrate
concentrations. |
Table II.
The effect of α-solanine on the yield
of 2-AAF in the cytoplasm of HepG2 cells at different substrate
concentrations.
|
| 2-AAF peak areas
(AU) | Production of 2-AAF
(nmol/mg protein) |
|---|
|
|
|
|
|---|
| 2-AF (µM) | Control | α-solanine | Control | α-solanine |
|---|
| 20.45 |
64401±116 |
60684±957 |
6.23×10⁻⁴±1.06×10⁻⁶ |
5.89×10⁻⁴±8.71×10⁻⁶b |
| 40.90 |
83284±484 |
75797±1413 |
7.95×10⁻⁴±4.41×10⁻⁶ |
7.27×10⁻⁴±1.29×10⁻⁵b |
| 81.80 |
91959±56 |
89241±306 |
8.74×10⁻⁴±5.10×10⁻⁷ |
8.49×10⁻⁴±2.78×10⁻⁶b |
| 163.60 |
111603±231 |
87926±447 |
1.05×10⁻³±2.10×10⁻⁶ |
8.37×10⁻⁴±4.07×10⁻⁶b |
| 327.20 |
90585±828 |
68741±1274 |
8.61×10⁻⁴±7.54×10⁻⁶ |
6.62×10⁻⁴±1.16×10⁻⁶b |
| Table III.Kinetic data for acetylation of
2-aminofluorene (2-AF) in HepG2 cells. |
Table III.
Kinetic data for acetylation of
2-aminofluorene (2-AF) in HepG2 cells.
|
| In intact
cells | In the cytosol |
|---|
|
|
|
|
|---|
| Groups | Km
(mM) | Vmax
(nmol/106 cells) | Km
(mM) | Vmax
(nmol/min/mg protein) |
|---|
| Control |
2.37×10⁻³±8.37×10⁻⁵ |
9.16×10⁻⁴±7.54×10⁻⁵ |
8.95×10⁻³±2.61×10⁻⁴ |
2.55×10⁻⁶±1.92×10⁻⁸ |
| α-solanine |
2.22×10⁻³±9.05×10⁻⁵ |
5.14×10⁻⁴±3.72×10⁻⁵b |
9.48×10⁻³±3.63×10⁻⁴ |
2.43×10⁻⁶±1.32×10⁻⁸a |
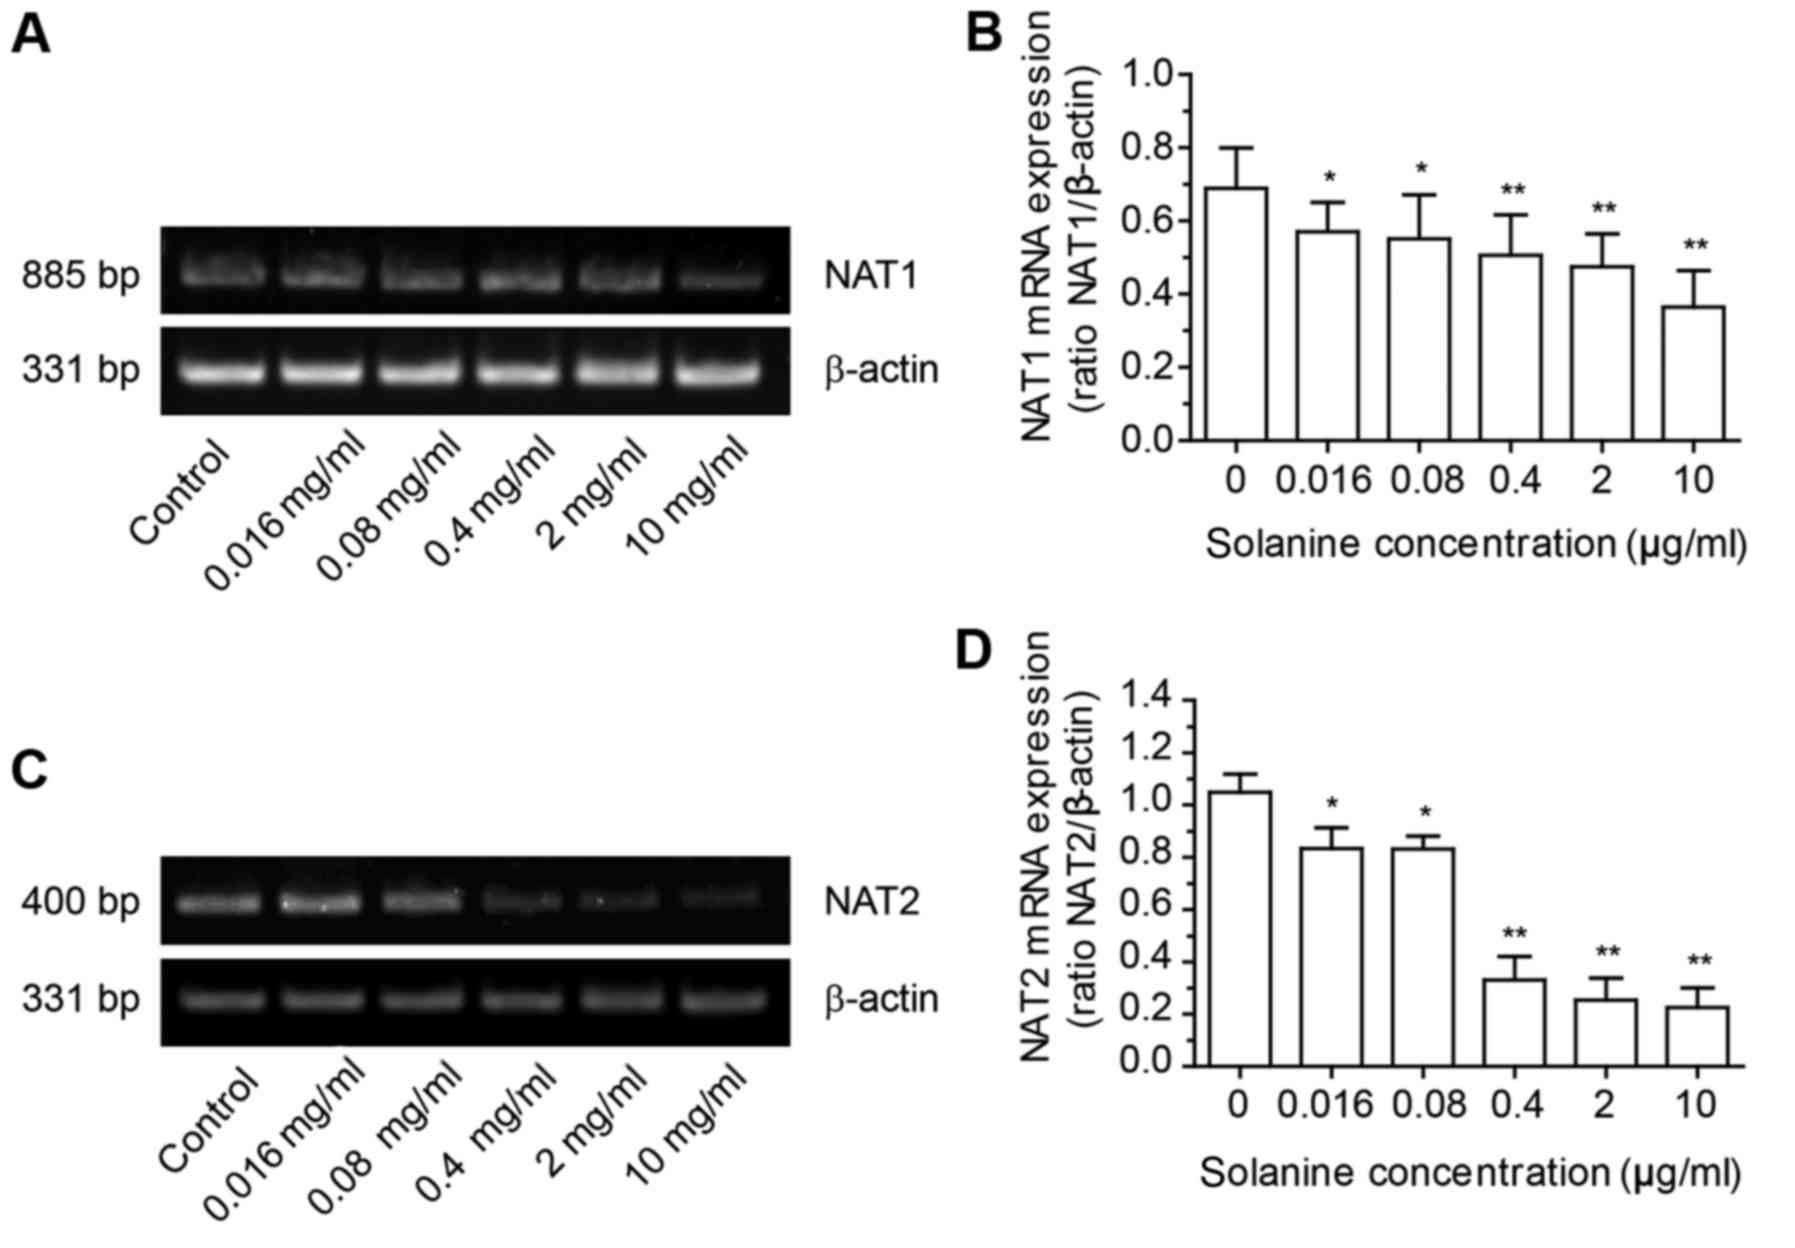
α-solanine affects the gene expression
of NAT1 and NAT2
Reverse transcription-polymerase chain reaction
(RT-PCR) was used to assess the gene expression of NAT in HepG2
cells treated with α-solanine. The mRNA levels of NAT and β-actin
were quantified by densitometric analysis of gel images and
expressed as NAT/β-actin (Fig. 4).
The results revealed that α-solanine could decrease the expression
of NAT1 mRNA and NAT2 mRNA in HepG2 cells.
Discussion
The arylamine N-acetyltransferases (NATs) are phase
II-drug metabolizing enzymes (16).
Their main function being to transfer the acetyl group from AcCoA
onto the nitrogen or oxygen atom in such substances such as
arylamines (17), hydrazines
(18), arylhydroxylamines (19) or arylhydrazines (17). These enzymes play an important role
in the metabolism of drugs (20)
and toxins as well as in detoxification (21,22).
Using 2-AF as an example, the process by which arylamines cause
cancer is as follows: first, NATs in the cell transform 2-AF into
N-acetyl-2-aminofluorene (2-AAF) (23), then 2-AAF is further activated by
other enzymes such as glucuronyltransferase, deacylase,
sulfotransferase and acyltransferase (24,25),
and ultimately transformed in the end to carcinogens nitrenium ion
and arylamidonium ion. These can react with guanines to produce
bulky adducts of N-deoxyguanaminofluorene and
N-deoxyguanacetaminofluorene, which are DNA-carcinogenic compounds.
Closely related to cytotoxicity, mutations, and carcinogenesis, the
formation of DNA-carcinogenic compounds is a crucial step in the
induction of cancer by arylamines (26). Researchers have pointed out that an
increase in NAT activity can increase the sensitivity of the
organism to many carcinogenetic arylamines.
α-solanine, isolated from fruits of nightshades
(27) or potato tubers (28), is a steroid alkaloid. We previously
determined that α-solanine can inhibit HepG2 cell proliferation
(29) and induce HepG2 cell
apoptosis (30), which is related
to the increase of [Ca2+]i in the cytoplasm
(14). Rodrigues-Lima et al
speculated that NAT1 may be a drug target (31). Butcher and Minchin reviewed
literature and thought that NAT1 may be a novel drug target in
cancer development (32). In
addition, researchers reported that aqueous extract of Solanum
nigrum L. affected NAT enzyme activity and gene expression in
human gastric and colon cancer (10,11).
α-solanine is one of the chemical components in Solanum
nigrum L. (12,13). The question arised as to whether
α-solanine could affect NAT enzyme activity. Ragunathan et
al reported that NAT1 is a new target of cisplatin in breast
cancer cells (33). We also found
that α-solanine could inhibit HepG2 cell proliferation (30), and thus, we speculated, whether NAT
is a target of α-solanine in HepG2 cells. We determined the effect
of α-solanine on NATs activity and the dosage of α-solanine in our
previous studies (30). The
experimental results revealed that α-solanine could lower the
amount of 2-AAF produced in both intact HepG2 cells and their
cytoplasm (34). The activities of
NATs were indirectly determined by measuring the amount of 2-AAF
transformed from 2-AF by NATs and the amount of 2-AAF was
determined by HPLC. The potential for arylamines to be transformed
into carcinogens depends on the levels of NATs in relevant tissues
and their capacity for activating compounds (35). Human NATs include NAT1 and NAT2.
2-AF is a rather typical arylamine and also the common substrate
for NAT1 and NAT2 and therefore it was chosen to be a suitable
substrate for the present experiment. The experimental results in
the present study revealed that α-solanine could decrease the
amount of 2-AAF produced in both intact HepG2 cells and their
cytoplasm, with the effect being dosage-dependent. With the
increase in reaction time, the amount of 2-AAF produced gradually
increased, but for the same amount of reaction time, the amount of
2-AAF produced was significantly lower in the α-solanine-treated
groups than in the control. The experimental results revealed that
α-solanine had an inhibitory effect on the activities of NATs,
which demonstrated that α-solanine is an inhibitor of NATs.
In enzyme kinetics, enzyme inhibitors are divided
into competitive inhibitors, non-competitive inhibitors and
uncompetitive inhibitors (Fig. 4).
To determine the type of group α-solanine belonged to, as a NAT
enzyme inhibitor, Lineweaver-Burk's double-reciprocal plot assay
was adopted. Measurements in the kinetic experiments revealed that
for both intact HepG2 cells and their cytoplasm, Km did
not differ significantly (P>0.05) between the α-solanine group
and the negative control (Table
III; Fig. 3A-b and B-b), while
the maximum reaction rate Vmax was decreased (Table III; Fig. 3A-b and B-b), revealing that
α-solanine is a non-competitive inhibitor. This allowed us to
deduce that the locus at which α-solanine acts on NATs differed
from that for 2-AF and that the locus is located out of the enzyme
active center. α-solanine does not compete with 2-AF for
combination with NAT enzyme.
Active ingredients competing for the locus of the
enzyme active center with enzyme substrates are similar to the
enzyme substrates in structure. The structure of α-solanine and
2-AF is entirely different, thus revealing that it is impossible
for α-solanine to be a competitive inhibitor of NAT and that it can
only be a non-competitive inhibitor. The conclusion is consistent
with our research results. It was speculated that NAT combines with
2-AF and α-solanine concurrently, which alters the enzyme
conformation and decreases NAT enzyme activity. Therefore,
α-solanine is a non-competitive inhibitor of NATs, the locus which
α-solanine acts on NATs differs from that for 2-AF. The
non-competitive inhibition of NAT activity by α-solanine is one of
the mechanisms through which it inhibits the deterioration of HepG2
cells.
The capacity of NATs to activate arylamines is not
only related to factors affecting NAT activity, but is closely
related to the levels of expression of NAT proteins. For a unit of
enzyme activity, the greater the amount of NAT proteins, the
greater the NAT activity. The amount of NAT proteins is
proportional to the expression of NAT mRNA, therefore in subsequent
experiments, the effect of α-solanine on the expression of the mRNA
of NATs was observed by RT-PCR.
NATs exist in many types of tissues in animal and
human bodies. In the human body, the NAT family consists of 3
members, namely, NAT1, NAT2, and NATP. NATP is a pseudogene which
does not code for any functional NAT, while NAT1 and NAT2 code for
the NAT1 and NAT2 protein, respectively (36). Results from the RT-PCR experiment
revealed that α-solanine could decrease the expression of NAT1 mRNA
and NAT2 mRNA, which indicated that by decreasing the expression of
NAT mRNA, α-solanine could decrease the amount of NAT expression,
which in turn led to a decrease in the production of acetylated
substrates. This resulted in an anti-HepG2 effect. RT-PCR analysis
is used to detect gene expression and western blot analysis is used
to detect protein expression. If the protein expression level of
NAT was detected, this would be useful to draw a conclusion.
However, due to the lack of commercialization of the antibodies of
the NAT enzyme, the effects of α-solanine on the expression of the
NAT protein are not currently available.
In conclusion, α-solanine achieves its inhibitory
effect on HepG2 cells by inhibiting the expression of NAT1 mRNA and
NAT2 mRNA in HepG2 cells as well as the activity of NAT. α-solanine
is a non-competitive inhibitor of NAT. α-solanine does not compete
for the locus of the NAT enzyme active center with 2-AF, NAT
combines with 2-AF and α-solanine concurrently which alters the
enzyme conformation and decreases NAT enzyme activity. This is one
possibility. Another possibility is that the decreased NAT mRNA
expression may be the reason for the decreased activity of NAT.
Thus, the specific mechanism involved warrants further study.
Acknowledgements
Not applicable.
References
|
1
|
Tiang JM, Butcher NJ and Minchin RF: Small
molecule inhibition of arylamine N-acetyltransferase Type I
inhibits proliferation and invasiveness of MDA-MB-231 breast cancer
cells. Biochem Biophys Res Commun. 393:95–100. 2010. View Article : Google Scholar : PubMed/NCBI
|
|
2
|
Ji YB and Gao SY: Arylamine
N-acetyltransferases: A new inhibitor of apoptosis in HepG2
cells. J Zhejiang Univ Sci B. 9:701–706. 2008. View Article : Google Scholar : PubMed/NCBI
|
|
3
|
Sugamori KS, Brenneman D, Sanchez O, Doll
MA, Hein DW, Pierce WM Jr and Grant DM: Reduced
4-aminobiphenyl-induced liver tumorigenicity but not DNA damage in
arylamine N-acetyltransferase null mice. Cancer Lett.
318:206–213. 2012. View Article : Google Scholar : PubMed/NCBI
|
|
4
|
Chen YS, Ho CC, Cheng KC, Tyan YS, Hung
CF, Tan TW and Chung JG: Curcumin inhibited the arylamines
N-acetyltransferase activity, gene expression and DNA adduct
formation in human lung cancer cells (A549). Toxicol In Vitro.
17:323–333. 2003. View Article : Google Scholar : PubMed/NCBI
|
|
5
|
Chen JC, Hwang JM, Chen GW, Tsou MF, Hsia
TC and Chung JG: Curcumin decreases the DNA adduct formation,
arylamines N-acetyltransferase activity and gene expression in
human colon tumor cells (colo 205). In Vivo. 17:301–309.
2003.PubMed/NCBI
|
|
6
|
Chang SH, Chen GW, Yeh CC, Hung CF, Lin SS
and Chung JG: Effects of the butylated hydroxyanisole and butylated
hydroxytoluene on the DNA adduct formation and arylamines
N-acetyltransferase activity in human colon tumor cells. Anticancer
Res. 21:1087–1093. 2001.PubMed/NCBI
|
|
7
|
Chung JG: Paeonol promotion of DNA adduct
formation and arylamines N-acetyltransferase activity in
human colon tumour cells. Food Chem Toxicol. 37:327–334. 1999.
View Article : Google Scholar : PubMed/NCBI
|
|
8
|
Yeh CC, Chung JG, Wu HC, Li YC, Lee YM and
Hung CF: Effects of butylated hydroxyanisole and butylated
hydroxytoluene on DNA adduct formation and arylamines
N-acetyltransferase activity in PC-3 cells (human prostate
tumor) in vitro. Food Chem Toxicol. 38:977–983. 2000. View Article : Google Scholar : PubMed/NCBI
|
|
9
|
Lin SS, Chung JG, Lin JP, Chuang JY, Chang
WC, Wu JY and Tyan YS: Berberine inhibits arylamine
N-acetyltransferase activity and gene expression in mouse
leukemia L 1210 cells. Phytomedicine. 12:351–358. 2005. View Article : Google Scholar : PubMed/NCBI
|
|
10
|
Su CC, Lin JG, Chung JG and Hsieh YC:
Effect of aqueous extract of Nightshade (Solanum nigrum Linn.) on
expression of NAT1 mRNA in human gastric cancer SC-M1 cells. J Chin
Med. 14:59–67. 2003.
|
|
11
|
Su CC, Lin JG, Chung JG and Hsieh YC:
Effect of aqueous extract of Nightshade (Solanum nigrum Linn.) on
activity of NAT enzyme in human gastric cancer SC-M1 cells.
Mid-Taiwan J Med. 8:8–13. 2003.
|
|
12
|
Shen KH, Liao ACH, Hung JH, Lee WJ, Hu KC,
Lin PT, Liao RF and Chen PS: α-Solanine inhibits invasion of human
prostate cancer cell by suppressing epithelial-mesenchymal
transition and MMPs expression. Molecules. 19:11896–11914. 2014.
View Article : Google Scholar : PubMed/NCBI
|
|
13
|
Hasanain M, Bhattacharjee A, Pandey P,
Ashraf R, Singh N, Sharma S, Vishwakarma AL, Datta D, Mitra K and
Sarkar J: α-Solanine induces ROS-mediated autophagy through
activation of endoplasmic reticulum stress and inhibition of
Akt/mTOR pathway. Cell Death Dis. 6:e18602015. View Article : Google Scholar : PubMed/NCBI
|
|
14
|
Gao SY, Wang QJ and Ji YB: Effect of
solanine on the membrane potential of mitochondria in
HepG2 cells and [Ca2+]i in the
cells. World J Gastroenterol. 12:3359–3367. 2006. View Article : Google Scholar : PubMed/NCBI
|
|
15
|
Wu LT, Tsou MF, Ho CC, Chuang JY, Kuo HM
and Chung JG: Berberine inhibits arylamine
N-acetyltransferase activity and gene expression in
Salmonella typhi. Curr Microbiol. 51:255–261. 2005.
View Article : Google Scholar : PubMed/NCBI
|
|
16
|
Stepp MW, Mamaliga G, Doll MA, States JC
and Hein DW: Folate-dependent hydrolysis of acetyl-coenzyme A by
recombinant human and rodent arylamine N-acetyltransferases.
Biochem Biophys Rep. 3:45–50. 2015.PubMed/NCBI
|
|
17
|
Sim E, Fakis G, Laurieri N and Boukouvala
S: Arylamine N-acetyltransferases - from drug metabolism and
pharmacogenetics to identification of novel targets for
pharmacological intervention. Adv Pharmacol. 63:169–205. 2012.
View Article : Google Scholar : PubMed/NCBI
|
|
18
|
Cordes H, Thiel C, Aschmann HE, Baier V,
Blank LM and Kuepfer L: A physiologically based pharmacokinetic
model of isoniazid and its application in individualizing
tuberculosis chemotherapy. Antimicrob Agents Chemother.
60:6134–6145. 2016. View Article : Google Scholar : PubMed/NCBI
|
|
19
|
Brooke EW, Davies SG, Mulvaney AW, Pompeo
F, Sim E and Vickers RJ: An approach to identifying novel
substrates of bacterial arylamine N-acetyltransferases. Bioorg Med
Chem. 11:1227–1234. 2003. View Article : Google Scholar : PubMed/NCBI
|
|
20
|
Sim E, Abuhammad A and Ryan A: Arylamine
N-acetyltransferases: From drug metabolism and pharmacogenetics to
drug discovery. Br J Pharmacol. 171:2705–2725. 2014. View Article : Google Scholar : PubMed/NCBI
|
|
21
|
Abass KM: An investigation into the
formation of tebufenozide's toxic aromatic amine metabolites in
human in vitro hepatic microsomes. Pestic Biochem Physiol.
133:73–78. 2016. View Article : Google Scholar : PubMed/NCBI
|
|
22
|
Lacombe L, Fradet V, Lévesque É, Pouliot
F, Larue H, Bergeron A, Hovington H, Caron A, Nguile-Makao M,
Harvey M, et al: Phase II drug-metabolizing polymorphisms and
smoking predict recurrence of non-muscle-invasive bladder cancer: A
gene-smoking interaction. Cancer Prev Res. 9:189–195. 2016.
View Article : Google Scholar
|
|
23
|
Hsia TC, Yang JH, Lin HJ, Yu CS, Yu FS and
Chung JG: Paclitaxel inhibits N-acetyltransferase activity and gene
expression in human stomach tumor cells (SC-M1). Res Commun Mol
Pathol Pharmacol. 115–116:21–38. 2004.
|
|
24
|
Runge-Morris M and Kocarek TA: Expression
of the sulfotransferase 1C family: Implications for xenobiotic
toxicity. Drug Metab Rev. 45:450–459. 2013. View Article : Google Scholar : PubMed/NCBI
|
|
25
|
Oda Y, Zhang Y, Buchinger S, Reifferscheid
G and Yang M: Roles of human sulfotransferases in genotoxicity of
carcinogens using genetically engineered umu test strains.
Environ Mol Mutagen. 53:152–164. 2012. View Article : Google Scholar : PubMed/NCBI
|
|
26
|
Sabbioni G: Hemoglobin adducts and urinary
metabolites of arylamines and nitroarenes. Chem Res Toxicol.
30:1733–1766. 2017. View Article : Google Scholar : PubMed/NCBI
|
|
27
|
Pan B, Zhong W, Deng Z, Lai C, Chu J, Jiao
G, Liu J and Zhou Q: Inhibition of prostate cancer growth by
solanine requires the suppression of cell cycle proteins and the
activation of ROS/P38 signaling pathway. Cancer Med. 5:3214–3222.
2016. View Article : Google Scholar : PubMed/NCBI
|
|
28
|
Babazadeh S, Moghaddam PA, Sabatyan A and
Sharifian F: Classification of potato tubers based on solanine
toxicant using laser induced light backscattering imaging. Comput
Electron Agric. 129:1–8. 2016. View Article : Google Scholar
|
|
29
|
Shiyong Gao ZX, Ji C and Wang H: Study of
solanine on apoptosis in HepG2 cell. J Harbin Univ Commer (Natural
Sciences Edition). 23:644–650. 2007.
|
|
30
|
Ji YB, Gao SY, Ji CF and Zou X: Induction
of apoptosis in HepG2 cells by solanine and Bcl-2 protein. J
Ethnopharmacol. 115:194–202. 2008. View Article : Google Scholar : PubMed/NCBI
|
|
31
|
Rodrigues-Lima F, Dairou J, Busi F and
Dupret JM: Human arylamine N-acetyltransferase 1: A
drug-metabolizing enzyme and a drug target? Curr Drug Targets.
11:759–766. 2010. View Article : Google Scholar : PubMed/NCBI
|
|
32
|
Butcher NJ and Minchin RF: Arylamine
N-acetyltransferase 1: A novel drug target in cancer
development. Pharmacol Rev. 64:147–165. 2012. View Article : Google Scholar : PubMed/NCBI
|
|
33
|
Ragunathan N, Dairou J, Pluvinage B,
Martins M, Petit E, Janel N, Dupret JM and Rodrigues-Lima F:
Identification of the xenobiotic-metabolizing enzyme arylamine
N-acetyltransferase 1 as a new target of cisplatin in breast
cancer cells: Molecular and cellular mechanisms of inhibition. Mol
Pharmacol. 73:1761–1768. 2008. View Article : Google Scholar : PubMed/NCBI
|
|
34
|
Gao SY and Ji YB: Effect of solanine on
N-acetyltransferase activity in HepG2 cell. Chin Tradit Herbal
Drugs. 39:1688–1691. 2008.
|
|
35
|
Dupret JM and Rodrigues-Lima F: Structure
and regulation of the drug-metabolizing enzymes arylamine
N-acetyltransferases. Curr Med Chem. 12:311–318. 2005. View Article : Google Scholar : PubMed/NCBI
|
|
36
|
Sim E, Lack N, Wang CJ, Long H, Westwood
I, Fullam E and Kawamura A: Arylamine N-acetyltransferases:
Structural and functional implications of polymorphisms.
Toxicology. 254:170–183. 2008. View Article : Google Scholar : PubMed/NCBI
|