Introduction
Immunoglobulin A (IgA) is a component of the balance
between bacterial colonization and containment in the intestines
(1,2). The importance of gut microbial
metabolites in regulating IgA production has been reported
previously (3).
The liver is a frontline organ that receives
gut-derived products through the portal vein; thus, the liver can
be severely affected by disrupted intestinal homeostasis (4). A retrospective analysis reported that
advancing cirrhosis, irrespective of the underlying etiology or
hepatocellular carcinoma, resulted in progressively increasing
serum IgG and IgA levels (5). IgA
secretion and Fc receptor γ signaling aggravate hepatic fibrosis in
mice and patients with non-alcoholic steatohepatitis (NASH)
(6). Additionally, the positive
correlation between serum IgA levels and activated Fc receptor
γ-positive hepatic myeloid cells, as well as the extent of liver
fibrosis, has been reported (6).
Moreover, the association between elevated serum IgA level and
advanced liver disease was demonstrated in steatotic liver diseases
(SLDs), including alcoholic liver disease (ALD) and metabolic
dysfunction-associated SLD (MASLD) (5-8).
As ALD and MASLD have a heavy disease burden on a
global basis, the diagnosis of advanced fibrosis in SLD is commonly
required in primary medicine (9,10).
Additionally, since the twin epidemics of obesity and type 2
diabetes mellitus (T2DM) also increase the incidence of MASLD,
non-invasive tests (NITs) have been used to identify patients with
non-alcoholic fatty liver disease (NAFLD) and those who are at risk
of liver disease progression (11).
Patients at risk for MASLD [those with T2DM, obesity or chronically
elevated alanine aminotransferase (ALT) levels] have been screened
for fibrosis-4 (FIB-4) (11,12).
As a FIB-4 level >1.3 is related to a moderate-to-high risk for
liver fibrosis, these patients should be assessed using second-line
NITs (11,12). Liver stiffness (LS), measured using
a FibroScan® device (Echosens), is the most useful
second-line tool for assessing liver fibrosis in SLD (13). LS >8 kPa indicates an
intermediate or high risk of advanced liver fibrosis (F2-F4 by
biopsy) (11-13).
Macrophage galactose-specific lectin-2 binding protein
glycosylation isomer (M2BPGi) is also associated with advanced
liver fibrosis in MASLD (14).
The association between IgA and metabolic syndrome
is mediated via gut microbiota (15). Serum IgA may bind to these gut
microbial antigens, restrict their toxicity and control gut
microbial antigens in the circulation, thereby reducing systemic
inflammation (15). Decreased IgG
and IgM levels, and increased IgA levels are independently
associated with T2DM prevalence in the adult population (16). Poor glycemic management may be
associated with elevated serum IgA levels and IgG antibodies in
patients with T2DM (17).
Furthermore, the onset of T2DM is predicted by visceral fat mass
and the ratio of visceral to subcutaneous fat mass evaluated using
computed tomography (CT) (18).
Visceral fat mass is an important prognostic marker of liver
disease and sarcopenia (19).
The present study investigated the significance of
serum IgA levels in patients with liver disease who were initially
diagnosed in the Department of Gastroenterology in Nagasaki Harbor
Medical Center (Nagasaki, Japan). As the association between NITs
(LS, FIB-4 and M2BPGi) and IgA levels has not been reported, a
focus was placed on such NITs Additionally, the associations
between body composition and IgA levels were evaluated in patients
who underwent CT.
Materials and methods
Patients
In total, 478 patients first diagnosed with liver
disease in Nagasaki Harbor Medical Center between May 2017 and
October 2023 were initially included in the present study (Table I; Fig.
S1A). The median patient age was 68 years (range, 27-84 years).
A total of 249 patients were female and 229 were male. Of them,
clinically, 18 patients presented with autoimmune hepatitis, 64
patients presented with ALD and 54 patients presented with the
treatment-naïve hepatitis B virus (HBV). Furthermore, 114 patients
had a treatment-naïve hepatitis C virus (HCV) infection, 1 had a
treatment-naïve HBV and HCV infection, 129 had MASLD and 24 had
treatment-naïve primary biliary cholangitis. Another 2 patients had
treatment-naïve primary sclerosing cholangitis. The diagnosis of
fatty liver was obtained by ultrasound echography. ALD was
diagnosed using the new nomenclature (20). Metabolic and alcohol
related/associated liver disease Met-ALD (20) was included in the definition of
MASLD in this study, whereas SLD included both ALD and MASLD. A
further 72 patients had other treatment-naïve liver diseases (e.g.,
unknown cause or drug-induced liver damage). T2DM was defined as
follows: Fasting serum glucose ≥100 mg/dl, 2-h post-load glucose
levels ≥140 mg/dl, HbA1c ≥5.7%, diagnosed as T2DM at the first
visit or receiving treatment for T2DM (20).
 | Table IClinical characteristics (n=478). |
Table I
Clinical characteristics (n=478).
| Characteristic | Value | 95% CI | % |
|---|
| Age,
yearsa | 68 | 27.4-87 | |
| Sex, n | | | |
|
Female | 249 | | 52.09 |
|
Male | 229 | | 47.91 |
| Disease, n | | | |
|
AIH | 18 | | 3.77 |
|
Alcohol | 64 | | 13.39 |
|
HBV | 54 | | 11.3 |
|
HBV +
HCV | 1 | | 0.21 |
|
HCV | 114 | | 23.85 |
|
MASLD | 129 | | 26.99 |
|
PBC | 24 | | 5.02 |
|
PSC | 2 | | 0.42 |
|
Other | 72 | | 15.06 |
| Malignant disease,
n | | | |
|
Breast
cancer | 15 | | 3.14 |
|
Bladder
cancer | 1 | | 0.21 |
|
Biliary
cancer | 5 | | 1.05 |
|
Colorectal
cancer | 5 | | 0.84 |
|
Cholangioma | 4 | | 0.84 |
|
Hepatoma | 35 | | 7.32 |
|
Lung
cancer | 2 | | 0.42 |
|
Gastric
cancer | 4 | | 0.84 |
|
Malignant
lymphoma | 3 | | 0.63 |
|
Gynecological
cancer | 2 | | 0.41 |
|
Pancreatic
cancer | 8 | | 1.67 |
|
None | 392 | | 82.01 |
| Diabetes, n | | | |
|
Positive | 106 | | 22.18 |
|
Negative | 372 | | 77.82 |
| Total bilirubin,
mg/dla | 0.8 | 0.3-2.86 | |
| Albumin,
g/dla | 4.1 | 3.8-4.8 | |
| ALBIa | -2.784 |
-3.329-(-1.4589) | |
| ALBI grade, n | | | |
|
1 | 314 | | 65.69 |
|
2 | 154 | | 32.22 |
|
3 | 10 | | 2.09 |
| PT INRa | 1.01 | 0.8-1.391 | |
| CPSa | 5 | 5-8 | |
| CP grade A/B/C,
n | | | |
|
A | 442 | | 92.47 |
|
B | 31 | | 6.49 |
|
C | 5 | | 1.05 |
| MELDa | 7 | 5-8 | |
| Cr,
mg/dla | 0.76 | 0.48-2.23 | |
| Cr-eGFR,
ml/min/1.73 m2a | 68.6 | 20.74-110.9 | |
| CysC,
mg/la | 1.05 | 0.6645-3.062 | |
| CysC-eGFR,
ml/min/1.73 m2a | 65.75 | 14.25-117.93 | |
| Height,
ma | 1.6 | 1.4-1.77 | |
| Body weight,
kga | 59.35 | 37-94.4 | |
| BMI,
kg/m2a | 23.37 | 16.07-34.19 | |
| BMI, n | | | |
|
Normal | 302 | | 63.18 |
|
Obesity | 176 | | 36.82 |
| Platelets,
x104/µla | 19.3 | 6.19-34.06 | |
| AST,
U/la | 38.5 | 15.5-290.5 | |
| ALT,
U/la | 40 | 8.45-367.9 | |
| FIB-4a | 2.3128 | 0.6092-11.4661 | |
| M2BPGi (cut-off
index COI) a | 1.2 | 0.3-2.3 | |
| AFP,
ng/mla | 4.6 | 1.6-122.9 | |
| PIVKA-II,
mAU/mla | 23 | 12-7484 | |
| IgG,
mg/dla | 1438 | 798.3-1753 | |
| IgG, n | | | |
|
>1,700
mg/dl | 134 | | 28.03 |
|
≤1,700
mg/dl | 344 | | 71.97 |
| IgM,
mg/dla | 89 | 29-137 | |
| IgM by sex, n | | | |
|
>190 for
males/>260 for females, mg/dl | 36 | 7.53 | |
|
≤190 for
males/≤260 for females, mg/dl | 442 | 92.47 | |
| IgA,
mg/dla | 282 | 83.5-376 | |
| IgA, n | | | |
|
>410
mg/dl | 90 | 18.83 | |
|
≤410
mg/dl | 388 | 81.17 | |
Of the 478 patients, 353 patients with liver disease
were evaluated with the FibroScan device. The clinical
characteristics of these patients are presented in Table SI. LS (kPa) was evaluated using
vibration-controlled transient elastography, and liver fat content
(dB/m) was evaluated using the controlled attenuation parameter
(CAP), both functions of FibroScan. Of the 478 patients, 270
patients with liver disease were evaluated using CT for hepatoma
screening. The clinical characteristics of these patients are
presented in Table SII.
Cross-sectional CT images of the third lumbar vertebrae (L3) were
analyzed using Slice-O-Matic software (version 5.0; TomoVision) to
determine the skeletal muscle (SM) mass, including the psoas,
erector spinae, quadratus lumborum, transversus abdominis, external
and internal obliques, and rectus abdominis muscles. Tissue
Hounsfield unit (HU) thresholds were employed as follows: 29 to 150
HU for SM, 190 to 30 for subcutaneous adipose tissue and 150 to 50
for visceral adipose tissue (VAT) (21). The visceral-to-subcutaneous fat
ratio (VSR) is an index of VAT divided by SAT.
The medical records of 478 patients were
retrospectively reviewed, and all laboratory measurements were
obtained from these records. Informed consent was obtained from
each patient included in the study, and they were guaranteed the
right to leave the study if desired. The study protocol conformed
to the guidelines of the 1975 Declaration of Helsinki (22) and was approved by the Human Research
Ethics Committee of Nagasaki Harbor Medical Center (approval no.
H30-031).
Laboratory measurements
Laboratory data and anthropometric measurements were
obtained from each participant during outpatient visits. The body
mass index (BMI) of each patient was calculated by dividing their
weight (kg) by the square of their height (m). The normal BMI range
is 20-25 kg/m2. Grip strength was measured using a
dynamometer (Smedley Dynamo Meter; Tsutsumi Co., Ltd.) with the
participants standing in an erect position with both arms at their
sides. The normal laboratory ranges used were as follows: Total
bilirubin, 0.3-1.2 mg/dl; albumin, 3.8-5.2 g/dl; prothrombin time
international normalized ratio, 0.85-1.15; creatinine (Cr) for male
patients (M), 0.61-1.04 mg/dl, and for female patients (F),
0.47-0.79 mg/dl; Cr-estimated glomerular filtration rate (eGFR),
<90 ml/min/1.73 m2; cystatin C (CysC) for M,
0.63-0.95 mg/l, and for F, 0.56-0.87 mg/l; CysC-eGFR, <90
ml/min/1.73 m2; platelets for M,
13.1-26.2x10⁴/µl, and for F,
13.0-36.9x10⁴/µl; aspartate aminotransferase (AST),
10-40 U/l; ALT, 5-40 U/l; M2BPGi, less than the cut-off index
(C.O.I.) value of 1; α-fetoprotein (AFP), <10 ng/ml; protein
induced by vitamin K absence or antagonist-II, <40 mAU/ml; IgG,
<1,700 mg/dl; IgM for M, <190 mg/dl and for F, <260 mg/dl;
and IgA <410 mg/dl (Fig. S1B).
The Child-Pugh score (CPS) (23),
model of end-stage liver disease (24), albumin-bilirubin score (ALBI)
(25), FIB-4(26) and Fibroscan-AST score (FAST)
(27) were calculated as previously
reported. A normal FIB-4 score is <1.3 (11,12).
Statistical analysis
Data were analyzed using StatFlex (version 6.0;
Artech LLC) and are presented as the median and 95% confidence
interval (CI). Laboratory variables were compared using
Mann-Whitney U tests (for differences between two groups) and
Kruskal-Wallis tests (for differences between three groups).
Multiple comparisons among independent groups were conducted using
Dunn's post hoc test. A multiple regression analysis was performed,
and a standardized partial regression coefficient, β, was employed.
Univariate and multivariate analyses were performed using logistic
regression. Correlations were evaluated using the Pearson's
correlation coefficient (R). The detection level was analyzed using
receiver operating characteristic (ROC) curves. P<0.05 was used
to indicate a statistically significant difference.
Results
First, the associations between IgA levels and
clinical factors were evaluated (Table
II). If the clinical factors were continuous data, the
correlation between the serum IgA titer and clinical factors was
evaluated. If the clinical factors were grouped, a Mann-Whitney U
analysis was performed. The results of the analysis showed that
sex, ALD, SLD, CPG, ALBI, FIB-4, M2BPGi, BMI, T2DM, AFP, total
protein, albumin and IgG levels were significantly associated with
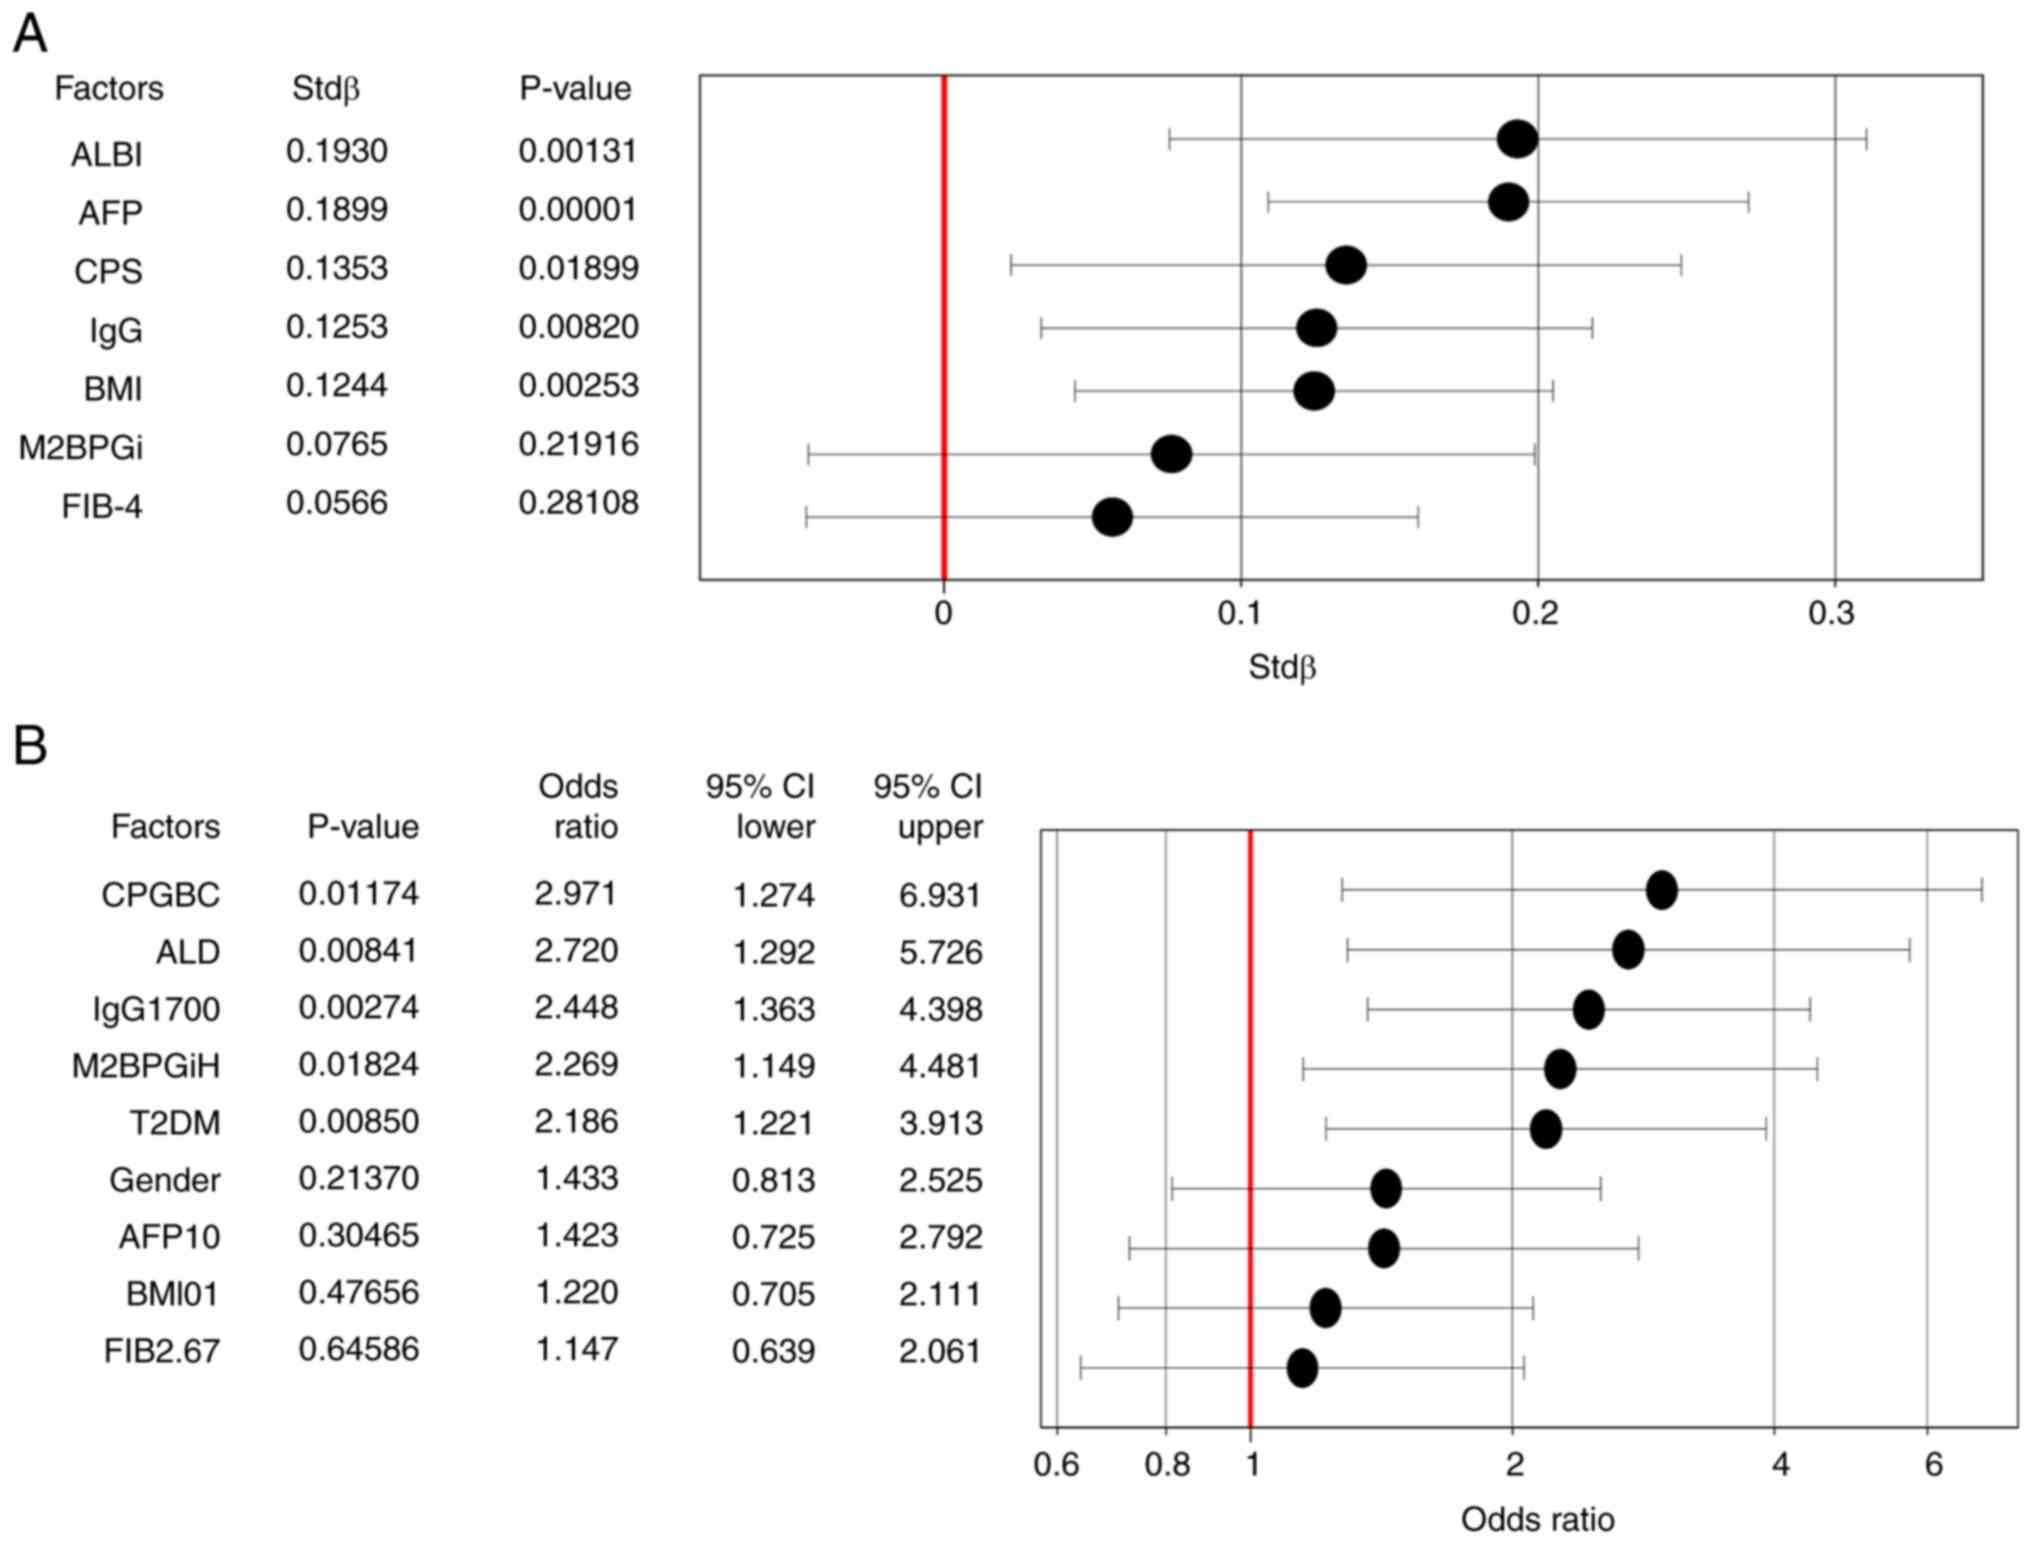
IgA levels (Table II). Of these
factors, continuous data were then evaluated by multiple regression
analysis for serum IgA levels (Fig.
1A), demonstrating that ALBI, AFP, CPS, IgG and BMI were
significantly associated with serum IgA levels. The R values
(P-values) in relation to IgA and LS were 0.4609 (<0.00001) and
0.5997 (<0.00001) in MASLD and ALD, respectively. Factors
contributing to high serum IgA levels (high IgA; >410 mg/dl)
were analyzed using logistic regression analysis. After including
CPGBC, ALD, IgG 1,700 mg/dl (higher than normal range), M2BPGiH
(higher than normal range), T2DM, sex, AFP 10 ng/ml (higher than
normal range), BMI (>25 kg/m2) and FIB 2.67
[>2.67(28)] in the analysis, it
was found that CPGBC, ALD, high IgG, high M2BPGiH and T2DM were
contributing factors for high IgA levels (Fig. 1B). In the multivariate logistic
model, SLD did not contribute to high IgA levels when ALD (Fig. 1B) was changed to SLD (odds ratio,
1.708; 95% CI, 0.962-3.031). The characteristics of patients with
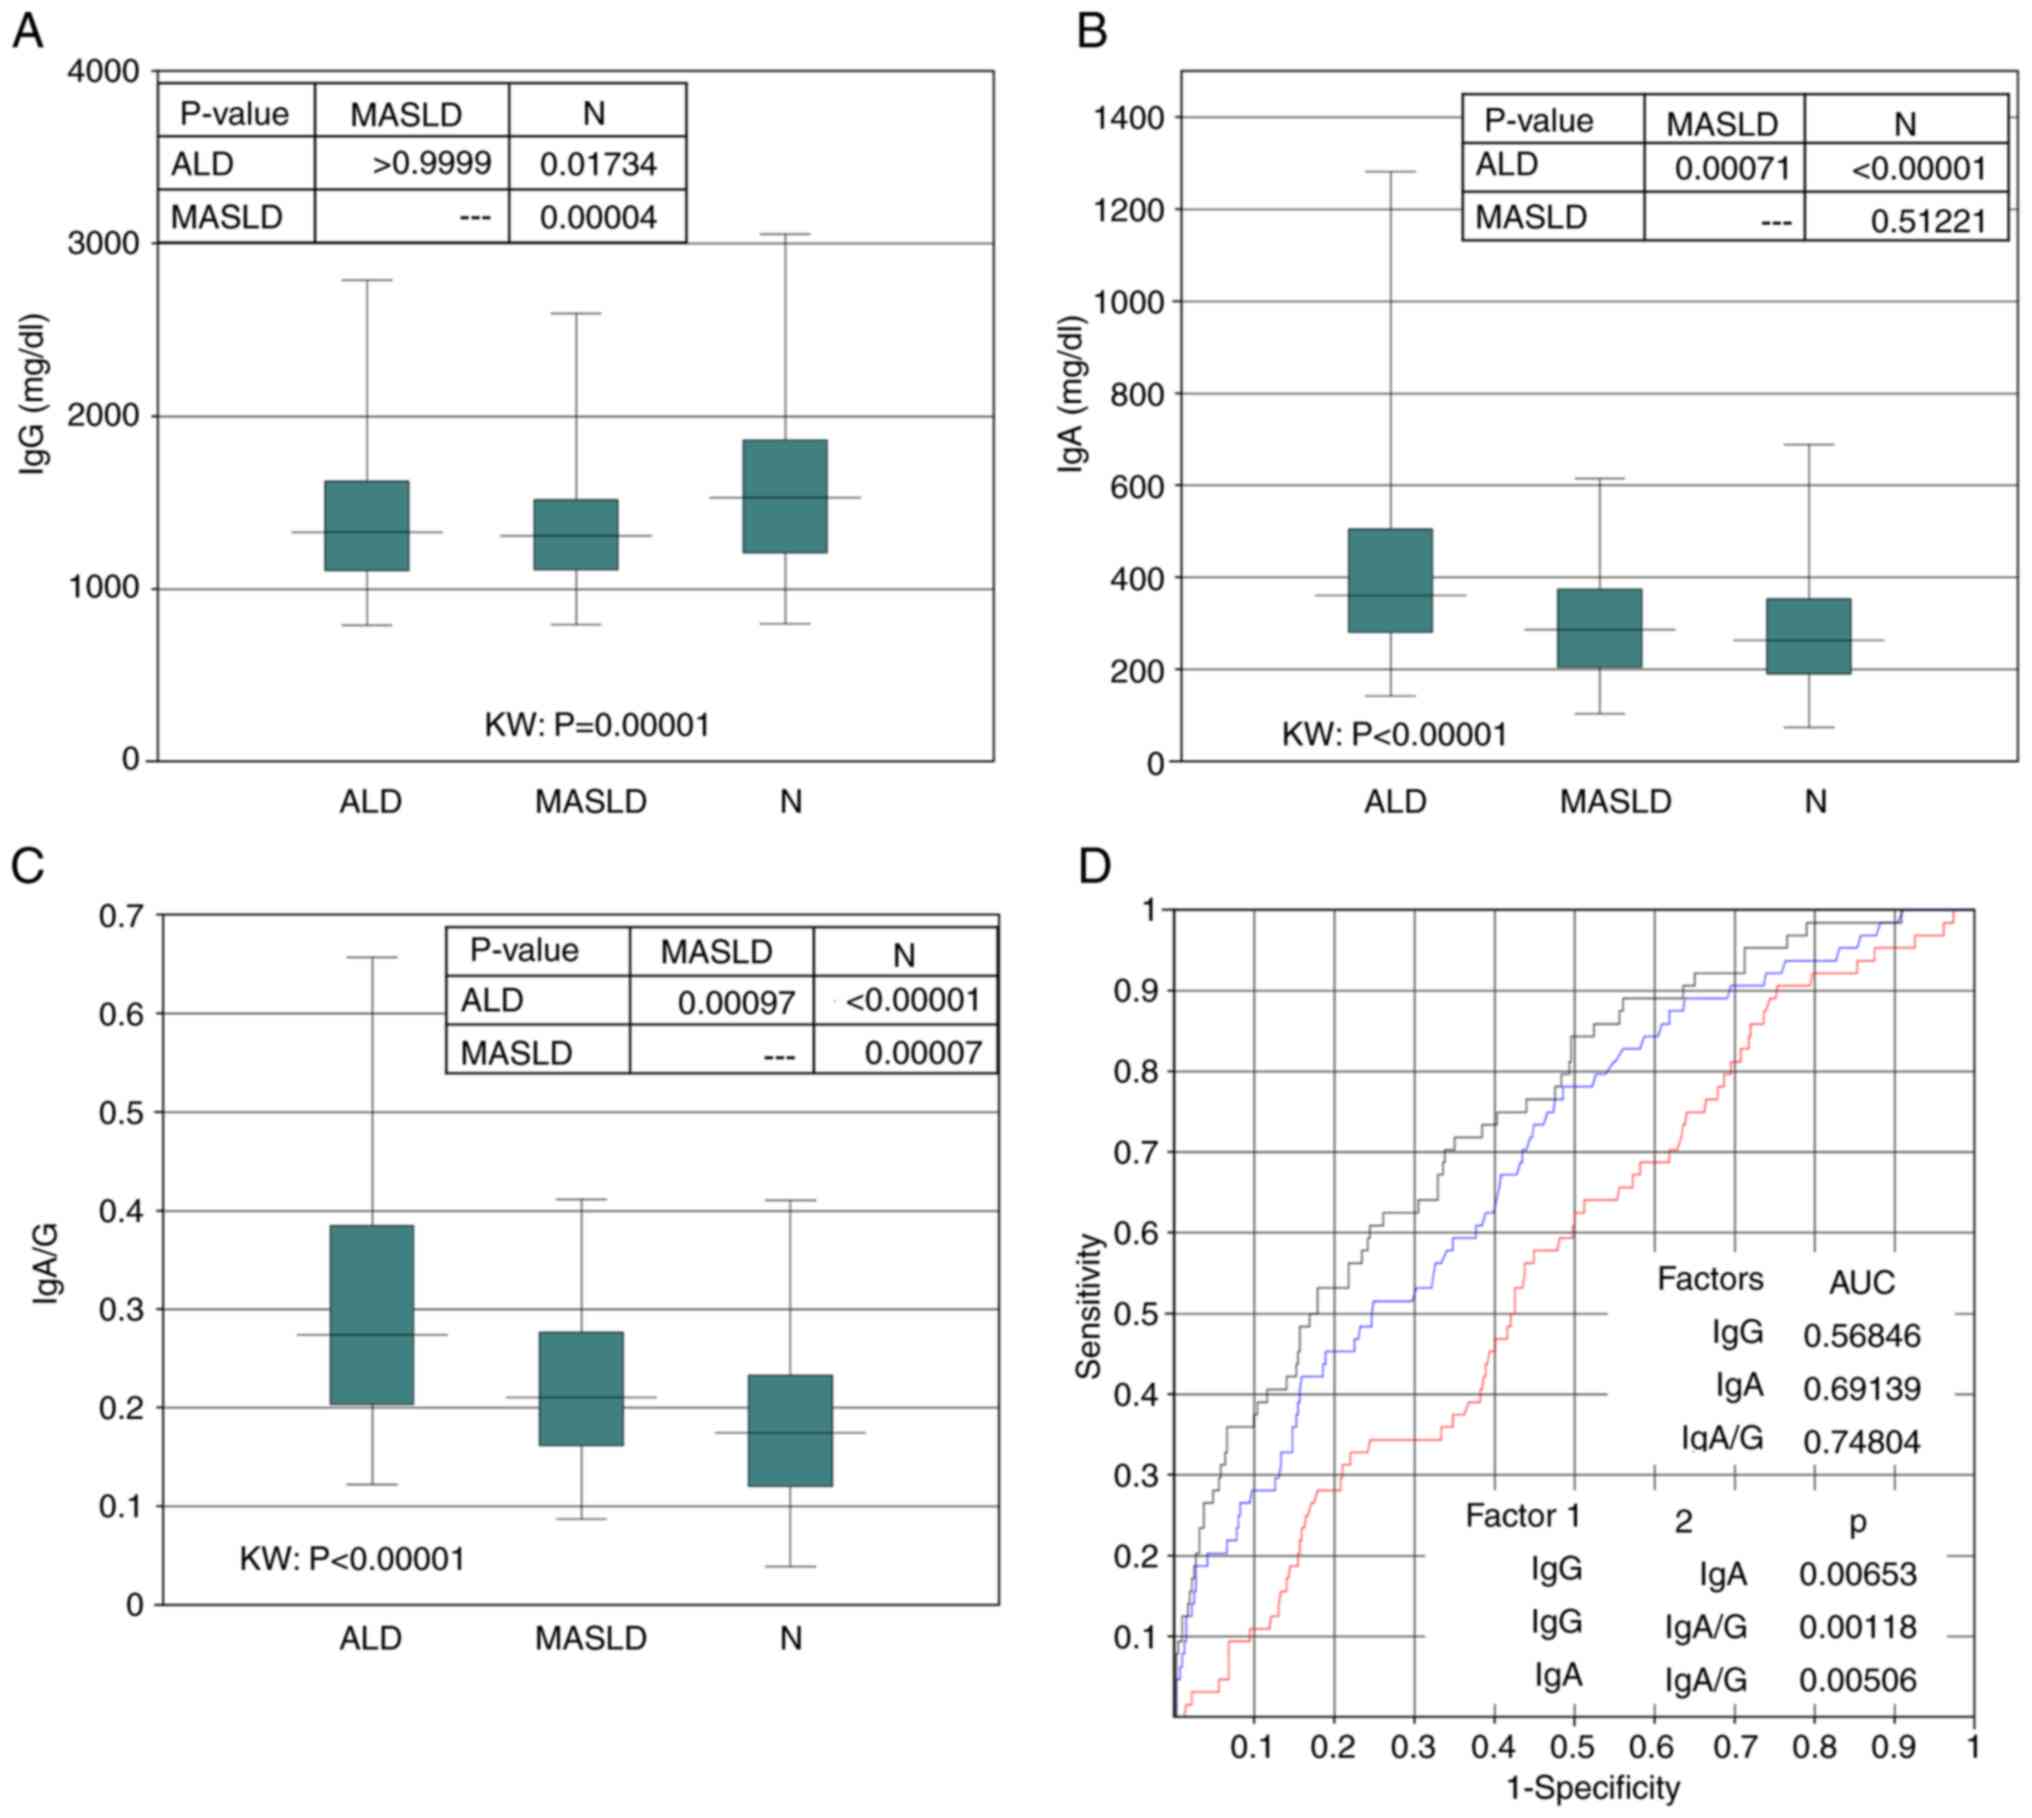
ALD were compared with those of patients with MASLD and non-SLD. In
patients with ALD, serum IgG levels were lower compared with those
in patients with non-SLD, but not compared with those in patients
with MASLD (Fig. 2A). Serum IgA
levels in patients with ALD were higher than those in patients with
MASLD and non-SLD (Fig. 2B). The
IgA/G ratio (serum IgA divided by IgG) was higher in the patients
with ALD than that in the patients with MASLD and non-SLD (Fig. 2C). An attempt was made to determine
the difference between ALD and non-ALD using serum IgG and IgA
levels and IgA/G ratio by ROC analysis (Fig. 2D). The cutoff value was set at the
point where sensitivity and specificity are equal. The cut-off
point for IgG was 1,358.1 mg/dl (sensitivity, 0.5625), that for IgA
was 305.7 mg/dl (sensitivity, 0.614) and the IgA/G ratio was 0.2
(sensitivity, 0.6715). The IgA/G ratio was therefore more valuable
than IgG and IgA levels in distinguishing patients with ALD from
those with non-ALD.
| Table IIAssociation between IgA levels and
clinical factors. |
Table II
Association between IgA levels and
clinical factors.
| Factor | Median | R value | P-value |
|---|
| Sex, (n=478) | | | <0.00001 |
|
Female | 256 | | |
|
Male | 310 | | |
| Age, years
(n=478) | | 0.0658 | 0.15080 |
| ALD, (n=64) | | | <0.00001 |
|
Positive | 360.5 | | |
|
Negative | 270 | | |
| MASLD, (n=129) | | | 0.87964 |
|
Positive | 287 | | |
|
Negative | 280 | | |
| SLD, (n=193) | | | 0.00037 |
|
Positive | 304 | | |
|
Negative | 263 | | |
| HCC, (n=35) | | | 0.37400 |
|
Positive | 406.8 | | |
|
Negative | 307.3 | | |
| CPG, (n=478) | | | <0.00001 |
|
A | 274.5 | | |
|
BC | 431 | | |
| ALBI (n=478) | | 0.4111 | <0.00001 |
| FIB-4 (n=478) | | 0.2638 | <0.00001 |
| M2BPGi (COI)
(n=478) | | 0.3676 | <0.00001 |
| BMI,
kg/cm2 (n=478) | | 0.1089 | 0.01720 |
| DM, (n=106) | | | 0.00052 |
|
Positive | 330 | | |
|
Negative | 273 | | |
| AFP, ng/ml
(n=478) | | 0.2349 | <0.00001 |
| PIVKA-II, mAU/ml
(n=478) | | 0.0245 | 0.59327 |
| Total protein, g/dl
(n=478) | | 0.19 | 0.00003 |
| Albumin, g/dl
(n=478) | | 0.395 | <0.00001 |
| IgG, mg/dl
(n=478) | | 0.2778 | <0.00001 |
| IgM, mg/dl
(n=478) | | 0.0582 | 0.20407 |
Next, the associations between IgA levels and LS
were evaluated (Table SI; Fig. 3). LS was compared with NITs (M2BPGi
and FIB-4), IgG and IgA levels, and IgA/G ratio. Multivariate
regression analysis revealed that, in the entire cohort (478
cases), IgA levels, IgA/G ratio, M2BPGi and FIB-4 were associated
with LS levels (Fig. 3A). In the
SLD group (169 cases), IgA levels and the IgA/G ratio were
associated with LS levels (Fig.
3B); however, in the non-SLD group (309 cases), only M2BPGi was
significantly associated with LS levels (Fig. 3C). In the SLD group, IgA levels,
M2BPGi and FIB-4 were compared for their association with high LS
(>8 kPa) using ROC analysis. IgA levels (AUC, 0.79362), M2BPGi
(AUC, 0.84439) and FIB-4 (AUC, 0.78391) were equally useful for
diagnosing high LS (Fig. 3D). The
associations between IgA levels and CAP were evaluated, but no
significant association was found (Table SIII). CAP values were positively
correlated with BMI and negatively correlated with age and ALBI
(Table SIII). IgA showed a
correlation with FAST in both males (Fig. S2A) and females (Fig. S2B). However, there was no
correlation between IgA and CAP in males (Fig. S2A and C), while a weak correlation with CAP was
observed in females (Fig. S2B and
D)
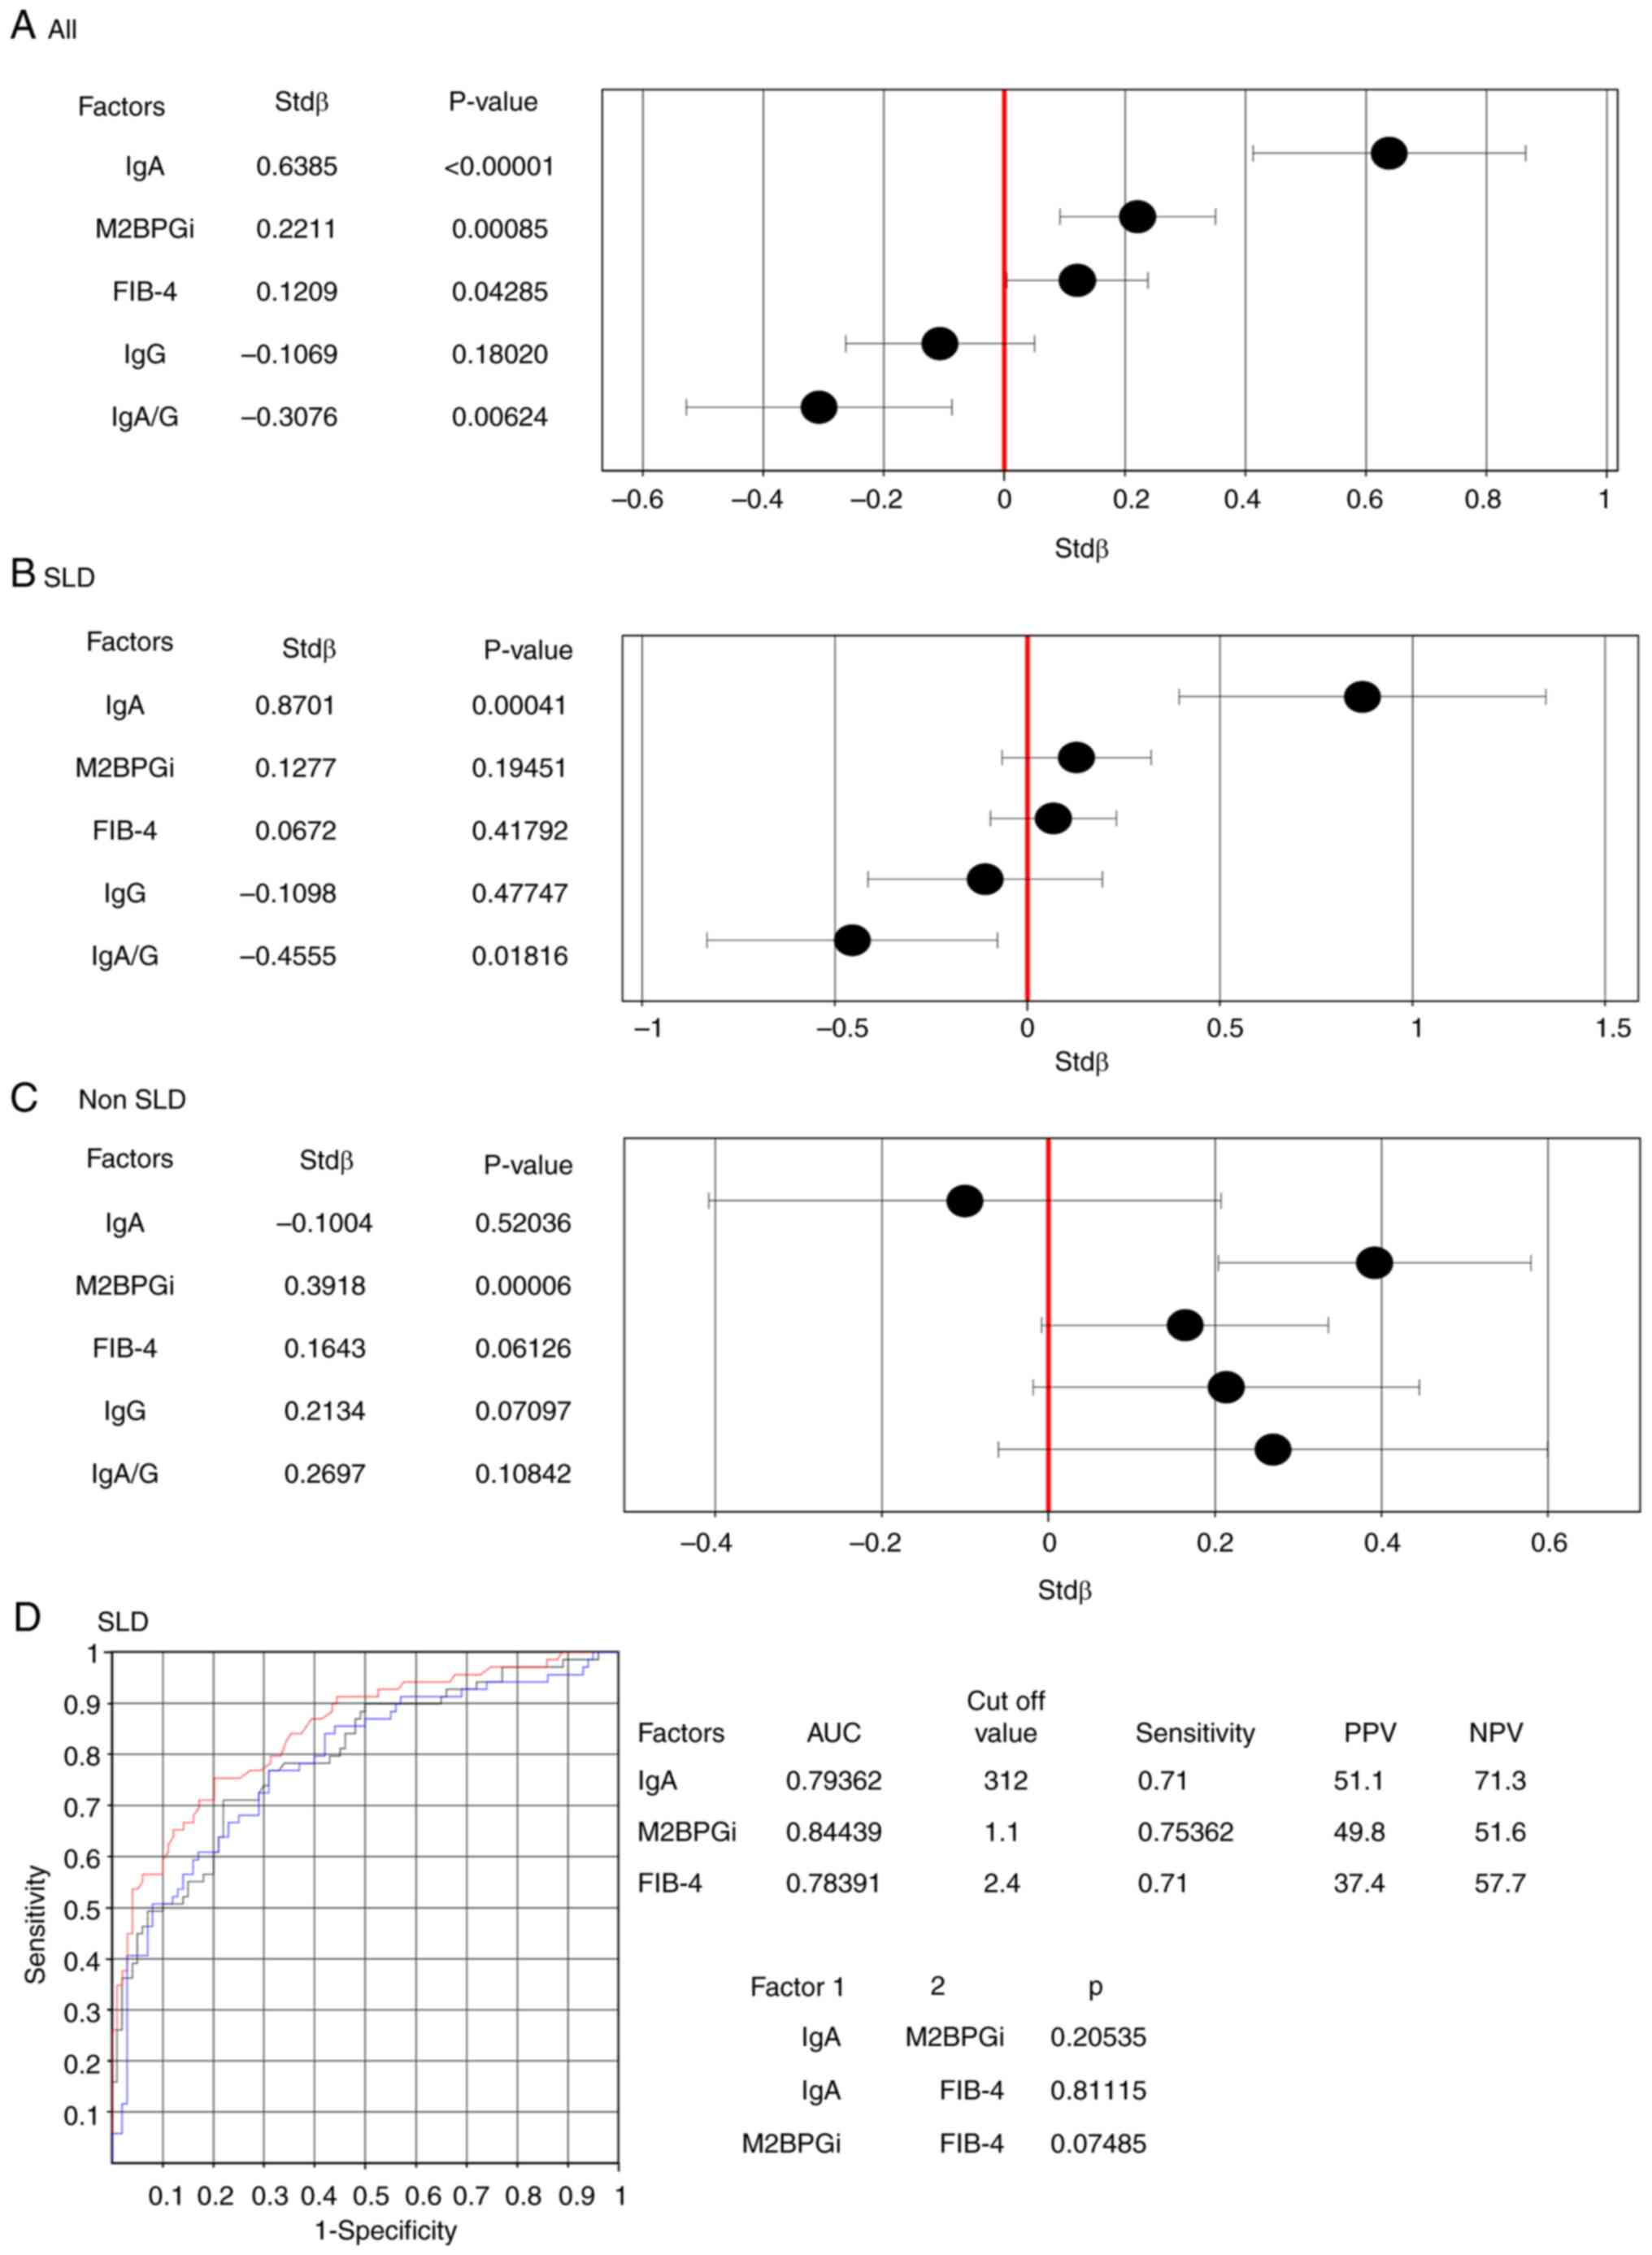 | Figure 3Association between LS and clinical
factors. (A-C) Multiple regression analysis for LS: (A) All
patients, (B) SLD and (C) non-SLD. The stdβ and 95% CI values are
indicated on the x-axis. The explanatory variables lies on the
y-axis. (D) Receiver operating characteristic analysis for high LS
(>8 kPa) in SLD. The AUC is indicated. The P-value is the
difference in AUC between groups 1 and 2. The black line represents
IgA, the blue line represents FIB-4 and the red line represents
M2BPGi. The cut-off value is the point with equal sensitivity and
1-specificity. PPV, positive prediction value; NPV, negative
prediction value; AUC, area under the curve; Ig, immunoglobulin;
LS, liver stiffness; SLD, steatotic liver disease; CI, confidence
interval; FIB-4, fibrosis-4; M2BPGi, macrophage galactose-specific
lectin-2 binding protein glycosylation isomer. |
Next, the associations between IgA levels and body
composition were evaluated (Tables
III and SII). IgA levels were
associated with SM, VAT, VSR and BMI (Table III). In particular, a weak
correlation was observed between VAT and IgA, and between VSR and
IgA in females (Fig. S3). No
association was found between IgA and SM or IgA and BMI in women
(Fig. S3). Since body composition
is influenced by sex differences (19), the cut-off value for detecting high
IgA levels was evaluated using ROC analysis. In males, the cut-off
value (sensitivity) for high IgA level was 23.3 (0.525) for BMI,
121.3 (0.536) for SM and 1.2 (0.552) for VSR. No significant
difference was observed in the area under the curve (AUC) among the
three groups (Table IV; Fig. S4A). In females, the cut-off value
(sensitivity) for high IgA level was 23.25 (0.571) for BMI, 85.18
(0.504) for SM and 0.7 (0.741) for VSR. Similarly, no significant
difference was observed in the AUC among the three groups (Table IV; Fig. S4B). In the multivariate logistic
analysis, high VSR contributed to high IgA levels in females but
not in males (Table V).
| Table IIIAssociation among body composition,
muscle markers and IgA levels. |
Table III
Association among body composition,
muscle markers and IgA levels.
| | IgA |
|---|
| Factor | R-value | P-value |
|---|
| SM,
cm2 | 0.162 | 0.00748 |
| IMAT,
cm2 | 0.028 | 0.65182 |
| VAT,
cm2 | 0.190 | 0.00178 |
| SAT,
cm2 | 0.026 | 0.67311 |
| VSR | 0.258 | 0.00002 |
| MA, HU | 0.021 | 0.73220 |
| SMI,
cm2/m2 | 0.112 | 0.06579 |
| Grip strength,
kg | 0.045 | 0.46230 |
| BMI,
kg/m2 | 0.130 | 0.03278 |
| Table IVCut-off value for BMI, SM and VSR for
high serum immunoglobulin A level as per the receiver operating
characteristic analysis. |
Table IV
Cut-off value for BMI, SM and VSR for
high serum immunoglobulin A level as per the receiver operating
characteristic analysis.
| | Male | Female |
|---|
| Factors | Object | Control | AUC | Cut-off value | Sensitivity | Object | Control | AUC | Cut-off value | Sensitivity |
|---|
| BMI | 40 | 97 | 0.52178 | 23.33 | 0.525 | 14 | 119 | 0.60864 | 23.25 | 0.571 |
| SM | 40 | 97 | 0.54240 | 121.3 | 0.536 | 14 | 119 | 0.57413 | 85.18 | 0.5 |
| VSR | 39 | 96 | 0.57051 | 1.2 | 0.552 | 12 | 116 | 0.78161 | 0.7 | 0.741 |
| Table VAssociation between body composition
and high immunoglobulin A level analyzed using multivariate
logistic analysis. |
Table V
Association between body composition
and high immunoglobulin A level analyzed using multivariate
logistic analysis.
| | Multivariate
logistic analysis | Adjusted
multivariate logistic analysisa |
|---|
| Factor | P-value | Odds ratio | 95% CI | P-value | Odds ratio | 95% CI |
|---|
| Females
(n=128) |
|
VSRH | 0.00263 | 9.451 | 2.187-40.847 | 0.00887 | 11.581 | 1.850-72.500 |
|
SMH | 0.28494 | 2.246 | 0.510-9.895 | 0.21309 | 3.501 | 0.487-25.174 |
|
BMIH | 0.59621 | 0.665 | 0.147-3.008 | 0.78905 | 0.770 | 5.245 |
| Males (n=135) |
|
VSRH | 0.27928 | 1.557 | 0.698-3.473 | 0.26382 | 1.632 | 0.691-3.852 |
|
SMH | 0.15928 | 0.532 | 1.281 | 0.27658 | 0.602 | 1.501 |
|
BMIH | 0.57518 | 1.300 | 0.520-3.251 | 0.66776 | 1.230 | 3.168 |
Discussion
The present study showed that in chronic liver
disease (CLD), CPGBC, ALD, high IgG (>1,700 mg/dl), high M2BPGi
(>1) and T2DM are associated with high IgA levels. The IgA/G
ratio was the highest in patients with ALD, followed by those with
MASLD and non-SLD. High LS was associated with high IgA levels, and
IgA level was more strongly associated with LS than with M2BPGi and
FIB-4. IgA level was associated with VSR and was particularly
pronounced in females.
Previous reports have shown that ALD is associated
with high serum IgA levels (5,6,29).
High IgA levels are related to severe liver disease, including ALD,
and high IgG levels are also associated with decompensated
cirrhosis (5). IgA levels are
elevated in ALD, and an increased IgA/IgG ratio is highly
suggestive of ALD (29). IgA/G
ratio >0.2 (sensitivity, 0.6715) was more valuable than IgG and
IgA levels in distinguishing patients with ALD from those with
non-ALD. We consider that IgA level, in combination with IgG level,
can be used as a biomarker for ALD. By contrast, SLD, including ALD
and MASLD, did not contribute to high IgA levels in the present
study. Unlike pathogenic bacteria, commensal bacteria do not induce
a systemic IgG response but only a mucosal IgA response, which is
different from the response to non-invasive strains of
Salmonella, which are treated differently compared with
pathogenic strains, even if the commensal bacteria are non-invasive
(30). Since IgA levels in patients
with ALD were higher than those in patients with MASLD in the
present study, we hypothesized that alcohol consumption and
metabolic abnormalities may have different effects on the gut
microbiota, which may be reflected in the differences in IgA and
IgG levels.
Furthermore, elevated IgA levels reflect the
severity of liver disease, regardless of the cause of the liver
disease (5). In the present study,
as CPGBC contributed to high IgA levels, there was no contradiction
to this result. Notably, M2BPGi, a marker of liver fibrosis, also
contributed to high IgA levels. When examining the associations
between LS, typical second-line NIT and IgA level, an association
between high IgA level and high LS as a high-risk factor for
advanced fibrosis (11-13)
was observed in SLD. In SLD, IgA level was equivalent to M2BPGi and
FIB-4 as a marker for discriminating advanced fibrosis. In a
previous study using a mouse NASH model and patients with NASH, the
levels of serum IgA secreted by the plasma cells of secondary
lymphoid organs was shown to be elevated in patients with NAFLD and
was an independent predictor of advanced fibrosis (6). In the present study, high IgA levels
were associated with liver fibrosis in patients with SLD, including
ALD. There are a variety of common mechanisms that cause the
elevated IgA underlying both diseases, including alcoholic liver
disease and NAFLD (31). A previous
review (31) explored the similar
downstream signaling events involved in the onset and progression
of the two entities, which are not completely different,
predominantly focusing on the gut microbiome. We hypothesize that
among the downstream events, lipopolysaccharide and bacterial
migration are associated with increased blood IgA. Therefore, we
hypohesize that IgA level (>312 mg/dl) is a useful marker of
advanced liver fibrosis in SLD.
T2DM also contributed to high IgA levels in the
present study; however, BMI was not associated with IgA levels.
Therefore, the association between IgA levels and body composition
was evaluated. Poor glycemic control is reportedly associated with
high IgA levels (17). Elevated VSR
(≥1 in males and ≥0.5 in females) is an independent risk factor for
T2DM development (18). Notably,
VSR (>1.33 in males and >0.93 in females) independently
predicted the outcomes (mortality) of hepatocellular carcinoma
(21). In the present study, high
VSR (≥0.7 in females) contributed to high IgA, but not in males.
Sex differences in VSR were detected in previous studies (18,19),
and other reports have described that high VSR, but not sex
differences, predicts advanced fibrosis in NAFLD (32,33).
In a previous study, VSR evaluated using CT was independently
associated with VAT inflammation, and VSR was significantly
associated with histological VAT inflammation in cirrhotic males
but not in females (34). In
females, the association between high IgA and high VSR was close;
however, such an association in males should be further evaluated
in the future. In the present study, SM was not associated with
high IgA. However, a limitation in the field of clinical
investigation of sarcopenic patients is the lack of a generally
accepted definition coupled with the difficulty of adopting common
diagnostic criteria (35). The
association between sarcopenia and IgA in liver disease is a future
challenge.
The present study had several limitations.
Differentiation between ALD and MASLD was performed using medical
records, and met-ALD was included in MASLD. Therefore, the
association between alcohol consumption and serum IgA levels should
be examined in the future. Additionally, treatment for diabetes was
not considered. Thus, although T2DM contributed to high IgA levels,
the glycemic control levels could not be evaluated. Finally, this
was a single-hospital, small, retrospective study, and body
composition factors associated with IgA were unknown in males.
These issues should to be further examined in the future.
In conclusion, the present study demonstrated the
usefulness of serum IgA measurements in CLD. IgA levels, in
combination with IgG levels, are useful for the differential
diagnosis of ALD. In SLD, IgA level is comparable to known NITs
(FIB-4 and M2BPGi) in its ability to discriminate patients with
advanced LS. T2DM is associated with high IgA levels regardless of
sex, and visceral obesity (high VSR) is associated with high IgA
levels in females. In the current era of increasing SLD, the
evaluation of serum IgA level as a new NIT is important for the
assessment of liver disease.
Supplementary Material
Study design and IgA distribution. (A)
Study design. (B) Frequency distribution chart of IgA. Ig,
immunoglobulin; CT, computed tomography.
Correlations between CAP, FAST and
IgA. The correlation between IgA and FAST in (A) males and (B)
females. The correlation between IgA and CAP in (C) males and (D)
females. R represents the correlation coefficient, and stdβ denotes
the standard partial regression coefficient. CAP, controlled
attenuation parameter; FAST, Fibroscan-aspartate aminotransferase
score; Ig, immunoglobulin.
Correlations between IgA level and
body composition as distinguished by sex. Correlation between IgA
and SM in (A) males and (B) females, between IgA and VAT in (C)
males and (D) females, between IgA and VSR in (E) males and (F)
females, and between IgA and BMI in (G) males and (H) females.r
denotes the correlation coefficient. Ig, immunoglobulin; SM,
skeletal muscle; VAT, visceral adipose tissue; VSR,
visceral-to-subcutaneous fat ratio; BMI, body mass index.
Cut-off value for high IgA, BMI, SM
and VSR were analyzed using ROC curves. The cut-off value had equal
sensitivity and 1-specificity. The number of cases in the high IgA
and control groups is shown numerically. ROC curves for (A) Males
and (B) Females. Ig, immunoglobulin; BMI, body mass index; SM,
skeletal muscle; VSR, visceral-tosubcutaneous fat ratio; ROC,
receiver operating characteristic.
Clinical characteristics of 358
patients evaluated using FibroScan.
Clinical characteristics of 270
patients evaluated using computed tomography.
Controlled attenuation parameter and
clinical characteristics of 358 patients evaluated using
FibroScan.
Acknowledgements
Not applicable.
Funding
Funding: Not applicable.
Availability of data and materials
The data generated in the present study may be
requested from the corresponding author.
Author's contributions
TIc wrote the manuscript, analyzed the data and
designed the study. TIc, MY, SY, MK, YN, HY, OM, TIk, TO, KNag, KS,
KNi and KNak collected the data. TIc and MY, confirm the
authenticity of all the raw data. All the authors have read and
approved the final manuscript.
Ethics approval and consent to
participate
The study protocol conformed to the guidelines of
the 1975 Declaration of Helsinki, which was approved by the Human
Research Ethics Committee of the Nagasaki Harbor Medical Center
(Nagasaki, Japan; approval no. H30-031). Informed consent was
obtained from each patient included in the study, and they were
guaranteed the right to leave the study if desired.
Patient consent for publication
Not applicable.
Competing interests
The authors declare that they have no competing
interests.
References
|
1
|
Pabst O, Cerovic V and Hornef M: Secretory
IgA in the coordination of establishment and maintenance of the
microbiota. Trends Immunol. 37:287–296. 2016.PubMed/NCBI View Article : Google Scholar
|
|
2
|
Lycke NY and Bemark M: The regulation of
gut mucosal IgA B-cell responses: Recent developments. Mucosal
Immunol. 10:1361–1374. 2017.PubMed/NCBI View Article : Google Scholar
|
|
3
|
Takeuchi T, Miyauchi E, Kanaya T, Kato T,
Nakanishi Y, Watanabe T, Kitami T, Taida T, Sasaki T, Negishi H, et
al: Acetate differentially regulates IgA reactivity to commensal
bacteria. Nature. 595:560–564. 2021.PubMed/NCBI View Article : Google Scholar
|
|
4
|
Inamine T and Schnabl B: Immunoglobulin A
and liver diseases. J Gastroenterol. 53:691–700. 2018.PubMed/NCBI View Article : Google Scholar
|
|
5
|
Doi H, Hayashi E, Arai J, Tojo M, Morikawa
K, Eguchi J, Ito T, Kanto T, Kaplan DE and Yoshida H: Enhanced
B-cell differentiation driven by advanced cirrhosis resulting in
hyperglobulinemia. J Gastroenterol Hepatol. 2018.PubMed/NCBI View Article : Google Scholar : (Online ahead of
print).
|
|
6
|
Kotsiliti E, Leone V, Schuehle S, Govaere
O, Li H, Wolf MJ, Horvatic H, Bierwirth S, Hundertmark J, Inverso
D, et al: Intestinal B-cells license metabolic T-cell activation in
NASH microbiota/antigen-independently and contribute to fibrosis by
IgA-FcR signalling. J Hepatol. 79:296–313. 2023.PubMed/NCBI View Article : Google Scholar
|
|
7
|
Tomita K, Teratani T, Yokoyama H, Suzuki
T, Irie R, Ebinuma H, Saito H, Hokari R, Miura S and Hibi T: Serum
immunoglobulin A concentration is an independent predictor of liver
fibrosis in nonalcoholic steatohepatitis before the cirrhotic
stage. Dig Dis Sci. 56:3648–3654. 2011.PubMed/NCBI View Article : Google Scholar
|
|
8
|
Maleki I, Aminafshari MR, Taghvaei T,
Hosseini V, Rafiei A, Torabizadeh Z, Barzin M and Orang E: Serum
immunoglobulin A concentration is a reliable biomarker for liver
fibrosis in non-alcoholic fatty liver. World J Gastroenterol.
20:12566–12573. 2014.PubMed/NCBI View Article : Google Scholar
|
|
9
|
Danpanichkul P, Ng CH, Muthiah MD,
Duangsonk K, Yong JN, Tan DJH, Lim WH, Wong ZY, Syn N, Tsusumi T,
et al: The silent burden of non-alcoholic fatty liver disease in
the elderly : A global burden of disease analysis. Aliment
Pharmacol Ther. 58:1062–1074. 2023.PubMed/NCBI View Article : Google Scholar
|
|
10
|
Devarbhavi H, Asrani SK, Arab JP, Nartey
YA, Pose E and Kamath PS: Global burden of liver disease: 2023
update. J Hepatol. 79:516–537. 2023.PubMed/NCBI View Article : Google Scholar
|
|
11
|
Younossi ZM, Henry L, Isaacs S and Cusi K:
Identification of high risk NAFLD patients in endocrinology
clinics. Endocr Pract. 29:912–918. 2023.PubMed/NCBI View Article : Google Scholar
|
|
12
|
Wattacheril JJ, Abdelmalek MF, Lim JK and
Sanyal AJ: AGA clinical practice update on the role of noninvasive
biomarkers in the evaluation and management of nonalcoholic fatty
liver disease: Expert review. Gastroenterology. 165:1080–1088.
2023.PubMed/NCBI View Article : Google Scholar
|
|
13
|
Eddowes PJ, Sasso M, Allison M, Tsochatzis
E, Anstee QM, Sheridan D, Guha IN, Cobbold JF, Deeks JJ, Paradis V,
et al: Accuracy of FibroScan controlled attenuation parameter and
liver stiffness measurement in assessing steatosis and fibrosis in
patients with nonalcoholic fatty liver disease. Gastroenterology.
156:1717–1730. 2019.PubMed/NCBI View Article : Google Scholar
|
|
14
|
Kiyoaki I, Sumida Y, Nakade Y, Okumura A,
Nishimura S, Ibusuki M, Kitano R, Sakamoto K, Kimoto S, Inoue T, et
al: Mac-2 binding protein glycosylation isomer, the FIB-4 index,
and a combination of the two as predictors of non-alcoholic
steatohepatitis. PLoS One. 17(e0277380)2022.PubMed/NCBI View Article : Google Scholar
|
|
15
|
Guo J, Han X, Huang W, You Y and Jicheng
Z: Interaction between IgA and gut microbiota and its role in
controlling metabolic syndrome. Obes Rev. 22(e13155)2021.PubMed/NCBI View Article : Google Scholar
|
|
16
|
Guo X, Meng G, Liu F, Zhang Q, Liu L, Wu
H, Du H, Shi H, Xia Y, Liu X, et al: Serum levels of
immunoglobulins in an adult population and their relationship with
type 2 diabetes. Diabetes Res Clin Pract. 115:76–82.
2016.PubMed/NCBI View Article : Google Scholar
|
|
17
|
Rafaqat S, Sattar A, Khalid A and Rafaqat
S: Role of liver parameters in diabetes mellitus-a narrative
review. Endocr Regul. 57:200–220. 2023.PubMed/NCBI View Article : Google Scholar
|
|
18
|
Kim EH, Kim HK, Lee MJ, Bae SJ, Choe J,
Jung CH, Kim CH, Park JY and Lee WJ: Sex differences of visceral
fat area and visceral-to-subcutaneous fat ratio for the risk of
incident type 2 diabetes mellitus. Diabetes Metab J. 46:486–498.
2022.PubMed/NCBI View Article : Google Scholar
|
|
19
|
Mitsiopoulos N, Baumgartner RN, Heymsfield
SB, Lyons W, Gallagher D and Ross R: Cadaver validation of skeletal
muscle measurement by magnetic resonance imaging and computerized
tomography. J Appl Physiol (1985). 85:115–122. 1998.PubMed/NCBI View Article : Google Scholar
|
|
20
|
Rinella ME, Lazarus JV, Ratziu V, Francque
SM, Sanyal AJ, Kanwal F, Romero D, Abdelmalek MF, Anstee QM, Arab
JP, et al: A multisociety Delphi consensus statement on new fatty
liver disease nomenclature. J Hepatol. 79:1542–1556.
2023.PubMed/NCBI View Article : Google Scholar
|
|
21
|
Fujiwara N, Nakagawa H, Kudo Y, Tateishi
R, Taguri M, Watadani T, Nakagomi R, Kondo M, Nakatsuka T, Minami
T, et al: Sarcopenia, intramuscular fat deposition, and visceral
adiposity independently predict the outcomes of hepatocellular
carcinoma. J Hepatol. 63:131–140. 2015.PubMed/NCBI View Article : Google Scholar
|
|
22
|
Shephard DA: The 1975 declaration of
helsinki and consent. Can Med Assoc J. 115:1191–1192.
1976.PubMed/NCBI
|
|
23
|
Tarantino G, Citro V, Esposit P, Giaquinto
S, de Leone A, Milan G, Tripodi FS, Cirillo M and Lobello R: Blood
ammonia levels in liver cirrhosis: A clue for the presence of
portosystemic collateral veins. BMC Gastroenterol.
9(21)2009.PubMed/NCBI View Article : Google Scholar
|
|
24
|
Johnson PJ, Berhane S, Kagebayashi C,
Satomura S, Teng M, Reeves HL, O'Beirne J, Fox R, Skowronska A,
Palmer D, et al: Assessment of liver function in patients with
hepatocellular carcinoma: A new evidence-based approach-the ALBI
grade. J Clin Oncol. 33:550–558. 2015.PubMed/NCBI View Article : Google Scholar
|
|
25
|
Kamath P, Wiesner RH, Malinchoc M, Kremers
W, Therneau TM, Kosberg CL, D'Amico G, Dickson ER and Kim WR: A
model to predict survival in patients with end-stage liver disease.
Hepatology. 33:464–470. 2001.PubMed/NCBI View Article : Google Scholar
|
|
26
|
Vallet-Pichard A, Mallet V, Nalpas B,
Verkarre V, Nalpas A, Dhalluin-Venier V, Fontaine H and Pol S:
FIB-4: An inexpensive and accurate marker of fibrosis in HCV
infection. Comparison with liver biopsy and FibroTest. Hepatology.
46:32–36. 2007.PubMed/NCBI View Article : Google Scholar
|
|
27
|
Newsome PN, Sasso M, Deeks JJ, Paredes A,
Boursier J, Chan WK, Yilmaz Y, Czernichow S, Zheng MH, Wong VW, et
al: FibroScan-AST (FAST) score for the non-invasive identification
of patients with non-alcoholic steatohepatitis with significant
activity and fibrosis: A prospective derivation and global
validation study. Lancet Gastroenterol Hepatol. 5:362–373.
2020.PubMed/NCBI View Article : Google Scholar
|
|
28
|
Mózes FE, Lee JA, Vali Y, Alzoubi O,
Staufer K, Trauner M, Paternostro R, Stauber RE, Holleboom AG, van
Dijk AM, et al: Performance of non-invasive tests and histology for
the prediction of clinical outcomes in patients with non-alcoholic
fatty liver disease: An individual participant data meta-analysis.
Lancet Gastroenterol Hepatol. 8:704–713. 2023.PubMed/NCBI View Article : Google Scholar
|
|
29
|
Torruellas C, French SW and Medici V:
Diagnosis of alcoholic liver disease. World J Gastroenterol.
20:11684–11699. 2014.PubMed/NCBI View Article : Google Scholar
|
|
30
|
Zagato E, Mazzini E and Rescigno M: The
variegated aspects of immunoglobulin A. Immunol Lett. 178:45–49.
2016.PubMed/NCBI View Article : Google Scholar
|
|
31
|
Tarantino G and Citro V: What are the
common downstream molecular events between alcoholic and
nonalcoholic fatty liver? Lipids Health Dis. 23(41)2024.PubMed/NCBI View Article : Google Scholar
|
|
32
|
Jung CH, Rhee EJ, Kwon H, Chang Y, Ryu S
and Lee WY: Visceral-to-subcutaneous abdominal fat ratio is
associated with nonalcoholic fatty liver disease and liver
fibrosis. Endocrinol Metab (Seoul). 35:165–176. 2020.PubMed/NCBI View Article : Google Scholar
|
|
33
|
Hernández-Conde M, Llop E, Carrillo CF,
Tormo B, Abad J, Rodriguez L, Perelló C, Gomez ML, Martínez-Porras
JL, Puga NF, et al: Estimation of visceral fat is useful for the
diagnosis of significant fibrosis in patients with non-alcoholic
fatty liver disease. World J Gastroenterol. 26:6514–6705.
2020.PubMed/NCBI View Article : Google Scholar
|
|
34
|
Ha NB, Cho SJ, Mohamad Y, Kent D, Jun G,
Wong R, Swarnakar V, Lin S, Maher JJ and Lai JC: Visceral adipose
tissue inflammation and radiographic visceral-to-subcutaneous
adipose tissue ratio in patients with cirrhosis. Dig Dis Sci.
67:3436–3444. 2022.PubMed/NCBI View Article : Google Scholar
|
|
35
|
Tarantino G, Sinatti G, Citro V, Santini
SJ and Balsano C: Sarcopenia, a condition shared by various
diseases: Can we alleviate or delay the progression? Intern Emerg
Med. 18:1887–1895. 2023.PubMed/NCBI View Article : Google Scholar
|