Introduction
Free radicals are compounds with unpaired electrons,
capable of causing diseases such as cancer by searching for
reactive electron pairs. The harmful effect of free radicals can be
inhibited by antioxidant compounds derived from plants, which are
usually phenolic compounds and their derivatives (l).
The conventional method used to extract plant crude
drug in traditional medicine is maceration for 15 min, followed by
pressing. Maceration is the process of soaking plant crude drug in
extraction solvent at room temperature. Extraction efficiency is
often affected by several factors, including solvent concentration,
duration, temperature and the ratio of ingredients to solvent
(2). Soursop (Annona
muricata L.) is a plant that thrives in tropical regions.
Soursop leaves are utilized as natural medicine due to their
various health benefits and as a source of antioxidants that
inhibit peroxide formation. Soursop can serve as an anticancer,
antidiarrheal, and antidiabetic agent (3). The present study aimed to optimize
extraction conditions (length of extraction, crude drug:solvent and
solvent concentration) of soursop leaves, which are used in
traditional medicine. These leaves contain flavonoids and tannins
(3), which contribute to
antioxidant activity.
The present study aimed to determine the optimal
process variables by response surface methodology (RSM). RSM is a
statistical technique that is often used to optimize and develop
processes influenced by multiple factors (4,5). The
analysis was conducted to achieve maximum levels of 2,2-diphenyl
1-picrylhydrazyl (DPPH), cupric ion reducing antioxidant capacity
(CUPRAC) and ferric reducing antioxidant power (FRAP), as well as
total phenolic content (TPC) and total flavonoid content (TFC),
along with identification and determination of flavonoid compounds
in the optimized extract.
Materials and methods
Reagents
Fresh leaves of Annona muricata L. were
collected from Cimahi City, West Java, Indonesia. Reagents used
included ethanol, distilled water, chloroform, toluene, magnesium
powder, amyl alcohol, hydrochloric acid, gelatin, Stiasny's reagent
(30% formaldehyde:hydrochloric acid, 2:1), iron (III) chloride,
sodium acetate, sodium hydroxide, ether, Liebermann's-Burchard
reagent (acetic anhydride:concentrated sulfuric acid, 2:1),
ammonia, Dragendorff's reagent [bismuth (III) subnitrate,
concentrated nitric acid and potassium iodide], Mayer's reagent
[mercury (II) chloride and potassium chloride], sodium carbonate,
Folin-Ciocalteu reagent, gallic acid, methanol analytical grade
quercetin, methanol, aluminum chloride, 2.4.6-tripyridyl-s-triazine
(TPTZ), 2.2-diphenyl 1-picrylhydrazyl (DPPH), ascorbic acid and
neocuproine. Instruments included water bath, microscope (Olympus
Corporation), UV lamp (Camag), UV-visible (vis) spectrophotometer
(Thermo Fisher Scientific, Inc.; Trace 1300) and high-performance
liquid chromatography (HPLC) device (Shimadzu Corporation).
Preparation of crude drug
Soursop leaves were washed, air-dried, cut into
pieces, dried at 40-50˚C in an oven, then ground to crude drug
powder, followed by storage in a dry closed container.
Phytochemical screening
Phytochemical screening was conducted to identify
the presence of secondary metabolites such as flavonoids, phenols,
tannins, saponins, alkaloids, coumarins, steroids/triterpenoids,
and quinones. Previously, a stock solution was prepared by boiling
5 g of the soursop leaf crude drug with 100 ml of water for 15 min,
followed by filtration. The filtrate was used for secondary
metabolite analysis.
Flavonoid determination
For flavonoid determination, a 5 ml extract stock
solution was prepared and placed in a test tube. Then, 100 mg Mg, 1
ml concentrated HCl, and 5 ml amyl alcohol were added to the test
tube, which was gently shaken. The test tube was left for some
time, and color changes were observed. Positive results for
flavonoids were indicated by color changes to red, yellow, and
orange in the amyl alcohol layer (6).
Tannin determination
To determine tannins, a 15 ml stock solution was
divided into 3 test tubes (each containing 5 ml stock solution). A
total of 2-3 drops of 5% FeCl3 were added to the first test tube,
and color changes were observed. Positive results for tannins were
indicated by color changes to green, blue, and black. In the second
test tube, a few drops of 10% gelatin were added, and the formation
of a white precipitate indicated a positive result for tannins. In
the third test tube, Stiasny's reagent was added, heated in a water
bath, and the formation of a pink precipitate indicated positive
results for catechol tannins. The test results using Stiasny's
reagent were filtered, and the filtrate was taken. The filtrate was
then added with 1 M sodium acetate and 5% FeCl3, and a color change
to blue indicated positive results for tannin gallate. Stiasny's
reagent was prepared by mixing 10 ml 37% formaldehyde with 10 ml
concentrated HCl (6).
Quinones determination
For quinone determination, a 5 ml stock solution was
prepared and placed in a test tube. A few drops of 1 N NaOH were
added, and a color change to red indicated positive results for
quinones (6).
Saponin determination
To examine saponins, a 10 ml stock solution was
shaken in a test tube until foam 1-10 cm high was formed. If the
foam remained stable for 10 min, 1 drop of 2N HCl was added. Stable
foam after adding 2N HCl indicated positive results for saponins
(6).
Steroid/triterpenoid examination
For steroid/triterpenoid examination, 1 g of crude
drug was mixed with 20 ml of ether, ground in a mortar, filtered,
and evaporated to a residue. Liebermann-Burchard reagent was added
to the residue, and color changes to green-blue indicated positive
results for steroids, while red-purple indicated positive results
for triterpenoids (6).
Alkaloid determination
To determine alkaloids, 2 g of crude drug was mixed
with 10 ml of 2N HCl, filtered, and 5 ml of 25% ammonia was added
to the filtrate. Liquid-liquid extraction with chloroform was
performed, and the resulting chloroform layer was tested with
Dragendorff's reagent. Orange color changes indicated positive
results for alkaloids. Further liquid-liquid extraction with 2N HCl
was conducted, and Mayer's reagent was used to test for alkaloids,
with orange color changes indicating positive results and the
formation of a white precipitate indicating positive results for
alkaloids (6).
Coumarin determination
For coumarin determination, NaOH filter paper was
prepared by soaking filter paper in 1 N NaOH and drying it. Then,
0.5 g of crude drug sample was weighed, and 5 ml of chloroform was
added for extraction.
Extraction design with Box-Behnken
model
Extraction parameters were designed using the RSM
method with Box-Behnken model in Minitab 21 (dti.itb.ac.id/minitab/). The parameters included
duration of extraction (10-40 min), crude drug:solvent ratio
(1:3-1:10) and solvent concentration (70-96%). A 10 min extraction
time was used as the lowest level because the natural product
extract industry in Indonesia uses a maceration process for 15 min,
followed by pressing. The use of a time <15 min allowed for a
margin from the standard procedure to explore optimization
possibilities. Meanwhile, the highest level was set at 40 min;
industrial extraction times are <1 h due to inefficiency and
increased costs. The crude drug:solvent ratio was 1:3 for the
lowest level to ensure proper immersion, with the solvent level 5
cm above crude drug. For the highest level, a 1:10 ratio was used
according to extraction standard (7). Additionally, 70 and 96% ethanol
solvent concentrations were used at the lowest and highest levels,
respectively. These concentrations are commonly applied in the
natural product extract industry as universal solvents. Extracts
were prepared as in Table I.
 | Table ISoursop leaf extraction parameters
using Box-Behnken model. |
Table I
Soursop leaf extraction parameters
using Box-Behnken model.
| Extract no. | Extraction
duration, min | Crude drug: solvent
ratio | Solvent
concentration, % |
|---|
| 1 | 10 | 1:3.0 | 83 |
| 2 | 40 | 1:3.0 | 83 |
| 3 | 10 | 1:10.0 | 83 |
| 4 | 40 | 1:10.0 | 83 |
| 5 | 10 | 1:6.5 | 70 |
| 6 | 40 | 1:6.5 | 70 |
| 7 | 10 | 1:6.5 | 96 |
| 8 | 40 | 1:6.5 | 96 |
| 9 | 25 | 1:3.0 | 70 |
| 10 | 25 | 1:10.0 | 70 |
| 11 | 25 | 1:3.0 | 96 |
| 12 | 25 | 1:10.0 | 96 |
| 13 | 25 | 1:6.5 | 83 |
| 14 | 25 | 1:6.5 | 83 |
| 15 | 25 | 1:6.5 | 83 |
Extraction and extract
characterization
A total of 10 g soursop leaf crude drug was weighed
and extracted using maceration, followed by pressing. The solvent
used for extraction was ethanol and the extract was concentrated
using a water bath. This was followed by determination of % yield
of extract and the specific gravity. A 1% extract was prepared in
10 ml of each extraction solvent. The dissolved part and the
insoluble part were transferred using a pipette into a 5 ml
pycnometer. The weights of the empty pycnometer and the pycnometer
containing the extract were measured. The specific gravity of water
was assumed to be 1 g/ml. The formula used to calculate the extract
specific gravity is: [(pycnometer weight + extract)-empty
pycnometer weight]/pycnometer volume.
TPC
TPC was analyzed by adding 10% Folin-Ciocalteu to a
series of standard and sample solutions. Gallic acid was used as
the standard at a concentration range of 60-130 µg/ml to create a
calibration curve. The 1,000 µg/ml gallic acid stock solution was
diluted with methanol for analysis. Subsequently, 50 µl each
concentration of gallic acid was added, followed by 500 µl 10%
Folin-Ciocalteu reagent and 400 µl 1 M sodium carbonate. The
mixture was incubated at room temperature for 30 min. The
absorbance of soursop leaf extract was determined using a UV-Vis
spectrophotometer at 765 nm. Absorption readings of standard
solution were taken three times for each concentration and a
calibration curve was created. Absorption measurement of each
extract solution was performed six times and TPC was determined
according to the gallic acid calibration curve as gallic acid
equivalent (GAE) (8).
TFC
Analysis of TFC was carried out using a sample and a
series of standard solutions. Quercetin (45-100 µg/ml) was used as
standard: Stock solution (1,000 µg/ml) was diluted with methanol to
generate a calibration curve. A total of ~100 µl each quercetin
concentration was combined with 300 µl methanol analytical grade,
20 µl 1 M sodium acetate 20 µl 10% AlCl3 and 560 µl
distilled water. After incubating the mixture for 30 min at room
temperature. Absorbance of soursop leaf extract was determined
using a UV-Vis spectrophotometer at a wavelength of 415 nm.
Measurement was performed three times for each concentration to
obtain a calibration curve. This was followed by the determination
of the TFC of each sample. Leaf extract was dissolved in methanol
pro analysis and subjected to the same procedure as the quercetin
standard solution. The absorbance measurement of the extract
solution was performed six times for each extract. TFC was
determined using the quercetin calibration curve and denoted as
quercetin equivalent (QE) (9).
Antioxidant activity. DPPH method
DPPH method was performed as outlined by Celep et
al (10), with minor
adjustments. Ascorbic acid (3-8 µg/ml)was used as a standard
solution. Absorbance of 50 µg/ml DPPH solution was determined using
a UV-vis spectrophotometer at a wavelength of 517 nm to obtain A0
value. The stock solution of ascorbic acid standard (200 µg/ml) was
prepared by dissolving 20 mg of ascorbic acid in 100 ml methanol
analytical grade. A total of 125 µl each concentration was mixed
with 750 µl DPPH solution and incubated at room temperature for 30
min. The absorbance of each standard solution was measured at a
wavelength of 517 nm using methanol as a blank. The concentration
of each standard solution was measured three times and a
calibration curve was constructed based on percentage of DPPH
scavenging on the y-axis vs. various amounts of ascorbic acid on
the x-axis (10). This was followed
by the determination of antioxidant activity of each sample.
Subsequently, each soursop leaf extract was dissolved in methanol
analytical grade and subjected to the same procedure. The
absorbance measurement of extract solution was repeated six times
for each extract. Absorbance was the percentage of DPPH scavenging
by soursop leaf extract. Antioxidant activity was calculated
according to the calibration curve of ascorbic acid as ascorbic
acid equivalent antioxidant capacity (AEAC) (10).
CUPRAC method. Antioxidant activity analysis
using the CUPRAC method was performed as described by Özyürek et
al (11), with minor
adjustments. Ascorbic acid was used as a reference solution (3-8
µg/ml). CUPRAC stock solution was obtained by mixing
CuCl2.H2O (1,705 µg/ml) with neocuproine
solution (1,562 µg/ml). CUPRAC stock (100 µg/ml) was prepared using
ammonium acetate buffer (pH, 7.0). The ascorbic acid solution (200
µg/ml) was diluted using 250 µl ammonium acetate buffer. A total of
750 µl CUPRAC solution was added to the diluted ascorbic acid,
which was incubated at room temperature for 30 min in the dark. The
absorbance was determined using a UV-Vis spectrophotometer at 450
nm using ammonium acetate buffer as a blank and the measurements
were repeated three times. A calibration curve was created based on
% increase in CUPRAC (11). Each
soursop leaf extract was dissolved in methanol and subjected to the
same procedure as the reference solution, with six repetitions.
Antioxidant activity was determined as AEAC (11).
FRAP method. The FRAP method was used to test
antioxidant activity, following modified procedures of Özyürek
et al (11). Ascorbic acid
was utilized as a standard solution (3-8 µg/ml). FRAP stock
solution was obtained by mixing FeCl3.6H2O
(0.02 M) with TPTZ solution (0.01 M). Subsequently, the stock
solution was diluted with acetate buffer (pH, 3.6; 0.04 M) at a
1:1:10 ratio of FeCl3.6H2O:TPTZ:sodium
acetate buffer at concentration of 710 µg/ml. The ascorbic acid
solution (200 µg/ml) was diluted to 3-8 µg/ml) using distilled
water. FRAP solution was mixed with 500 µl diluted ascorbic
solution and left to incubate at room temperature in a dark room
for 30 min. The absorbance of each reference solution was
determined using a UV-Vis spectrophotometer at a wavelength of 595
nm, with sodium acetate buffer used as a blank. A calibration curve
was constructed based on the % increase in the FRAP capacity
(11). For each extract, soursop
leaves were dissolved in methanol analytical grade and subjected to
the same procedure as the reference solution, with six repetitions.
Antioxidant activity was assessed by calculating using the
calibration curve of ascorbic acid (11).
Optimized extract analysis
Antioxidant activity, TFC, and TPC were dependent
variables used in the optimization process. Regression coefficient
analysis was performed to obtain a polynomial model and final
equation. This was followed by the construction of contour and
surface plot for each independent and dependent variable. Based on
this plot, optimization of extraction time, crude drug-solvent
ratio, and solvent concentration was conducted using the Minitab to
identify the optimal values. A lack of fit test is performed to
evaluate how well a model represents the relationship between
variables in an experiment and the response variable. To assess fit
to the data, compare the P-value to the significance level,
typically set at 0.05. If the P-value exceeds the significance
level, it is not possible to conclude that the model does not fit
the data adequately. Re-extraction was carried out under optimal
conditions to calculate the error between the theoretical
calculations (obtained from the Minitab application) and the actual
calculations.
Determination of flavonoids by
HPLC
Identification and determination of flavonoid
content in optimized extract were performed using HPLC. The mobile
phase contained methanol and water with a linear gradient of 40-60%
methanol for 5 min, followed by 70% methanol for 5 min and 40%
methanol for 15 min. The stationary phase used was
LiChrospher® 100 RP-C18 (5 µm; 100x4 mm). A 20 µl
injection volume was used with a temperature of 30˚C and a flow
rate of 1 ml/min. The UV-vis detector with a wavelength of 360 nm
was applied for detection. Flavonoid content was determined using
the one-point method (12). The
standard solutions used as a standard included rutin, quercetin,
kaempferol, apigenin, and luteolin-7-O-glucoside dissolved in
methanol. The optimized extract was dissolved in methanol to
generate a concentration of 10,000 µg/ml before analyzing the
flavonoid content compound using HPLC.
Statistical analysis
Data were analyzed using Minitab 21 and are
presented as the mean ± standard deviation of 6 independent
experimental repeats. Statistical analysis was performed applying
one-way ANOVA followed by Tukey's post hoc test Correlation between
TPC, TFC, and antioxidant activity of different test methods was
determined using Pearson's method. P<0.05 was considered to
indicate a statistically significant difference.
Results
Determination of plants
Characterization by analyzing plant morphology using
specimens collected from Bandungense Herbarium, School of Life
Sciences and Technology, Bandung Institute of Technology confirmed
that the plant was A. muricata L.
Phytochemical constituents
The results of phytochemical screening showed that
soursop leaves contained flavonoids, phenols and
steroids/triterpenoids (Table
II).
| Table IIPhytochemical constituents in
Annona muricata L. leaf crude drug. |
Table II
Phytochemical constituents in
Annona muricata L. leaf crude drug.
| Component | Detection |
|---|
| Flavonoid | Positive |
| Phenol | Positive |
| Tannin | Negative |
| Quinone | Negative |
| Saponin | Negative |
|
Steroid/triterpenoid | Positive |
| Coumarin | Negative |
| Alkaloid | Negative |
Extraction and extract
characterization
Characterization involved measuring the specific
gravity, with consistent values observed across all samples,
ranging from 0.806 to 0.993 g/ml (Table III). A narrow specific gravity
range indicates that the specific gravity did not have an influence
on the activity. Extract 4 showed the highest yield of 42.30%.
Extract 11 showed the lowest yield of 4.00%.
| Table IIIExtract yield and specific gravity of
soursop leaf extract. |
Table III
Extract yield and specific gravity of
soursop leaf extract.
| Extract no. | Yield, % | Specific gravity,
g/ml |
|---|
| 1 | 5.100 | 0.973 |
| 2 | 5.700 | 0.990 |
| 3 | 15.000 | 0.993 |
| 4 | 42.300 | 0.843 |
| 5 | 13.500 | 0.883 |
| 6 | 10.100 | 0.871 |
| 7 | 8.100 | 0.814 |
| 8 | 11.100 | 0.806 |
| 9 | 5.900 | 0.874 |
| 10 | 17.500 | 0.884 |
| 11 | 4.000 | 0.850 |
| 12 | 18.100 | 0.811 |
| 13 | 12.270 | 0.977 |
| 14 | 12.270 | 0.977 |
| 15 | 12.270 | 0.977 |
Antioxidant activity
Table IV shows
antioxidant activity of ethanol extract of soursop leaf determined
by DPPH, CUPRAC and FRAP methods. The regression linear equation of
ascorbic acid with DPPH method was y=9.5356x + 8.7503 with
R2=0.99. The regression linear equation of ascorbic acid
with CUPRAC method was y=7.606x + 16.517 with R2=0.991.
The regression linear equation of ascorbic acid with FRAP method
was y=7.9599 x + 31.911 with R2=0.9907. Based on DPPH
method, the extract 7 exhibited the highest antioxidant activity at
189.695±14.673 mg AEAC/g sample. Conversely, the extract 3 showed
the lowest activity at 87.969±12.584 mg AEAC/g sample. Using CUPRAC
and FRAP, the extract 2 demonstrated the highest antioxidant
activity at 171.074±8.614 mg AEAC/g sample and 226.835±25.057 mg
AEAC/g sample, respectively. Conversely, the lowest results were
observed with extract 9 & 10.
| Table IVAntioxidant activity of ethanol
extract of soursop leaf. |
Table IV
Antioxidant activity of ethanol
extract of soursop leaf.
| Extract no. | DPPH, mg
AEAC/g | CUPRAC, mg
AEAC/g | FRAP, mg
AEAC/g |
|---|
| 1 | 108.681±8.180 | 136.967±11.064 | 145.126±16.437 |
| 2 | 158.426±22.242 | 171.074±8.614 | 226.835±25.057 |
| 3 | 87.968±12.584 | 131.880±4.993 | 140.254±20.714 |
| 4 | 118.294±6.332 | 139.386±9.885 | 146.261±34.490 |
| 5 | 98.775±4.672 | 126.350±12.808 | 151.118±14.585 |
| 6 | 137.804±11.568 | 145.081±7.665 | 141.887±17.917 |
| 7 | 189.695±14.673 | 162.121±11.076 | 208.803±13.513 |
| 8 | 116.776±13.624 | 126.559±14.482 | 118.968±23.190 |
| 9 | 99.229±8.612 | 94.179±13.117 | 142.441±11.330 |
| 10 | 122.240±9.361 | 143.413±12.258 | 130.644±22.285 |
| 11 | 157.812±7.962 | 139.580±11.452 | 165.184±31.459 |
| 12 | 158.470±5.428 | 128.141±8.691 | 140.773±17.117 |
| 13 | 140.770±7.471 | 148.054±11.347 | 160.971±17.454 |
| 14 | 140.770±7.471 | 148.054±11.347 | 160.971±17.454 |
| 15 | 140.770±7.471 | 148.054±11.347 | 160.971±17.454 |
TPC and TFC
TPC and TFC are presented in Table V. TPC was calculated using the
gallic acid calibration curve. Linear regression equation of gallic
acid was y=0.0067x - 0.0374, with R2=0.9956. Similarly,
in TFC method, quercetin was dissolved in methanol and used as a
reference solution. The linear regression equation for quercetin
was y=0.0052x + 0.0022, with R2 value of 0.9945 The
extract with the highest phenol and flavonoid content was extract
7, yielding 119.388±14.057 mg GAE/g sample and 91.212±4.796 mg QE/g
sample. The lowest phenol value was found in extract 10, resulting
in 50.851±2.570 mg GAE/g sample. The lowest total flavonoid value
was obtained from extract 5, yielding 20.095±1.510 mg QE/g
sample.
| Table VTPC and TFC of soursop leaf
extract. |
Table V
TPC and TFC of soursop leaf
extract.
| Extract no. | TPC, mg GAE/g | TFC, mg QE/g |
|---|
| 1 | 74.799±10.171 | 35.292±1.083 |
| 2 | 100.134±3.561 | 32.741±8.609 |
| 3 | 88.716±4.359 | 52.703±1.870 |
| 4 | 74.114±3.462 | 47.549±1.069 |
| 5 | 80.333±6.545 | 20.095±1.510 |
| 6 | 88.891±9.098 | 31.002±1.777 |
| 7 | 119.388±14.057 | 91.212±4.796 |
| 8 | 77.821±3.457 | 85.060±3.938 |
| 9 | 118.393±4.757 | 22.204±1.296 |
| 10 | 50.851±2.570 | 24.486±1.544 |
| 11 | 95.383±3.967 | 67.590±3.182 |
| 12 | 78.365±4.929 | 58.106±5.511 |
| 13 | 86.038±3.449 | 45.433±4.226 |
| 14 | 86.038±3.449 | 45.433±4.226 |
| 15 | 86.038±3.449 | 45.433±4.226 |
Multiple linear regression and
antioxidant activity response model
Table VI presents
ANOVA for assessing the fit of the optimization model and the
regression coefficients of the experimental variable. The suitable
model for all antioxidant activity response data is a quadratic
model. This model was obtained from the analysis using the Minitab
application where X1=extraction time, X2=crude drug-solvent ratio,
X3=Solvent concentration, as expressed in the following equations:
TPC=206 + 5.91X1 - 17.8 X2 - 3.26
X3 + 0.0095 X1 x X1 - 0.304
X2 x X2 + 0.0203 X3 x
X3 - 0.190 X1 x X2 - 0.0643
X1 x X3 + 0.278 X2 x
X3; TFC=33 + 0.72 X1 + 15.6 X2 -
3.18 X3 + 0.0231 X1 x X1 - 0.698
X2 x X2 + 0.0368 X3 x
X3 - 0.012 X1 x X2 - 0.0219
X1 x X3 - 0.065 X2 x
X3; DPPH=-206 + 15.35 X1 + 25.0 X2
+ 0.2 X3 - 0.0498 X1 x X1 - 0.92
X2 x X2 + 0.0363 X3 x
X3 - 0.090 X1 x X2 - 0.1433
X1 x X3 - 0.148 X2 x
X3; CUPRAC=-95 + 5.64 X1 + 39.9 X2
+ 17.4 X3 + 0.0233 X1 x X1 - 0.691
X2 x X2 - 0.0785 X3 x
X3 - 0.127 X1 x X2 - 0.0696
X1 x X3 - 0.333 X2 x X3
and FRAP=-697 + 9.15 X1 + 13.0 X2 + 16.6
X3 + 0.0323 X1 x X1 - 0.25
X2 x X2 - 0.078 X3 x X3
- 0.348 X1 x X2 - 0.1033 X1 x
X3 - 0.065 X2 x X3.
| Table VIRegression coefficients of the
predicted model. |
Table VI
Regression coefficients of the
predicted model.
| Model
parameter | TPC, mg GAE/g | TFC, mg QE/g | DPPH, mg
AEAC/g | CUPRAC, mg
AEAC/g | FRAP, mg
AEAC/g |
|---|
| Intercept | 206.000 | 33.000 | -206.000 | -95.000 | -697.000 |
| Linear | | | | | |
|
X1 | 5.910 | 0.720 | 15.350 | 5.640 | 9.150 |
|
X2 | -17.800 | 15.600 | 25.000 | 39.900 | 13.000 |
|
X3 | -3.260 | -3.180 | 0.200 | 17.400 | 16.600 |
| Interaction | | | | | |
|
X1
X2 | -0.190 | -0.012 | -0.090 | -0.127 | -0.348 |
|
X1
X3 | -0.064 | -0.022 | -0.143 | -0.070 | -0.103 |
|
X2
X3 | 0.278 | -0.065 | -0.148 | -0.333 | -0.065 |
| Quadratic | | | | | |
|
X12 | 0.010 | 0.0231 | -0.050 | 0.023 | 0.032 |
|
X22 | -0.304 | -0.698 | -0.92 | -0.691 | -0.250 |
|
X32 | 0.020 | 0.037 | 0.036 | -0.079 | -0.078 |
| R2 | 0.765 | 0.925 | 0.773 | 0.738 | 0.568 |
| P-value lack of
fit | 0.281 | 0.208 | 0.634 | 0.536 | 0.160 |
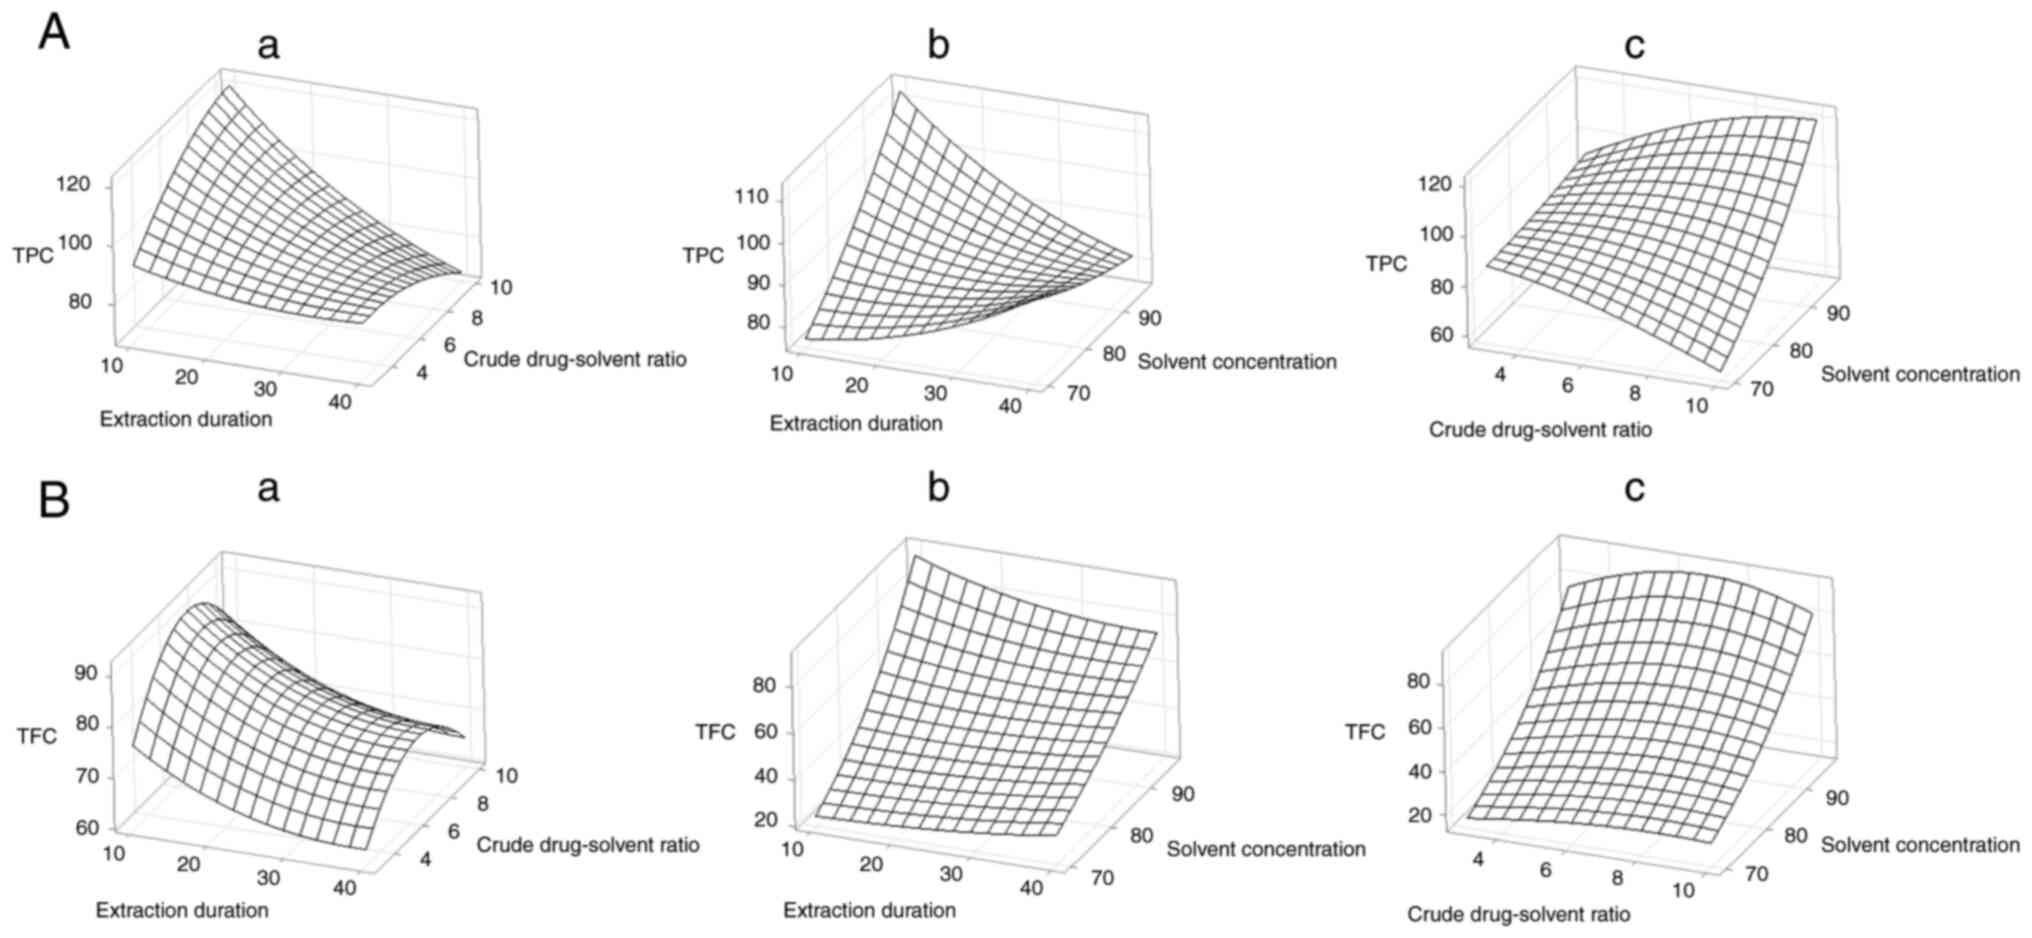
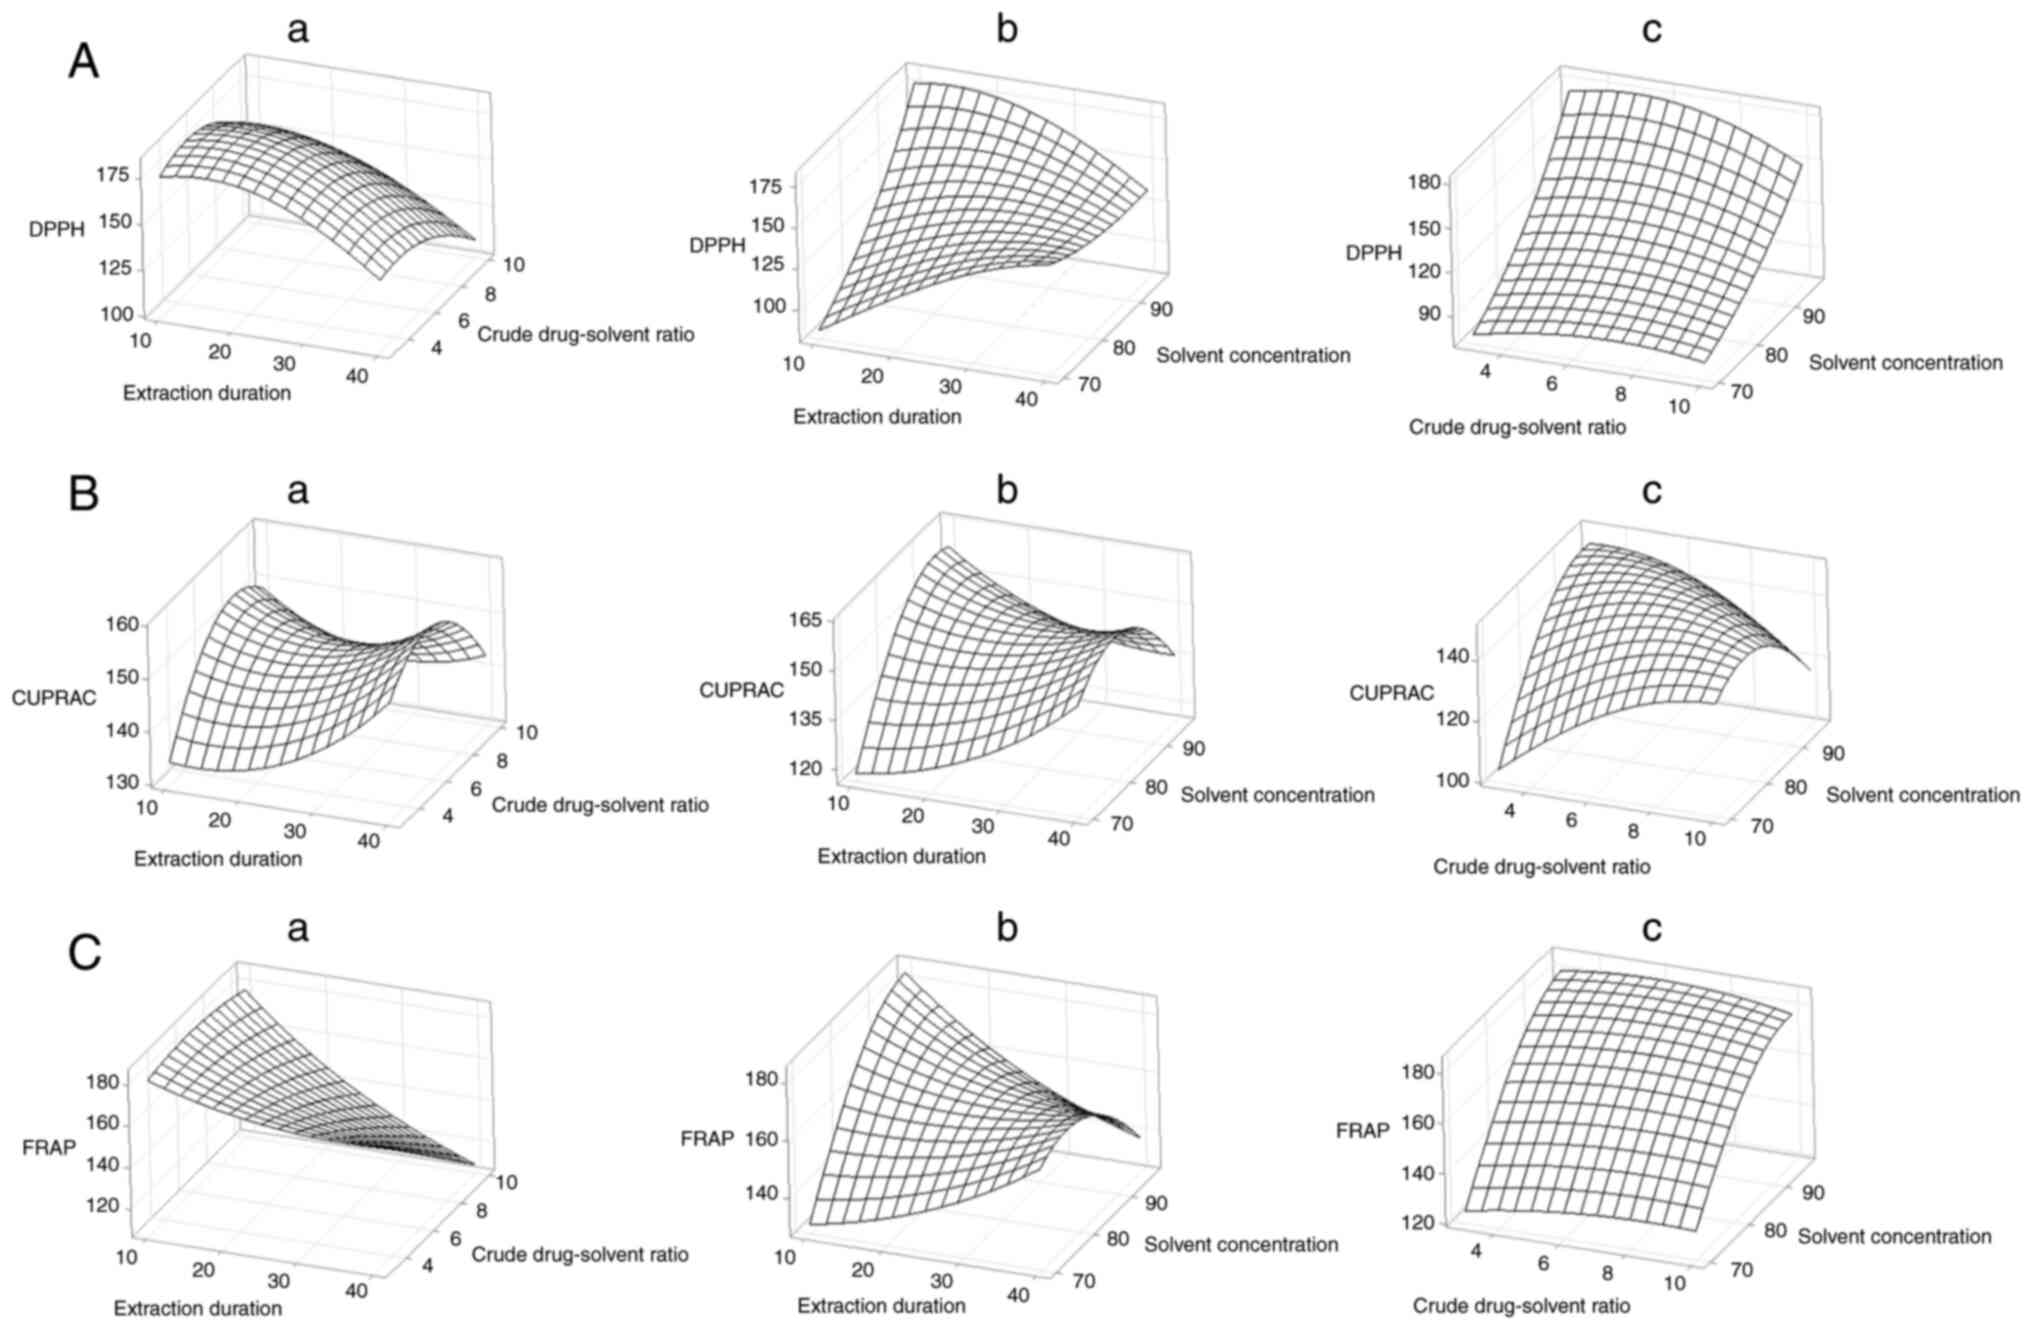
Analysis of regression coefficient and
response surface plot
Surface contour plot facilitated visualization of
statistical significance of the independent variables on the
dependent variables (Figs. 1 and
2). Extraction time of 10 min and
an ethanol concentration of 96% yielded the highest results for
total phenol, total flavonoid, DPPH, CUPRAC, and FRAP tests. The
total phenol test displayed a high response at a crude-drug ratio
of 1:10, whereas flavonoid, DPPH, CUPRAC, and FRAP tests showed the
highest response values at a crude-drug ratio of 1:6.5.
Optimization model validation
The contour plot overlay showed that duration of 10
min, a crude drug:solvent ratio of 1:6.5 and a solvent
concentration of 96% were the optimal extraction conditions with a
high desirability level of 0.817 (Fig.
3). The closer the desirability value is to 1, the better model
obtained. Re-extraction was performed with optimal conditions
(Table VII) to verify the
accuracy of the model. Subsequently, TPC, TFC, DPPH, CUPRAC and
FRAP were assessed (Table VIII).
Experimental values had an error range of 3.6-10.7% compared to the
predicted values.
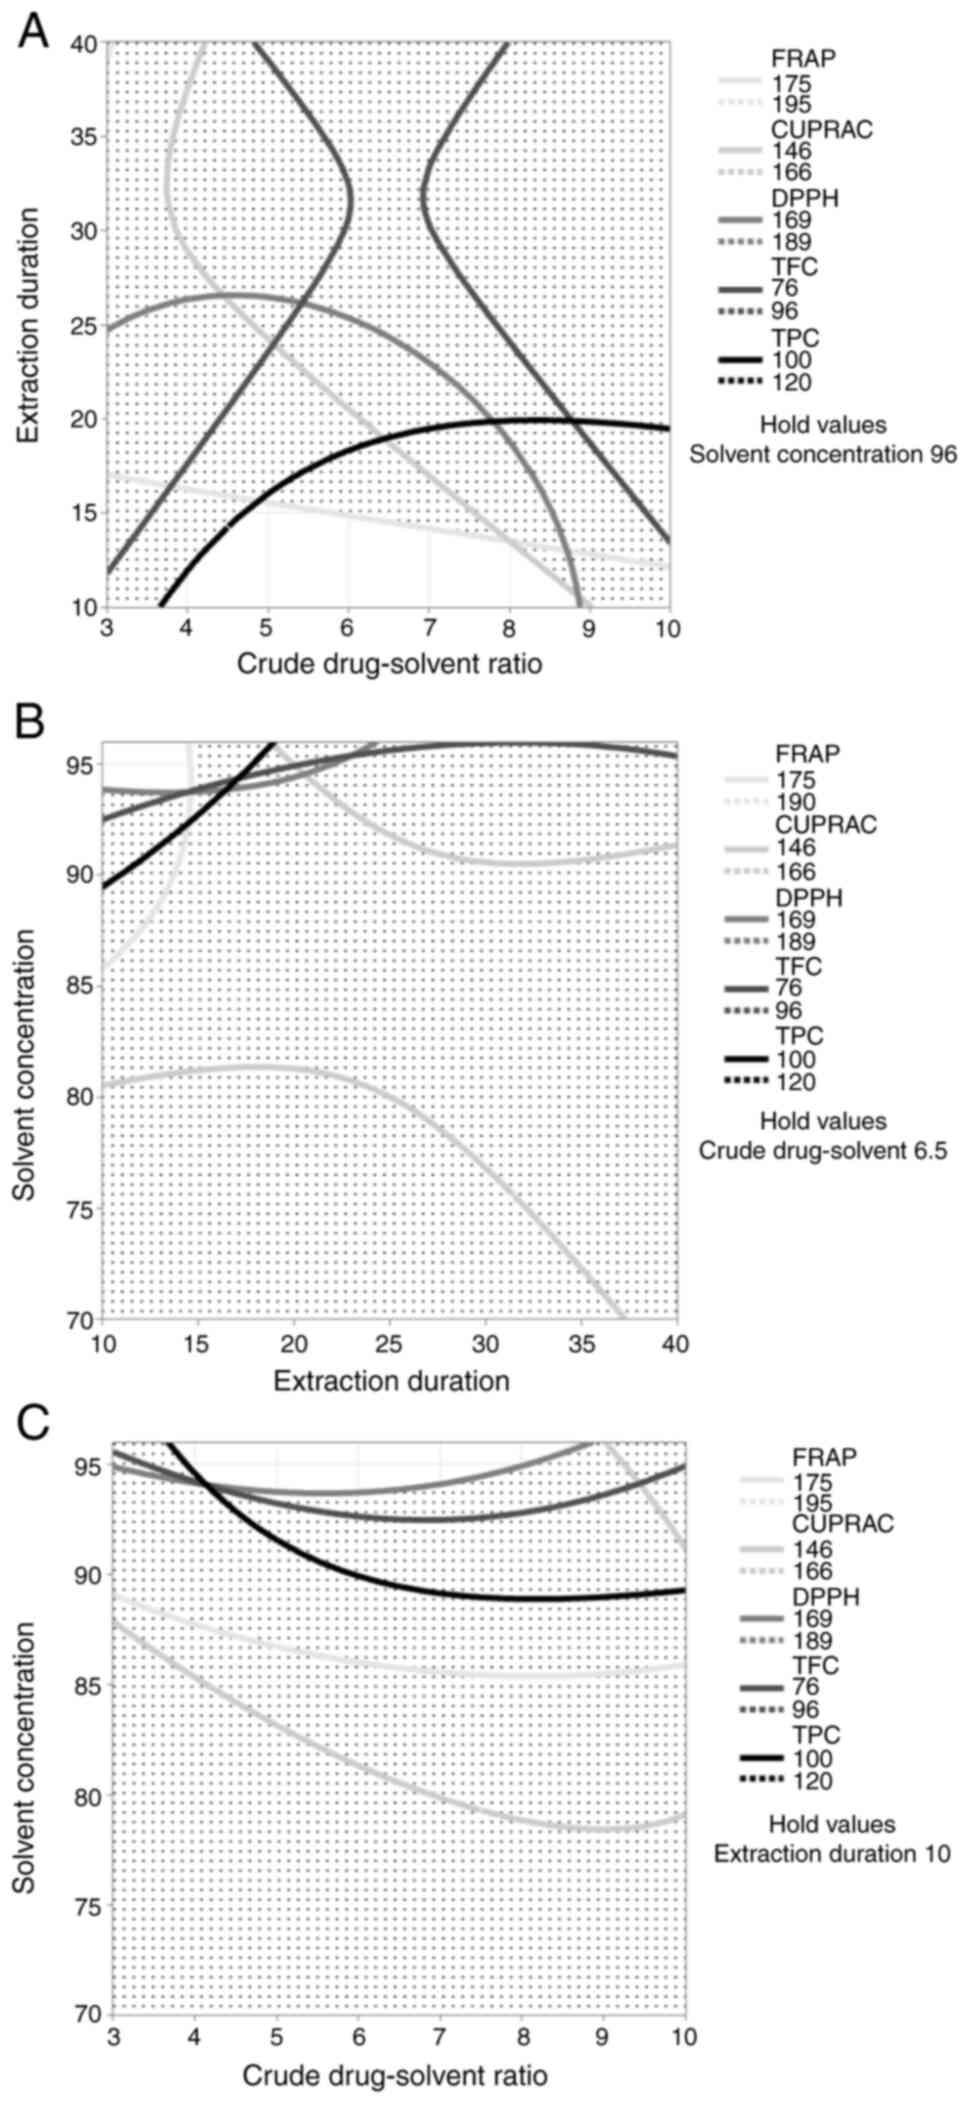 | Figure 3Overlay contour plot of TPC, TFC,
DPPH, CUPRAC and FRAP. Lines indicate the values of TPC, TFC, DPPH,
CUPRAC, and FRAP responses, and the white areas indicate the
regions with the highest response. (A) Extraction duration to crude
drug:solvent ratio. (B) Solvent concentration to extraction
duration. (C) Solvent concentration to crude drug:solvent ratio.
The key indicates the antioxidant activity value. DPPH,
2,2-diphenyl 1-picrylhydrazy; CUPRAC, cupric ion reducing
antioxidant capacity; FRAP, ferric reducing antioxidant power; TPC,
total phenolic content; TFC, total flavonoid content. |
| Table VIIOptimal soursop leaf extraction
conditions. |
Table VII
Optimal soursop leaf extraction
conditions.
| Variable | Value |
|---|
| Extraction
duration, min | 10.000 |
| Crude drug:solvent
ratio | 1:6.500 |
| Solvent
concentration, % | 96.000 |
| Desirability | 0.817 |
| Table VIIIModel validation. |
Table VIII
Model validation.
| Antioxidant
assessment | Experimental
value | Predicted
value | Error, % |
|---|
| TPC, mg GAE/g | 119.388±14.057 | 110.878 | 7.675 |
| TFC, mg QE/g | 91.212±4.796 | 86.989 | 4.854 |
| DPPH, mg
AEAC/g | 189.095±15.931 | 179.133 | 5.561 |
| CUPRAC, mg
AEAC/g | 162.121±11.076 | 156.509 | 3.586 |
| FRAP, mg
AEAC/g | 204.679±5.164 | 185.088 | 10.585 |
Quantitative correlation between TFC
and TPC and antioxidant activity
Correlation between TFC and TPC and antioxidant
activity is shown in Table IX. The
correlation between DPPH, CUPRAC and FRAP is presented in Table X, while CUPRAC and FRAP are shown in
Table XI. The correlation between
TFC and TPC, as well as the three antioxidant test methods, is
shown in Table XII. The
correlation ranges from 0.6 to 0.9, indicating a moderate to very
strong correlation.
| Table IXPearson correlation coefficient
between TPC and TFC of soursop leaf extract with DPPH, CUPRAC and
FRAP based on the Box-Behnken model. |
Table IX
Pearson correlation coefficient
between TPC and TFC of soursop leaf extract with DPPH, CUPRAC and
FRAP based on the Box-Behnken model.
| | DPPH
correlation | CUPRAC
correlation | FRAP
correlation |
|---|
| Extract no. | TPC | TFC | TPC | TFC | TPC | TFC |
|---|
| 1 |
0.892a |
0.825a |
0.944b |
0.730a |
0.923b |
0.753a |
| 2 |
0.885a |
0.855a |
0.797a |
0.664c |
0.922b |
0.791a |
| 3 |
0.752a |
0.766a |
0.887a |
0.910b |
0.718a |
0.740a |
| 4 |
0.965b |
0.830a |
0.896a |
0.978b |
0.888a |
0.856a |
| 5 |
0.910b |
0.938b |
0.971b |
0.888a |
0.842a |
0.962b |
| 6 |
0.659c |
0.719a |
0.974b |
0.983b |
0.611c |
0.665c |
| 7 |
0.902b |
0.951b |
0.996b |
0.722a |
0.628c |
0.692c |
| 8 |
0.939b |
0.840a |
0.952b |
0.986b |
0.933b |
0.772a |
| 9 |
0.884a |
0.780a |
0.929b |
0.855a |
0.914b |
0.949b |
| 10 |
0.993b |
0.941b |
0.847a |
0.962b |
0.981b |
0.911b |
| 11 |
0.993b |
0.806a |
0.790a |
0.989b |
0.981b |
0.870a |
| 12 |
0.971b |
0.828a |
0.989b |
0.857a |
0.862a |
0.900b |
| 13 |
0.988a |
0.942b |
0.988b |
0.949b |
0.913a |
0.850a |
| 14 |
0.988a |
0.942b |
0.988b |
0.949b |
0.913a |
0.850a |
| 15 |
0.988a |
0.942b |
0.988b |
0.949b |
0.913a |
0.850a |
| Table XPearson correlation coefficient
between antioxidant activity of soursop leaf extract and CUPRAC and
FRAP based on the Box-Behnken model. |
Table X
Pearson correlation coefficient
between antioxidant activity of soursop leaf extract and CUPRAC and
FRAP based on the Box-Behnken model.
| | Pearson's
correlation coefficient |
|---|
| DPPH extract
no. | CUPRAC | FRAP |
|---|
| 1 |
0.956a |
0.985a |
| 2 |
0.583b |
0.883c |
| 3 |
0.841c |
0.939a |
| 4 |
0.779c |
0.899a |
| 5 |
0.951a |
0.972a |
| 6 |
0.784c |
0.864c |
| 7 |
0.890c |
0.715c |
| 8 |
0.900a |
0.973a |
| 9 |
0.991a |
0.758c |
| 10 |
0.818c |
0.979a |
| 11 |
0.782c |
0.983a |
| 12 |
0.973a |
0.919a |
| 13 |
0.977a |
0.965a |
| 14 |
0.977a |
0.965a |
| 15 |
0.977a |
0.965a |
| Table XIPearson correlation coefficients
between antioxidant activity of soursop leaf extract using CUPRAC
and ferric reducing antioxidant power based on the Box-Behnken
model. |
Table XI
Pearson correlation coefficients
between antioxidant activity of soursop leaf extract using CUPRAC
and ferric reducing antioxidant power based on the Box-Behnken
model.
| CUPRAC extract
no. | Pearson's
correlation coefficient |
|---|
| 1 |
0.953a |
| 2 |
0.877b |
| 3 |
0.917a |
| 4 |
0.866b |
| 5 |
0.930a |
| 6 |
0.739b |
| 7 |
0.563c |
| 8 |
0.848b |
| 9 |
0.825b |
| 10 |
0.801b |
| 11 |
0.858b |
| 12 |
0.868b |
| 13 |
0.932a |
| 14 |
0.932a |
| 15 |
0.932a |
| Table XIIPearson correlation coefficients
between TPC and TFC of optimized soursop leaf extract and
antioxidant activity. |
Table XII
Pearson correlation coefficients
between TPC and TFC of optimized soursop leaf extract and
antioxidant activity.
| | Pearson's
correlation coefficient |
|---|
| Antioxidant
measure | TPC | TFC | DPPH | CUPRAC |
|---|
| DPPH |
0.902a |
0.951a | NA | NA |
| CUPRAC |
0.996a |
0.722b |
0.890b | NA |
| FRAP |
0.628c |
0.692c |
0.715b |
0.563c |
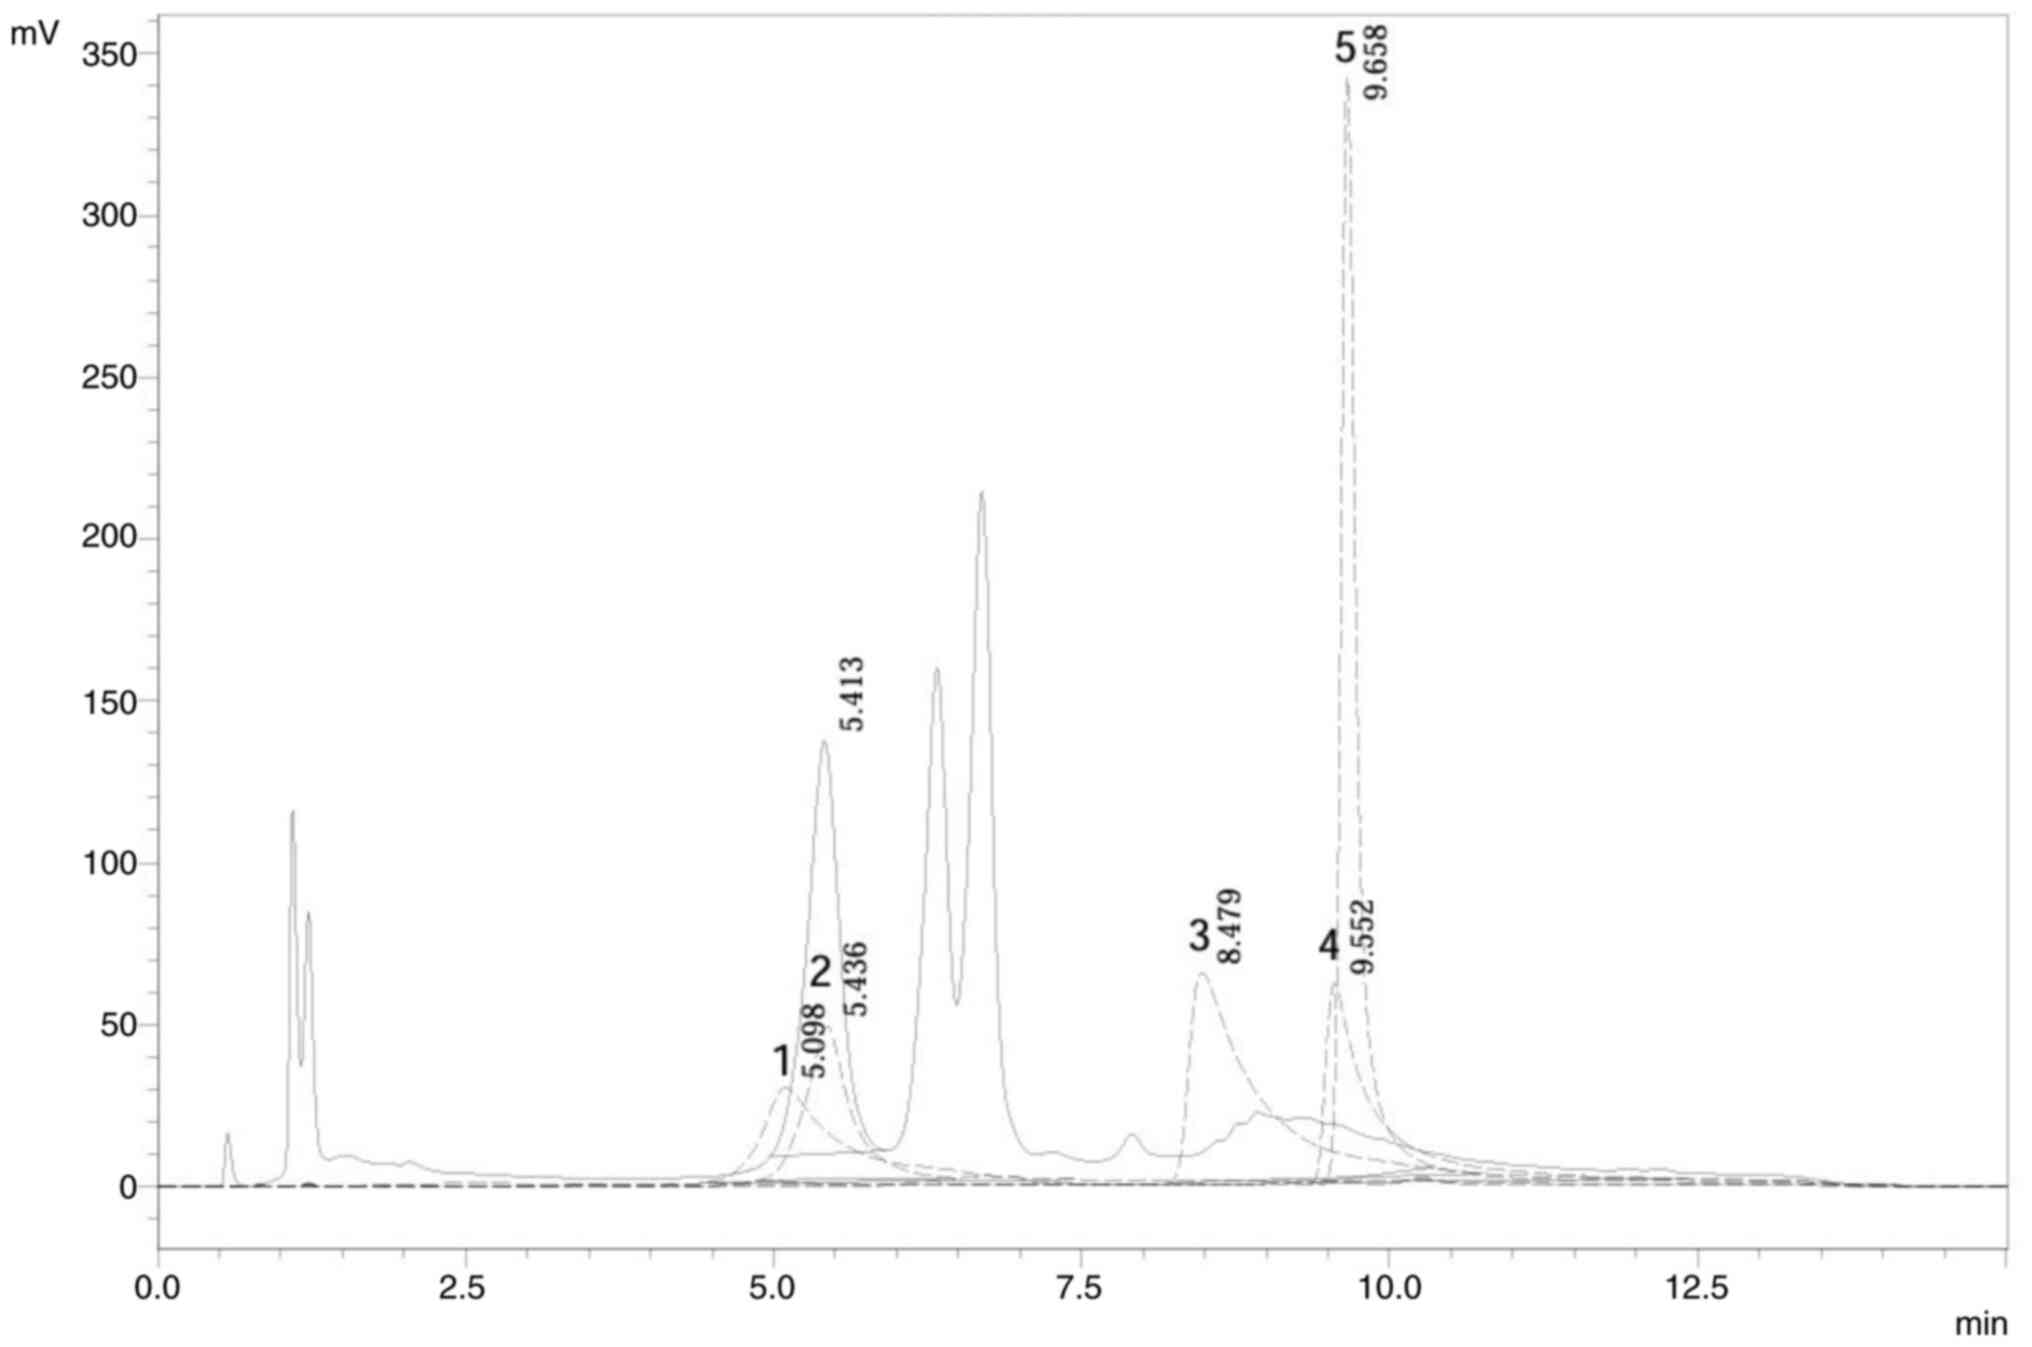
Determination of flavonoids by
HPLC
Fig. 4 shows the
HPLC chromatogram of the ethanol extract of soursop leaves
alongside the standard. The flavonoid in optimized extract showed
the same retention time as the standard. Table XIII shows flavonoid levels in the
optimized extract. Based on the chromatogram, only one peak in the
extract chromatogram overlapped with the peak of standard
chromatogram. Chromatogram extract at 5.413 min showed similarity
with rutin standard (extract 2) with retention time of 5.436 min.
Determination of the rutin level in the extract was carried out
using one point method, with the results showing a value of
11.52±1.06 mg/g.
| Table XIIIFlavonoid levels in optimized soursop
leaf ethanol extract. |
Table XIII
Flavonoid levels in optimized soursop
leaf ethanol extract.
| | Retention time,
min | AUC | |
|---|
| Compound | Reference | Sample | Reference | Sample | Level, mg/g |
|---|
|
Luteolin-7-O-glucoside | 5.10 | - | 1,508,800 | - | - |
| Rutin | 5.45 | 5.41 | 1,496,903 |
3,448,142±318,308 | 11.52±1.06 |
| Quercetin | 8.48 | - | 3,155,894 | - | - |
| Kaempferol | 9.55 | - | 2,137,028 | - | - |
| Apigenin | 9.66 | - | 3,794,254 | - | - |
Discussion
The present phytochemical screening showed that
soursop leaves contained flavonoids, phenols and
steroids/triterpenoids. Hasmila et al (13), phytochemical screening of soursop
leaf ethanol extract showed the presence of steroids/triterpenoids,
alkaloids, flavonoids, phenols, and tannins. Qorina et al
(14) stated that ethanol extract
from soursop leaves contains flavonoids, steroids/triterpenoids,
alkaloids, glycosides and tannins. The compounds produced by plants
are influenced by various factors, including weather, soil, genetic
factors and environments (15).
The principle of extraction is ‘like dissolves
like’, showing that the compound will dissolve in a solvent with
the same polarity. Here, maceration was used to soften and destroy
plant cell walls to release phytochemical compounds that could
dissolve (16).
Antioxidant activity of extract may be affected by
extraction duration, crude drug:solvent ratio and solvent
concentration, as well as assessment method (17). Therefore, the present study used
three activity antioxidant assessment methods, namely DPPH, CUPRAC
and FRAP. Antioxidant activity was carried out by measuring the
reduction of the DPPH radical. DPPH free radical is purple in
color, and when it is reduced, it changes to yellow (18).
CUPRAC antioxidant test assesses ability of
antioxidant to convert Cu2+ to Cu+.
Neocuproine is a frequently used ligand in CUPRAC assays (11,12).
Cu2+-neocuproine complex is reduced by antioxidant to
Cu+-neocuproine, which is a chromophore with the maximum
absorbance at 450 nm (19).
Antioxidant activity was assessed by measuring the
reduction of the iron ion ligand complex (Fe3+) to
complex iron (Fe2+) using the FRAP method in acidic
conditions. This was conducted by measuring the increase in
absorbance at 593 nm (19).
The antioxidant activity showed a significant
correlation with AEAC: Higher AEAC was correlated with greater
antioxidant activity. Based on DPPH method, extract 7 with
extraction duration of 10 min, a crude drug:solvent ratio of 1:6.5,
and a solvent concentration of 96% ethanol showed the highest
antioxidant activity. According to Justino et al (20), soursop leaf ethanol extract has a
half-maximal inhibitory concentration of 28.1±4.4 µg/ml.
CUPRAC method showed that extract 2 had the highest
antioxidant activity. Orak et al (2017) showed that
antioxidant activity of soursop leaf methanol extract using the
CUPRAC method is 2.4 mmol Trolox/g extract, while 679 µM AE/g was
obtained in another investigation (21,22).
The FRAP method was used to test antioxidant
activity of different extracts. Extract 2 showed the highest
antioxidant activity. Orak et al (2017) stated that the
methanol extract of soursop leaf exhibits 789.9±2.4 mmol
Fe2+/g extract. Meanwhile, other investigations reported
that antioxidant activity assessed by FRAP for ethanol leaf extract
is 783.15 µM AE/g (21,22).
Extraction solvent significantly affected
antioxidant activity, assessed by DPPH, CUPRAC and FRAP methods.
These methods involve different mechanisms, leading to different
results. DPPH involves hydrogen transfer, while CUPRAC and FRAP
mechanisms are based on electron transfer (23).
Flavonoid compounds are the most abundant components
of soursop leaf extract (3). Phenol
and flavonoid compounds are typically the primary sources of
antioxidant activity in plants, with determination of TPC based on
the modified Pourmorad method (8).
This method entails a reduction-oxidation reaction between phenol
and Folin-Ciocalteu reagent in basic conditions. The addition of
sodium carbonate allows phenolic compounds to dissociate into
phenolic ions. Folin-Ciocalteu reagent facilitates conversion of
phenolic compounds into phenolic ions, initiating a reaction where
oxidized phenolic reduces heteropoly acid. This consists of
phosphotungstate acid and phosphomolybdate, which form a
blue-colored molybdenum-tungsten complex. The measurement of
molybdenum-tungsten is carried out using a UV-light
spectrophotometer with 765 nm wavelength (24).
TFC was measured using a modified version of the
method outlined by Chang et al (9). In this method, the absorbance of
flavonoid groups on samples was measured using a UV-light
spectrophotometer with 415 nm wavelength based on colorimetry. The
color formation reaction occurs due to aluminum chloride forming a
complex with the hydroxyl group at the C-3 and C-5 atoms, as well
as the carboxyl group at the C-4 atom, C-3' and C-4' (9).
In the TPC determination method, gallic acid was
dissolved in methanol and used as a reference solution. The largest
phenolic content was obtained in extract 7. Orak (21) showed that TPC value for methanol
soursop leaf extract is 244.61±7.00 mg catechin Equivalent/g).
Additionally, Nguyen et al (25) reported that TPC of soursop leaf
ethanol extract is 609.08±5.82 µg GAE/mg extract.
Flavonoid content for the ethanol extract of soursop
leaves showed that the highest value was obtained in extract 7.
Orak et al (21) similarly
obtained a flavonoid content of 81.32±3.45 mg QE/g.
TPC and TFC were used as response variables in the
regression analysis of the experimental design using the
Box-Behnken model. Flavonoids are classified as phenol when there
were hydroxyl groups on rings A and B in the structure. However,
flavonoid compounds with high methylation are not considered
phenols. A high content of flavonoid in extract does not guarantee
antioxidant activity (8). Flavonoid
shows high activity when hydroxyl groups are at C3' and C4' on ring
B, a hydroxyl group at C3, a ketone group at C4 and double bonds at
C2 and C3(26). DPPH test relies on
the scavenging of DPPH by antioxidant, which can donate hydrogen or
contain OH in their structure. In the CUPRAC and FRAP methods,
antioxidant converts Cu2+-neocuproine to
Cu+-neocuproine or Fe3+-TPTZ to
Fe2+-TPTZ. The E0 values for
Cu2+/Cu+-neocuproine and
Fe3/Fe2+-TPTZ are 0.60 and 0.77 V,
respectively. A compound exhibits antioxidant activity when it acts
as a reducer or has a lower E0 value than E0
Cu2+/Cu+-neocuproine and
Fe3+/Fe2+-TPTZ. This indicates
that E0 values of antioxidant must be lower than those
of Cu2+/Cu+-neocuproine (0.6V) and
Fe3/Fe2+-TPTZ (0.77V) to show reducing
ability (27). Moreover, there is a
tendency for extract to have low flavonoid content, not meeting the
criteria of flavonoids with high antioxidant capacity, resulting in
high antioxidant activity value when tested using DPPH, CUPRAC, or
FRAP methods (27).
Solvent concentration significantly influenced TFC
and DPPH response. Model suitability was evaluated with a lack of
fit test and correlation. Le Man et al (28) reported that surface response model
is considered suitable when R2>0.7. Regression model
activity antioxidant for TPC, TFC, DPPH and CUPRAC had
R2>70%, showing a good association between dependent
variable and response. However, the regression model for FRAP
showed R2 value of 56.8%, suggesting that variation in
response was not properly explained by dependent variable. This
discrepancy may be attributed to potential interference in the
absorbance measurement (29),
leading to variations in response. The lack of significant
difference in the fit test showed that the regression and surface
response model (P-value >0.05) was able to predict antioxidant
compounds in soursop leaf extract (30).
The efficiency of extraction is improved by
controlling extraction duration. Based on optimization, the highest
antioxidant activity was observed at extraction of 10 min. Previous
research on soursop leaf using microwave-assisted extraction
obtained an optimal antioxidant activity at 9.84 min (31). Initially, extraction efficiency
increases with duration. When solute equilibrium is reached inside
and outside the cell, increasing extraction time does not have an
impact (32). The present study
suggested solute equilibrium was reached at 10 min.
Another parameter used to increase extraction
efficiency is the crude drug:solvent ratio. At a ratio of 1:6.5,
optimal antioxidant activity was obtained, as indicated by TFC,
DPPH, CUPRAC and FRAP Increasing the ratio leads to a higher
extraction yield. However, a higher ratio could cause excessive
solvent extraction, requiring a longer concentration time (32).
The concentration of solvent affects efficiency of
extraction. Zhang et al (32) reported that solvent with polarity
values similar to the solute, based on the law of solubility,
generally show improved performance. Ethanol concentrations ranging
from 70 to 96% are as a universal solvent due to the ability to
extract polar and non-polar compounds (33). Here, an ethanol concentration of 96%
produced the maximum antioxidant activity. This showed that
antioxidant compounds contained in soursop leaf crude drug were
more soluble in 96% ethanol (lower polarity) compared with 70%
ethanol (higher polarity).
The error obtained from each response theoretically
was <25%. This suggested that results were good and value
predictions could describe the actual condition (34). Therefore, the result between actual
and theoretical response based on optimization using RSM with
Box-Behnken model could be reproduced.
Correlation analysis between TPC and TFC of soursop
leaf extract regarding DPPH, CUPRAC and FRAP was performed.
According to Schober et al (35), Pearson correlation coefficient of
0.90-1.00 denotes very strong, 0.70-0.89 strong, 0.40-0.69
moderate, 0.10-0.39 weak and 0.00-0.10 negligible correlation. TPC
and TFC were positively correlated with antioxidant activity. TPC
consistently showed a very strong or strong correlation with
antioxidant activity assessed by DPPH, CUPRAC and FRAP. This
suggested that phenol and flavonoid groups contributed to
antioxidant activity assessed by DPPH, CUPRAC and FRAP. According
to previous research, TPC and TFC of soursop leaf ethanol extract
show moderate correlation with antioxidant activity of CUPRAC, with
values of 0.589 and 0.646, respectively. Soursop leaf extract also
has strong and very strong correlations with FRAP, at values of
0.899 and 0.900, respectively (21).
Additionally, the correlation between DPPH and
CUPRAC as well as DPPH and FRAP was strong, showing a linear
antioxidant activity. Although the correlation between CUPRAC and
FRAP was moderate, it could still be considered linear.
Optimal conditions were extraction duration of 10
min, crude drug:solvent ratio of 1:6.5, and a solvent concentration
of 96%. The optimized extract was analyzed for flavonoid compound
levels using HPLC method. The most common flavonoid in soursop
plants is quercetin, although leaf extract contains rutin,
quercetin, and kaempferol (3). In
the genus Annona, the most common flavonoids are
kaempferol-3-O-galactoside, luteolin-7-O-glucoside,
quercetin-3-O-rhamnoside and their derivatives (36).
Balderrama-Carmona et al (37) used acidified ethanol extract from
soursop leaves and ultra-performance liquid chromatography and
reported rutin levels of 6.52±0.59 mg/g. The differences in results
could be attributed to variation in extraction process and methods.
In conclusion, extraction process using the maceration method to
obtain optimal antioxidant activity can be optimized using Response
Surface Methodology. Optimization analysis using the Box-Behnken
method showed that the optimum extraction of soursop leaves through
maceration and pressing was achieved with an extraction time of 10
min, a crude drug-solvent ratio of 1:6.5, and a solvent
concentration of 96%. This optimal extraction yielded total phenol,
total flavonoid, DPPH, CUPRAC, and FRAP. In general, phenols and
flavonoids contribute to the antioxidant activity of DPPH, CUPRAC
and FRAP.
Acknowledgements
The authors would like to thank the School of
Pharmacy at Bandung Institute of Technology (Bandung, Indonesia)
for providing the facilities to perform this research.
Funding
Funding: The present study was supported by the Institute for
Research and Community Service, Bandung Institute of Technology
(Penelitian, Pengabdian Masyarakat, dan Inovasi 2024 grant no.
31/IT1.C10/SK-KU/2024).
Availability of data and materials
The data generated in the present study may be
requested from the corresponding author.
Authors' contributions
FMR performed experiments, analyzed and interpreted
data and wrote the manuscript. IF conceived and designed the study.
IF, RH and HP analyzed and interpreted data and revised the
manuscript. IF and RH confirm the authenticity of all the raw data.
All authors have read and approved the final manuscript.
Ethics approval and consent to
participate
Not applicable.
Patient consent for publication
Not applicable.
Competing interests
The authors declare that they have no competing
interests.
References
|
1
|
Christodoulou MC, Orellana Palacios JC,
Hesami G, Jafarzadeh S, Lorenzo JM, Domínguez R, Moreno A and
Hadidi M: Spectrophotometric methods for measurement of antioxidant
activity in food and pharmaceuticals. Antioxidants (Basel).
11(2213)2022.PubMed/NCBI View Article : Google Scholar
|
|
2
|
Pham TN, Lam TD, Nguyen MT, Le XT, Vo DVN,
Toan TQ and Vo TS: Effect of various factors on extraction
efficiency of total anthocyanins from butterfly pea (Clitoria
ternatea L. Flowers) in Southern Vietnam. IOP Conf Ser Mater
Sci Eng. 544(012013)2019.
|
|
3
|
Mutakin M, Fauziati R, Fadhilah FN,
Zuhrotun A, Amalia R and Hadisaputri YE: Pharmacological activities
of soursop (Annona muricata Lin.). Molecules.
27(2701)2022.PubMed/NCBI View Article : Google Scholar
|
|
4
|
Kim J, Kim DG and Ryu KH: Enhancing
response surface methodology through coefficient clipping based on
prior knowledge. Processes. 11(3392)2023.
|
|
5
|
Pereira LMS, Milan TM and Tapia-Blácido
DRT: Using response surface methodology (RSM) to optimize 2G
bioethanol production: A review. Biomass Bioenergy.
151(106166)2021.
|
|
6
|
Farnsworth NR: Biological and
phytochemical screening of plants. J Pharm Sci. 55:225–276.
1966.PubMed/NCBI View Article : Google Scholar
|
|
7
|
Rowe RC, Shesky PJ and Quinn ME: Handbook
of pharmaceutical excipients. 6th edition. Pharmaceutical Press,
pp506-509, 2009.
|
|
8
|
Pourmorad F, Hosseinimehr SJ and
Shahabimajd N: Antioxidant activity, phenol and flavonoid contents
of some selected Iranian medicinal plants. Afr J Biotechnol.
5:1142–1145. 2006.
|
|
9
|
Chang CC, Yang MH, Wen HM and Chern JC:
Estimation of total flavonoid content in propolis by two
complementary colorimetric methods. J Food Drug Anal. 10:178–182.
2002.
|
|
10
|
Celep E, Charehsaz M, Akyüz S, Acar ET and
Yesilada E: Effect of in vitro gastrointestinal digestion on the
bioavailability of phenolic components and the antioxidant
potentials of some Turkish fruit wines. Food Res Int. 78:209–215.
2015.PubMed/NCBI View Article : Google Scholar
|
|
11
|
Özyürek M, Bektaşoǧlu B, Güçlü K, Güngör N
and Apak R: Simultaneous total antioxidant capacity assay of
lipophilic and hydrophilic antioxidants in the same acetone-water
solution containing 2% methyl-beta-cyclodextrin using the cupric
reducing antioxidant capacity (CUPRAC) method. Anal Chim Acta.
630:28–39. 2008.PubMed/NCBI View Article : Google Scholar
|
|
12
|
Insanu M, Zahra AA, Sabila N, Silviani V,
Haniffadli A, Rizaldy D and Fidrianny I: Phytochemical and
antioxidant profile: Cucumber pulp and leaves extracts. Open Access
Maced J Med Sci. 10:616–622. 2022.
|
|
13
|
Hasmila I, Natsir H and Soekamto NH:
Phytochemical analysis and antioxidant activity of soursop leaves
extract (Annona muricata Linn.). J Phys Conf Ser.
1341(032027)2019.
|
|
14
|
Qorina F, Arsianti A, Fithrotunnisa Q and
Tejaputri NA: Phytochemistry and antioxidant activity of soursop
(Annona muricata) leaves. Int J Appl Pharm. 11:1–6.
2019.
|
|
15
|
Lee DH, Son YH, Jang JH, Lee SY and Kim
HJ: The growth characteristics and the active compounds of
Cudrania tricuspidata fruits in different cultivation
environments in South Korea. Plants (Basel).
12(2107)2023.PubMed/NCBI View Article : Google Scholar
|
|
16
|
Rashid S, Majeed LR, Nisar B, Nisar H,
Bhat AA and Ganai BA: Phytomedicines: Diversity, extraction, and
conservation strategies. In: Bhat RA, Hakeem KR and Dervash MA
(eds), Phytomedicine: A treasure of pharmacologically active
products from plants. Academic Press, Cambridge, MA, pp1-33,
2021.
|
|
17
|
Siddeeg A, AlKehayez NM, Abu-Hiamed HA,
Al-Sanea EA and Al-Farga AM: Mode of action and determination of
antioxidant activity in the dietary sources: An overview. Saudi J
Biol Sci. 28:1633–1644. 2021.PubMed/NCBI View Article : Google Scholar
|
|
18
|
Shekhar TC and Anju G: Antioxidant
activity by DPPH radical scavenging method of Ageratum
conyzoides Linn leaves. Am J Ethnomed. 1:244–249. 2014.
|
|
19
|
Shahidi F and Zhong Y: Measurement of
antioxidant activity. J Funct Foods. 18:757–781. 2015.
|
|
20
|
Justino AB, Miranda NC, Franco RR, Martins
MMD, Silva NM and Espindola FS: Annona muricata Linn. leaf
as a source of antioxidant compounds with in vitro antidiabetic and
inhibitory potential against α-amylase, α-glucosidase, lipase,
non-enzymatic glycation and lipid peroxidation. Biomed
Pharmacother. 100:83–92. 2018.PubMed/NCBI View Article : Google Scholar
|
|
21
|
Orak HH, Bahrisefit IS and Sabudak T:
Antioxidant activity of extracts of soursop (Annona
murricata L.) leaves, fruit pulps, peels, and seeds. Pol J Food
Nutr Sci. 69:359–366. 2019.
|
|
22
|
Aguilar-Villalva R, Molina GA,
España-Sánchez BL, Díaz-Peña LF, Elizalde-Mata A, Valerio E,
Azanza-Ricardo C and Estevez M: Antioxidant capacity and
antibacterial activity from Annona cherimola phytochemicals
by ultrasound-assisted extraction and its comparison to
conventional methods. Arab J Chem. 14(103239)2021.
|
|
23
|
Munteanu IG and Apetrei C: Analytical
methods used in determining antioxidant activity: A Review. Int J
Mol Sci. 22(3380)2021.PubMed/NCBI View Article : Google Scholar
|
|
24
|
Martono Y, Yanuarsih FF, Aminu NR and
Muninggar J: Fractionation and determination of phenolic and
flavonoid compound from Moringa oleifera leaves. J Phys Conf
Ser. 1307(012014)2019.
|
|
25
|
Nguyen MT, Nguyen VT, Minh LV, Trieu LH,
Cang MH, Bui LB, Le XT and Danh VT: Determination of the
phytochemical screening, total polyphenols, flavonoids content, and
antioxidant activity of soursop leaves (Annona muricata
Linn.). IOP Conf Ser Mater Sci Eng. 736(062011)2020.
|
|
26
|
Vo QV, Nam PC, Thong NM, Trung NT, Phan CD
and Mechler A: Antioxidant motifs in flavonoids: O-H versus C-H
bond dissociation. ACS Omega. 4:8935–8942. 2019.PubMed/NCBI View Article : Google Scholar
|
|
27
|
Gupta D: Methods for determination of
antioxidant capacity: A review. Int J Pharm Sci Res. 6:546–566.
2015.
|
|
28
|
Le Man H, Behera SK and Park HS:
Optimization of operational parameters for ethanol production from
Korean food waste leachate. Int J Environ Sci Technol. 7:157–164.
2010.
|
|
29
|
Echegaray N, Pateiro M, Munekata PES,
Lorenzo JM, Chabani Z, Farag MA and Domínguez R: Measurement of
antioxidant capacity of meat and meat products: Methods and
applications. Molecules. 26(3880)2021.PubMed/NCBI View Article : Google Scholar
|
|
30
|
Loan LTK, Thuy NM and Van Tai N:
Ultrasound-assisted extraction of antioxidant compounds from ‘Cẩm’
purple rice bran for modulation of starch digestion. Int J Food
Sci. 2023(1086185)2023.PubMed/NCBI View Article : Google Scholar
|
|
31
|
Aulia LP: Optimization of the soursop
leaves extraction process (Annona muricata L.) using the MAE
(microwave assisted extraction) method with the response of
antioxidant activity and total phenols. J Agroindustri Halal.
4:079–087. 2018.
|
|
32
|
Zhang QW, Lin LG and Ye WC: Techniques for
extraction and isolation of natural products: A comprehensive
review. Chin Med. 13(20)2018.PubMed/NCBI View Article : Google Scholar
|
|
33
|
Tambun R, Alexander V and Ginting Y:
Performance comparison of maceration method, soxhletation method,
and microwave-assisted extraction in extracting active compounds
from soursop leaves (Annona muricata): A review. IOP Conf
Ser Mater Sci Eng. 1122(012095)2021.
|
|
34
|
Moreno JJM, Pol AP, Abad AS and Blasco BC:
Using the R-MAPE index as a resistant measure of forecast accuracy.
Psicothema. 25:500–506. 2013.PubMed/NCBI View Article : Google Scholar
|
|
35
|
Schober P, Boer C and Schwarte LA:
Correlation coefficients: Appropriate use and interpretation.
Anesth Analg. 126:1763–1768. 2018.PubMed/NCBI View Article : Google Scholar
|
|
36
|
Ramos ALCC, Mazzinghy ACDC, Correia VTDV,
Nunes BV, Ribeiro LV, Silva VDM, Weichert RF, Paula ACCFF, Sousa
IMN, Ferreira RMSB, et al: An integrative approach to the flavonoid
profile in some plants' parts of the Annona genus. Plants
(Basel). 11(2855)2022.PubMed/NCBI View Article : Google Scholar
|
|
37
|
Balderrama-Carmona AP, Silva-Beltrán NP,
Gálvez-Ruiz JC, Ruíz-Cruz S, Chaidez-Quiroz C and Morán-Palacio EF:
Antiviral, antioxidant, and antihemolytic effect of Annona
muricata L. leaves extracts. Plants (Basel).
9(1650)2020.PubMed/NCBI View Article : Google Scholar
|