Introduction
Kawasaki disease (KD; also termed mucocutaneous
lymph node syndrome) is an acute febrile illness that primarily
occurs in 6-month to 5-year-old children. KD is characterized by
systemic non-specific vasculitis as the main pathological change
(1) and mainly affects the skin,
mucous membranes, blood vessels and lymph nodes. If not treated in
time, KD-associated acute vasculitis may progress to coronary
artery lesions, which manifest as coronary artery dilation and
stenosis, and can lead to coronary artery aneurysm (CAA),
myocardial infarction, thrombotic occlusion and sudden death
(2,3). CAA occurs in ~25% of children with KD
who do not receive timely intervention (4). Moreover, patients with KD who have
giant CAAs are predisposed to developing ischemic heart disease
(5). In recent years, the incidence
of KD has been increasing, and KD has become a common cause of
childhood acquired heart disease in developed countries (6,7).
Although >50 years have passed since it was first
reported, the etiology of KD remains unclear and the pathological
mechanism underlying KD is not well defined. Genetically
susceptible individuals become prone to KD when they encounter
stimuli from infectious agents and environmental factors that
trigger an abnormal immune response in the body (8-10).
The preferred treatment for KD involves intravenous immunoglobulin
(IVIG) combined with high-dose aspirin administration, and early
diagnosis and timely IVIG therapy can reduce the risk of CAA from
25 to 4% (4). Although the
incidence of CAA has been greatly reduced, 4% of patients still
endure severe sequelae; therefore, it is particularly important to
clarify the pathogenesis of this disease and to facilitate early
diagnosis and effective treatment. In the absence of precise
diagnostic markers, the diagnosis of KD is mainly based on clinical
manifestations (11). However, the
clinical symptoms of this disease resemble those of other febrile
illnesses, which can result in delayed diagnosis or a misdiagnosis
(12). If left untreated,
CAA-related sequelae may have serious long-term effects on
patients. Therefore, it is essential to develop a set of accurate
and sensitive laboratory diagnostic markers to assist physicians in
the early detection and diagnosis of KD. Moreover, timely treatment
can improve the response to IVIG therapy and reduce the incidence
of coronary artery injury.
Ferroptosis, a newly discovered iron-dependent form
of programmed cell death, is characterized by iron-induced lipid
peroxidation and the accumulation of lipophilic reactive oxygen
species. The mechanism and regulation of ferroptosis differ from
those of cell autophagy, necrosis, apoptosis and other traditional
modes of cell death (13,14). Ferroptosis is mainly associated with
a variety of physiological and pathological processes, including
degenerative disease, infectious disease, coronary artery disease,
myocardial injury, kidney damage and sepsis-induced lung injury
(15-17).
A recent study revealed that serum ferritin could be used to
diagnose and predict IVIG resistance in patients with KD (18); however, few studies have assessed
the role of ferroptosis-related genes (FRGs) in the diagnosis and
progression of KD.
Therefore, in the present study, an integrative
bioinformatics approach was used to investigate the role of FRGs in
predicting KD by systematically analyzing transcriptome sequencing
data from online databases. The findings were then validated using
clinical samples. It is expected that these FRGs will serve as
biomarkers for the early diagnosis of KD and provide new insights
into the pathogenesis of this disease.
Materials and methods
Data collection
In total, three microarray KD gene expression
datasets and the corresponding clinical sample information were
collected from the Gene Expression Omnibus database (http://www.ncbi.nlm.nih.gov/geo/). The GSE73461
dataset (19) was generated based
on the GPL10558 platform using 55 normal samples and 77 KD samples.
The GSE68004 dataset (GPL10558 platform) contained 76 KD samples
and 37 healthy control samples (20). The samples in the GSE73461 and
GSE68004 datasets were selected as the training set. The 20 KD
samples and 9 normal samples in the GSE18606 dataset (processed on
the GPL6480 platform) were used as the independent validation set
(21). The training set was used
for model construction and marker gene discovery, whereas the
validation set was mainly used for marker gene assessment and
validation. Inclusion criteria were patients diagnosed with KD who
were not treated with IVIG and with complete corresponding
transcriptomic information in the dataset. Exclusion criteria were
patients with other serious complications that could affect gene
expression, such as definite bacterial infections, viral infections
and inflammatory diseases. In addition, FRGs were collected from
the FerrDb database, and the 259 FRGs are listed in Table SI. In the present study, the Drug
Gene Interaction Database (DGIdb; https://www.dgidb.org/) was used to predict drugs that
may target these ferroptosis-related markers, and the interaction
network was visualized via Cytoscape software (version 3.7.2;
https://cytoscape.org/).
Selection of differentially
expressed-FRGs (DE-FRGs)
The limma package in R (version 3.48.3; http://bioinf.wehi.edu.au/limma) was applied to
screen differentially expressed genes (DEGs) between healthy
individuals and patients with KD in the GSE73461 and GSE68004
datasets. |log [fold change]|≥1 and adjusted P-values (adj. P)
<0.05 were set as the screening threshold. A Venn diagram
(http://jvenn.toulouse.inra.fr/app/)
was then used to display the intersection of the DEGs and FRGs.
Furthermore, unsupervised hierarchal clustering analysis of samples
based on the expression pattern of selected differentially
expressed-FRGs (DE-FRGs) was conducted using the heatmap package
(https://hiplot.com.cn/basic/heatmap).
Least absolute shrinkage and selection
operator (LASSO) regression and receiver operating characteristic
(ROC) analysis
To identify the optimal gene biomarkers for KD, the
binomial LASSO regression model, constructed using the glmnet
package in R (version 4.1), was applied to build an optimal model
with the fewest genes. The penalty parameters (best λ values) were
obtained by 10-fold cross-validation with binomial deviance. Based
on the optimal λ value, a list of candidate ferroptosis-related
markers (named marker genes) for KD was obtained by modifying this
model. Then, a logistic regression model, which was built based on
6 ferroptosis-related markers, combined with ROC analysis was used
to evaluate the ability of these markers to distinguish patients
with KD from healthy controls.
Gene Set Variation Analysis
(GSVA)
GSVA can convert gene-level expression data into a
pathway-level expression matrix and is used to investigate the
changes in biological processes and signaling pathways in different
samples. In the present study, the samples from the GSE73461
dataset were divided into the high-expression and low-expression
groups according to the expression level of each marker gene. Then,
GSVA was conducted using the GSVA package in R to analyze the
differences in pathway activation between the high-expression and
low-expression groups. The background gene set,
‘c2.kegg.v7.4.symbols’, used in the GSVA package was downloaded
from MSigDB (https://www.gsea-msigdb.org/gsea/msigdb). The
screening criteria were T-value >2 and P<0.05. Only the top
60 enriched signaling pathways were listed.
Immune cell infiltration analysis
Gene expression data from the GSE73461 and GSE68004
datasets were used to evaluate the immune cell infiltration
profiles between patients with KD and healthy individuals. There
are several methods for immune infiltration analysis, but their
applicability and output results vary in a specific field context.
These commonly used methods, ESITMATE, MCP-counter and TIMER,
cannot be used to compare the abundance of different cell types in
the same sample and are more suitable for analyzing the tumor
immune microenvironment. CIBERSORT is able to infer the proportion
of different immune cell types in the same sample using
transcriptomic data. This meets the needs of the present study.
Therefore, the scores of 22 immune cell types were calculated using
CIBERSORT to assess the levels of the infiltrating immune cell
types between the two groups. CIBERSORT is a deconvolution
algorithm that estimates the proportions of specific cell types
based on gene expression levels (22). Not all 22 immune cell types could be
estimated from the KD datasets; thus, only 18 types were listed in
the present study. The correlations between the expression levels
of marker genes and the levels of different immune cell types were
then analyzed using Pearson's correlation analysis. In addition,
the expression levels of immune checkpoint genes between the
controls and patients with KD were analyzed, and the correlation
between marker genes and immune checkpoint genes were explored
using Pearson's correlation analysis.
Clinical sample collection
All peripheral blood samples were obtained from
Shenzhen Baoan Women's and Children's Hospital of Jinan University
(Shenzhen, China), which included 22 samples from patients with KD
and 25 from healthy controls. The age range of the patients was
from a minimum of 3 months and 14 days to a maximum of 6 years and
9 months. The average age was 2 years, 5 months and 10 days. These
blood samples were used to validate the diagnostic performance of
the candidate marker genes. The study procedure was approved
(approval no. LLSC-2023-03-09-04-KS) by the Medical Ethics
Committee of Shenzhen Baoan Women's and Children's Hospital of
Jinan University (Shenzhen, China). Informed consent was acquired
from the participants' legal guardian. Validation of marker gene
expression was conducted using reverse transcription-quantitative
PCR (RT-qPCR).
Cell culture and lipopolysaccharide
(LPS) stimulation
Human umbilical vein endothelial cells (HUVECs; cat.
no. 8000; ScienCell Research Laboratories, Inc.) were cultured in
endothelial cell medium (cat. no. 1001; ScienCell Research
Laboratories, Inc.) at 37˚C under an atmosphere with 5%
CO2. Endothelial cell cultures at passages 5 or 6 were
used in all experiments. After reaching confluency, HUVECs were
treated with LPS at a final concentration of 1 µg/ml for 2 h. The
cells were then harvested and total RNA was isolated using the
FastPure Total RNA Isolation Kit (cat. no. RC112; Vazyme Biotech
Co., Ltd.) according to the manufacturer's protocol. The cell
experiments regarding HUVECs purchased in the present study were
approved (approval no. LLSC-2024-03-10-25-KS) by the Medical Ethics
Committee of Shenzhen Baoan Women's and Children's Hospital of
Jinan University (Shenzhen, China).
RT-qPCR
Total RNA from the peripheral blood samples was
isolated using the EasyPure Blood RNA Kit (cat. no. ER401-01;
TransGen Biotech Co., Ltd.) following the manufacturer's protocol.
A NanoDrop One Microvolume UV-Vis spectrophotometer (Thermo Fisher
Scientific, Inc.) was then used to assess the RNA purity
(OD260/OD280 >1.9) and concentration. Total RNA from the blood
and HUVEC samples was used for cDNA synthesis using
HiScript® III All-in-one RT SuperMix (cat. no. R333;
Vazyme Biotech Co., Ltd.) according to the manufacturer's
protocols. qPCR was then performed in an ABI 7500 real-time PCR
machine (Applied Biosystems; Thermo Fisher Scientific, Inc.) using
Taq Pro Universal SYBR qPCR Master Mix (cat. no. Q712; Vazyme
Biotech Co., Ltd.). The primer sequences are listed in Table I. The PCR cycling protocol was as
follows: 95˚C for 30 sec, then 40 cycles of a 2-step amplification
at 95˚C for 15 sec and 60˚C for 30 sec. Gene expression was
normalized to the expression of the internal reference gene
(GAPDH), obtaining the ΔCq value. The mRNA levels of the candidate
markers relative to GAPDH were calculated by the 2-ΔΔCq
method (23).
 | Table IPrimer sequence of the candidate
markers. |
Table I
Primer sequence of the candidate
markers.
| Gene name | Primer sequence
(5'-3') |
|---|
| EPAS1 | F:
CTGTGTCTGAGAAGAGTAACTTCC |
| | R:
TTGCCATAGGCTGAGGACTCCT |
| MAPK14 | F:
GAGCGTTACCAGAACCTGTCTC |
| | R:
AGTAACCGCAGTTCTCTGTAGGT |
| SLC2A3 | F:
TGCCTTTGGCACTCTCAACCAG |
| | R:
GCCATAGCTCTTCAGACCCAAG |
| PGD | F:
GTTCCAAGACACCGATGGCAAAC |
| | R:
CACCGAGCAAAGACAGCTTCTC |
| SAT1 | F:
TACCACTGCCTGGTTGCAGAAG |
| | R:
CTTGCCAATCCACGGGTCATAG |
| TLR4 | F:
CCCTGAGGCATTTAGGCAGCTA |
| | R:
AGGTAGAGAGGTGGCTTAGGCT |
| GAPDH | F:
GTCTCCTCTGACTTCAACAGCG |
| | R:
ACCACCCTGTTGCTGTAGCCAA |
Statistical analysis
The sensitivity and specificity of the diagnostic
performance of each marker gene in KD vs. the controls were
calculated using the ROC analysis and area under the curve (AUC)
values. The comparison of gene expression and immune cell
infiltration between the healthy controls and patients with KD was
performed using an unpaired Student's t-test. P<0.05 was
considered to indicate a statistically significant difference. All
statistical analyses were conducted using GraphPad Prism Software
(version 7.03; Dotmatics).
Results
Selection of DE-FRGs in patients with
KD
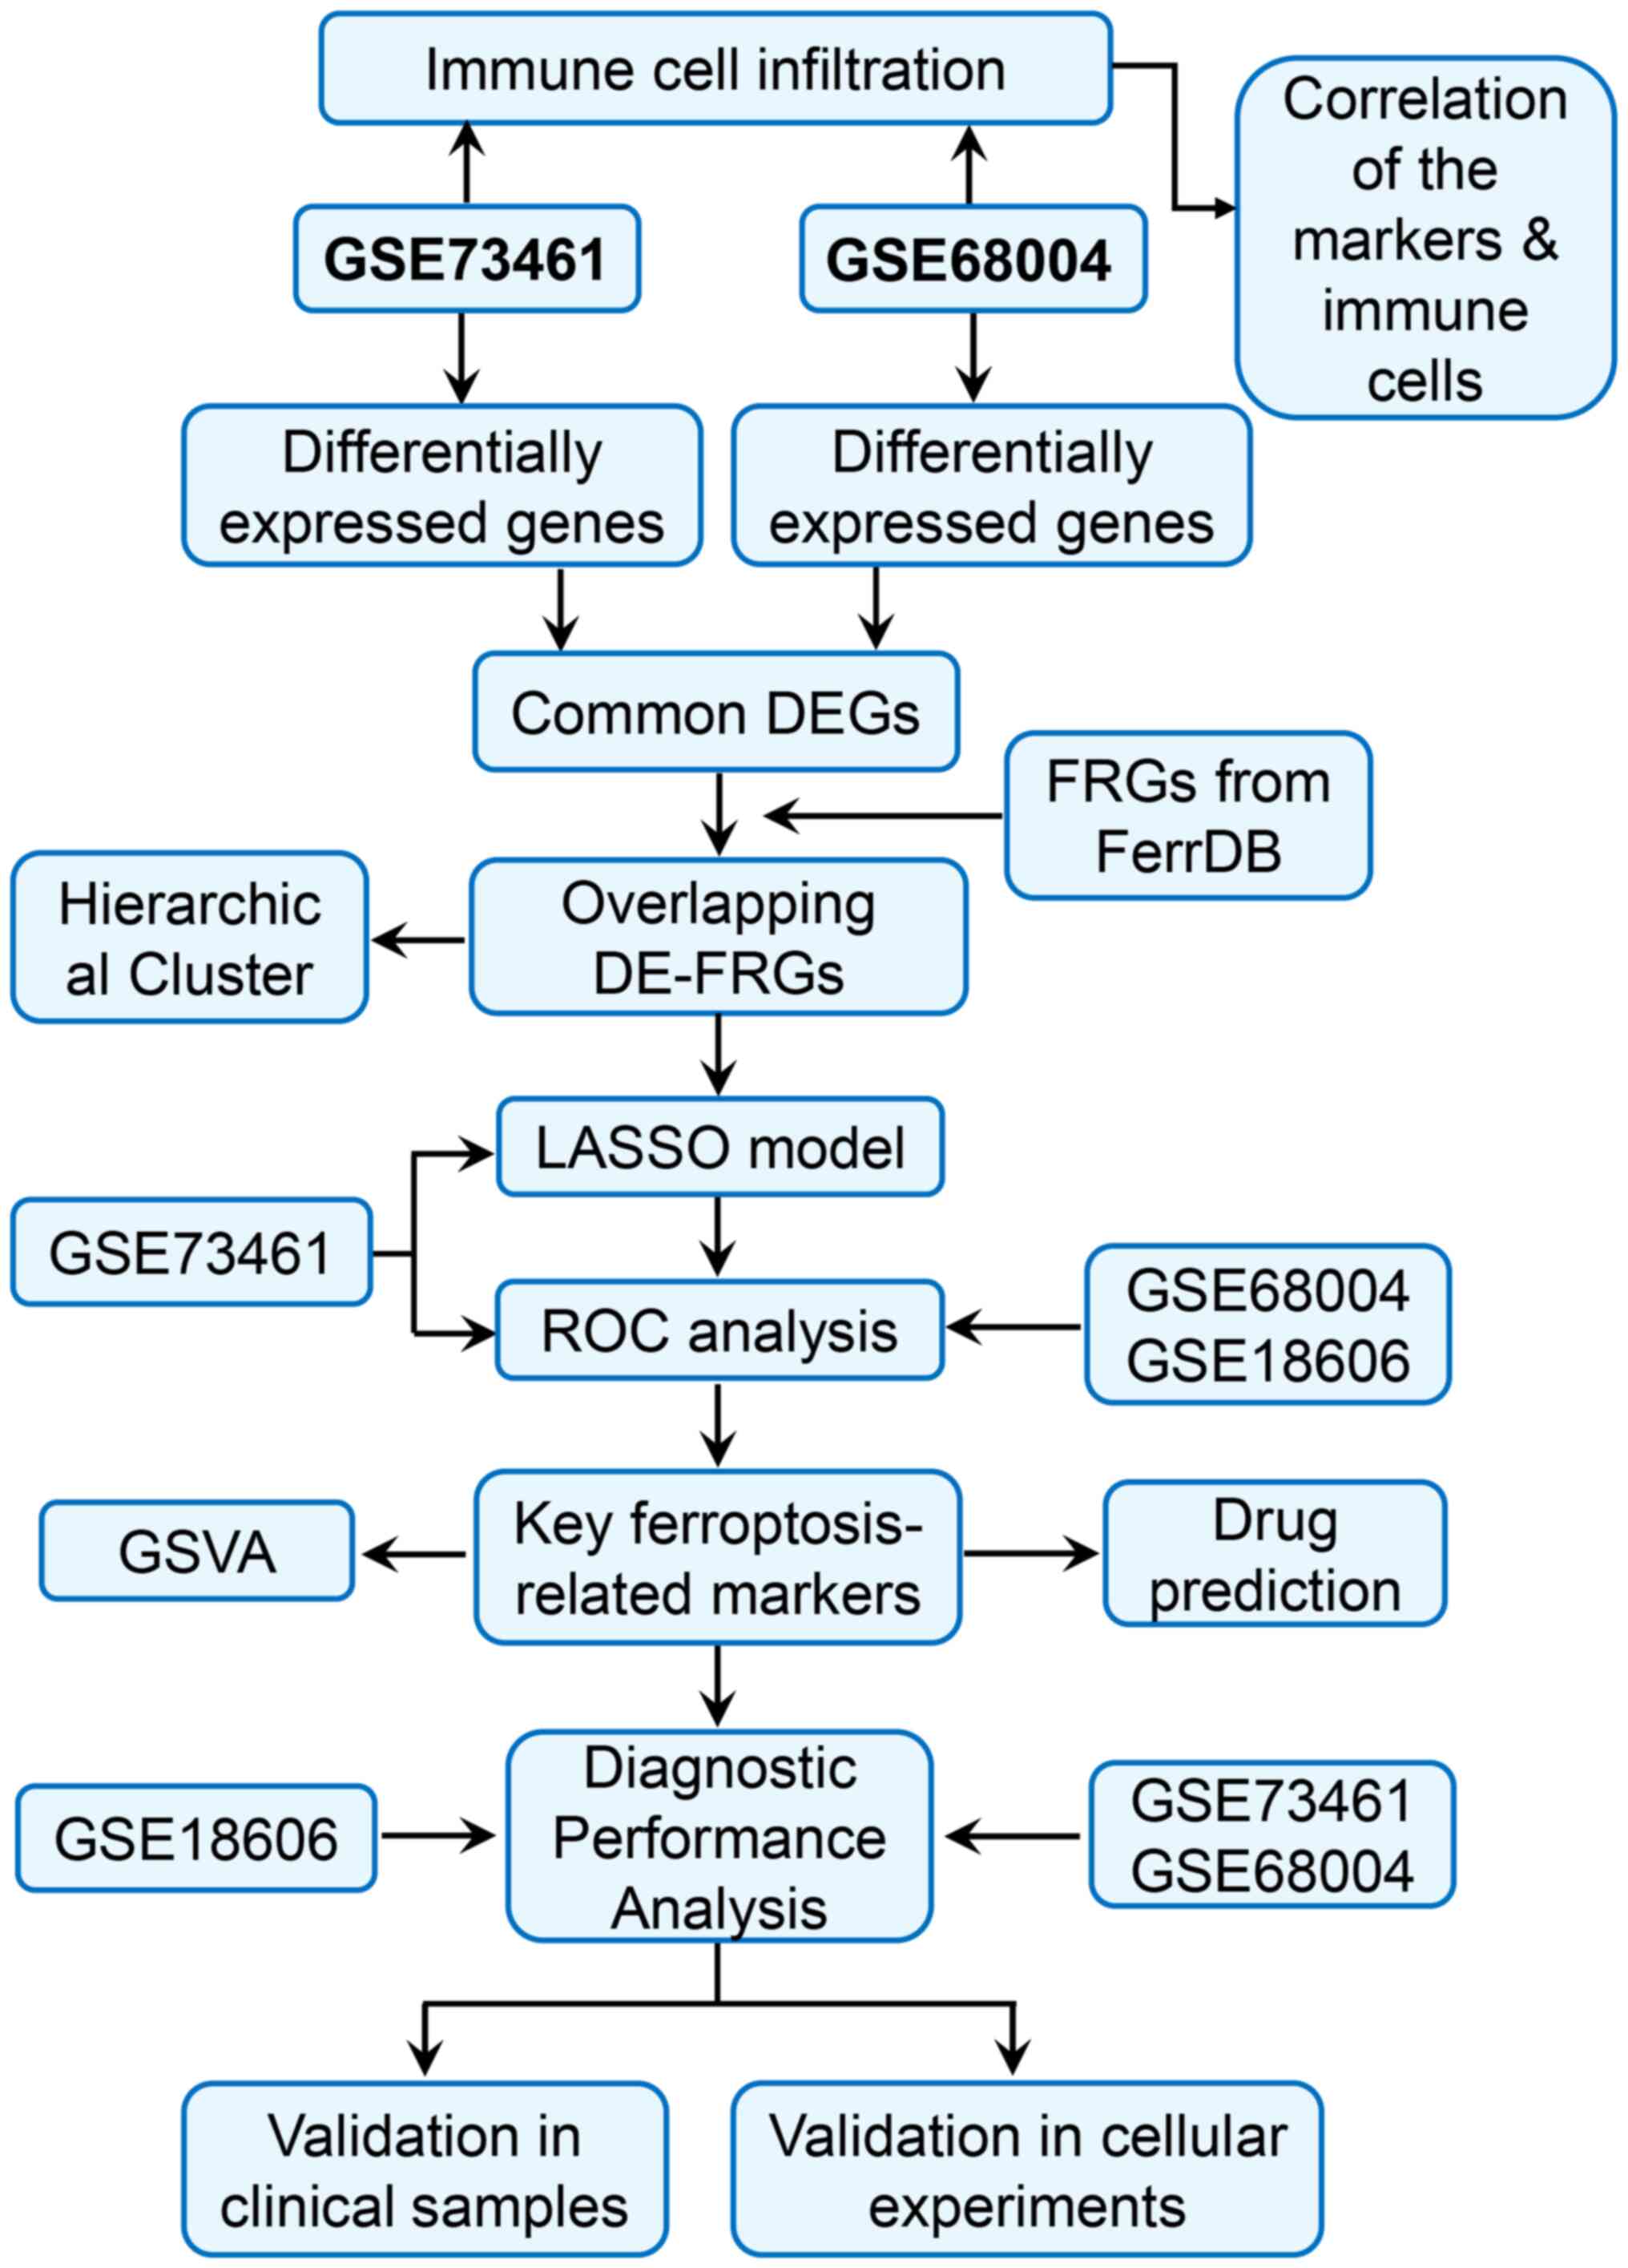
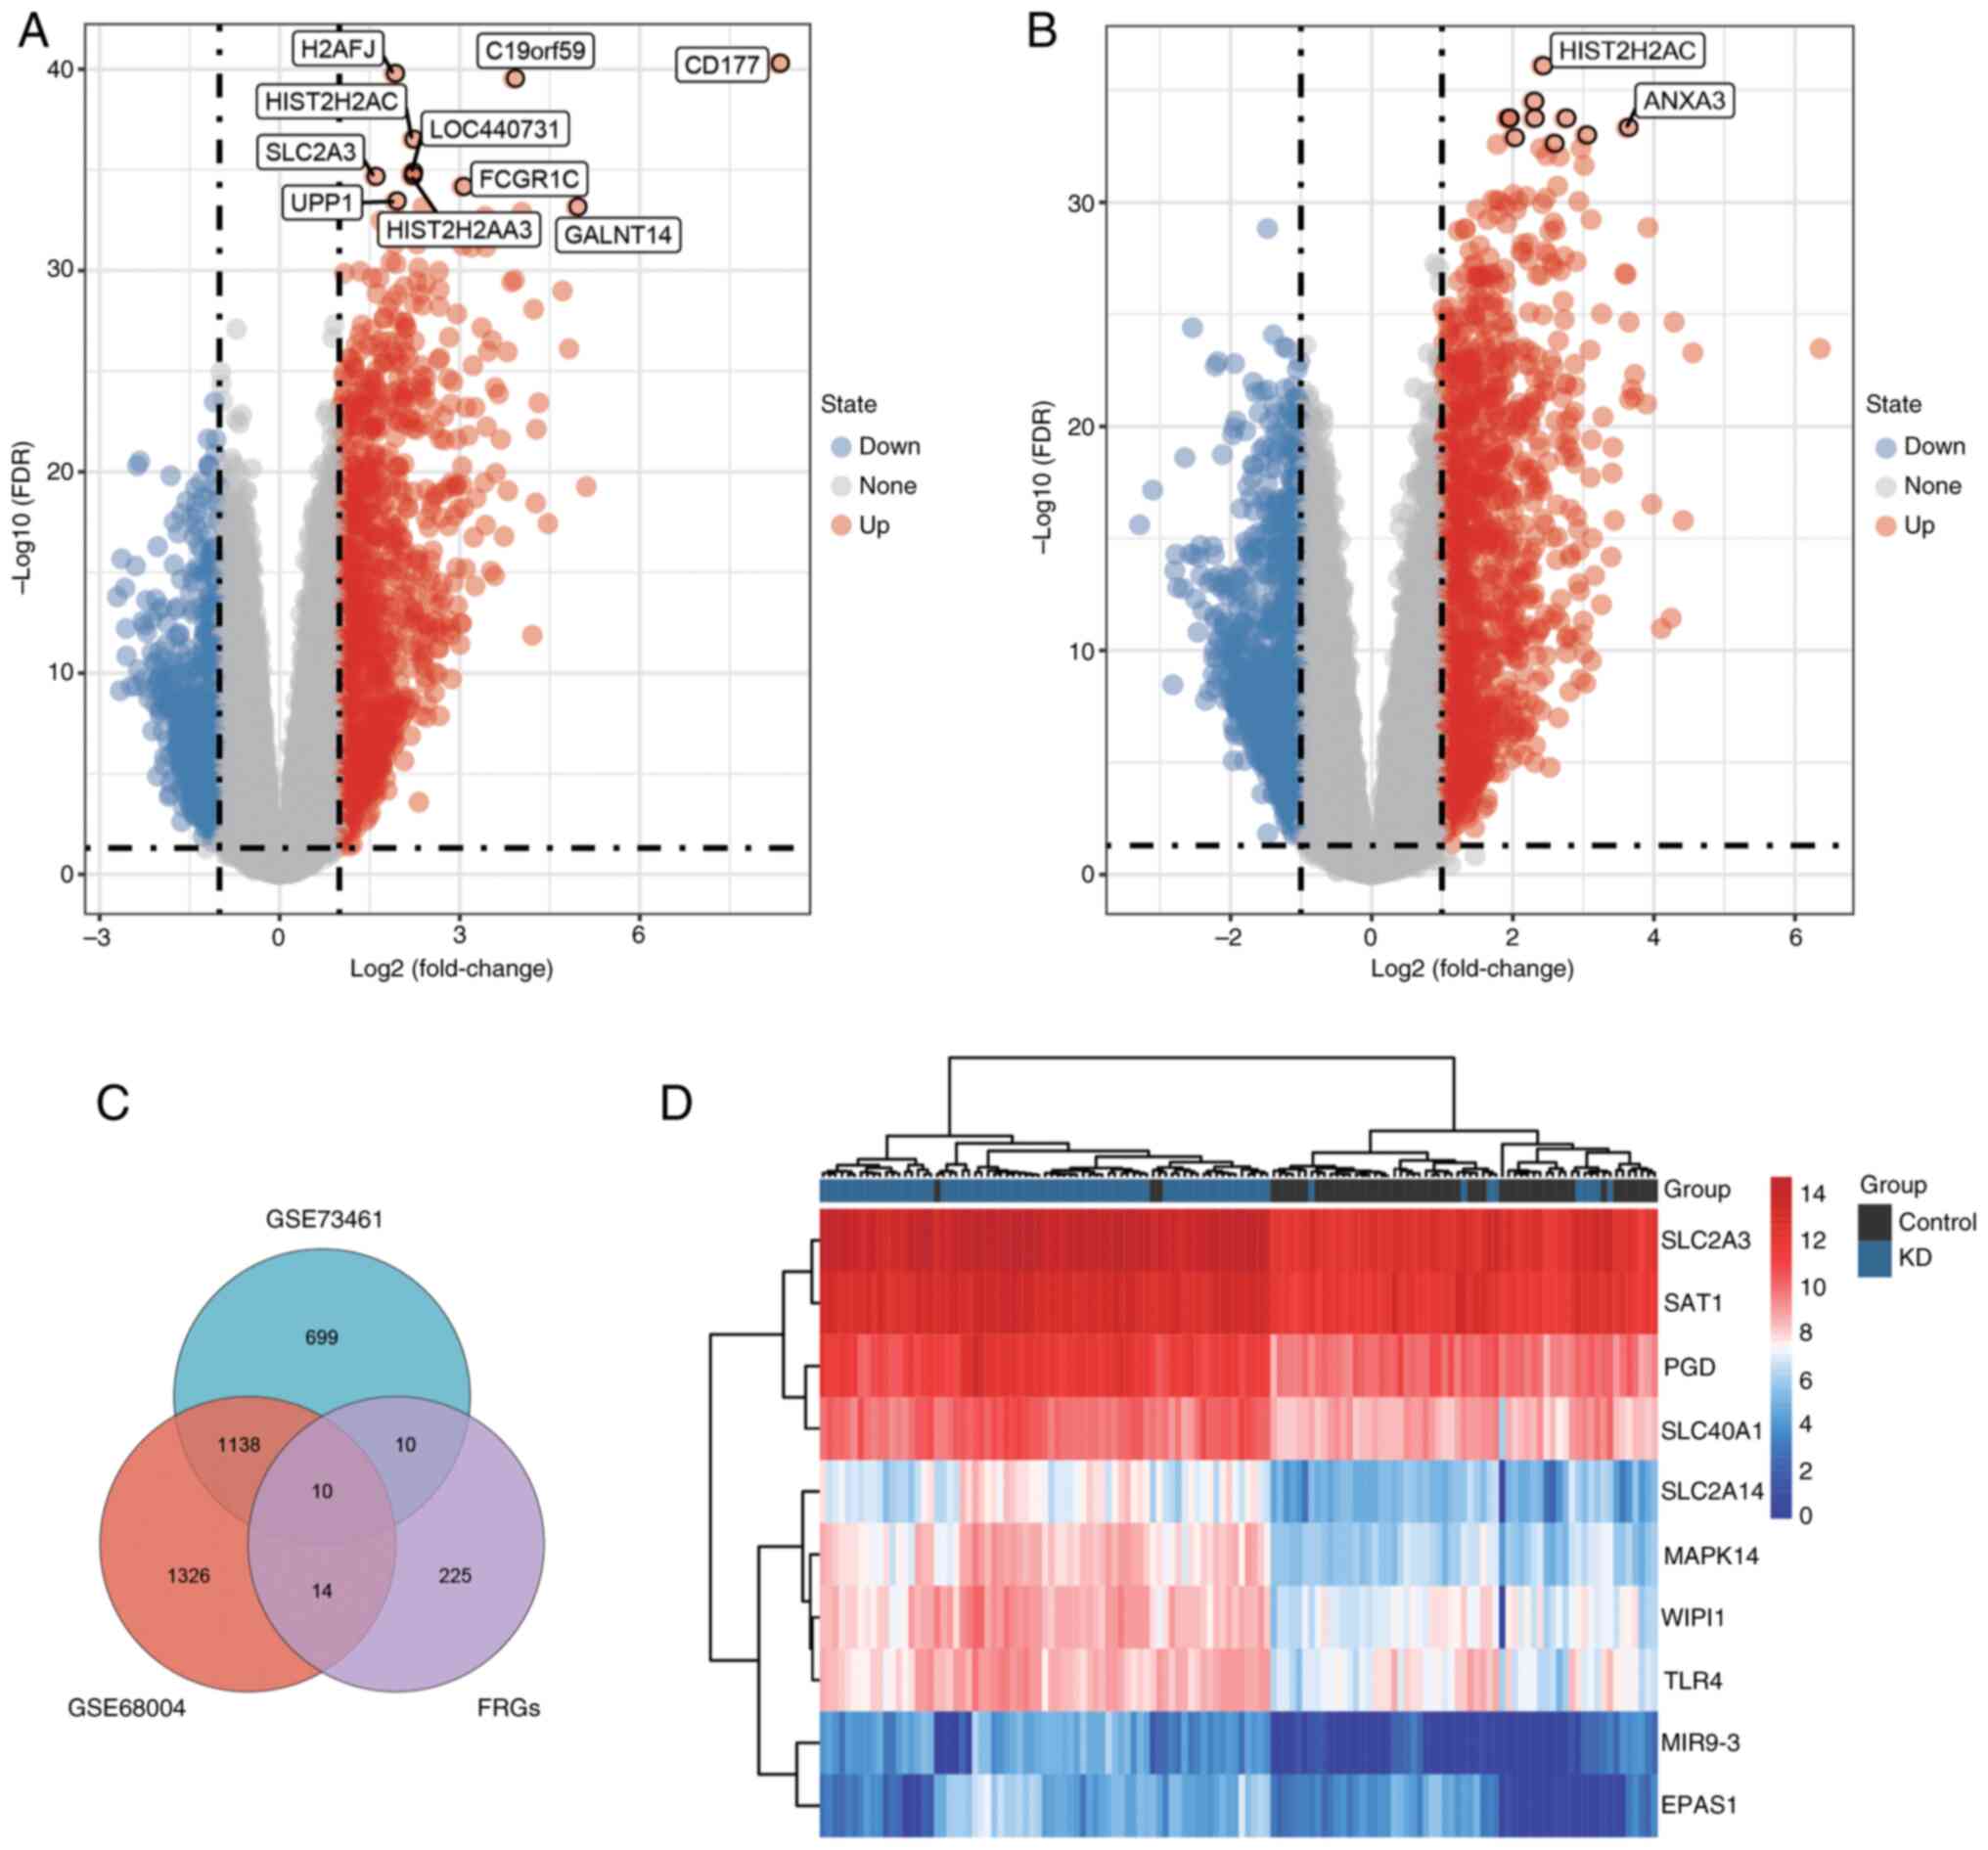
A flowchart of the study design is shown in Fig. 1. To identify genes associated with
KD, DEGs between control and KD samples were analyzed using the
limma package in R. Based on the screening thresholds of
|log2FC|≥1.0 and adj.P<0.05, 1,857 DEGs were selected
in the GSE73461 dataset, which included 700 downregulated genes and
1,157 upregulated genes. In the GSE68004 dataset, 2,488 DEGs were
obtained, of which 1,268 were significantly upregulated and 1,220
were downregulated. DEGs in the training sets (from GSE73461 and
GSE68004) were visualized using volcano plots (Fig. 2A and B). Then, the intersection of the DEGs and
FRGs was screened via a Venn diagram, and 10 overlapping DE-FRGs
were identified between the patients with KD and controls (Fig. 2C). Furthermore, an unsupervised
clustering analysis was conducted on 132 samples from the GSE73461
dataset using the expression data of the 10 DE-FRGs. As shown in
the heatmap, the DE-FRGs were highly expressed in the KD samples
and could markedly separate the KD samples from the control
samples, suggesting that they were closely associated with KD
(Fig. 2D). Therefore, further
research was conducted on these 10 genes and used to identify
diagnostic markers for KD.
Identification of key
ferroptosis-related markers associated with KD
To screen the optimal diagnostic genes for KD, a
LASSO regression model was constructed to analyze the DE-FRGs using
the glmnet package in R. A 10-fold cross-validation was utilized to
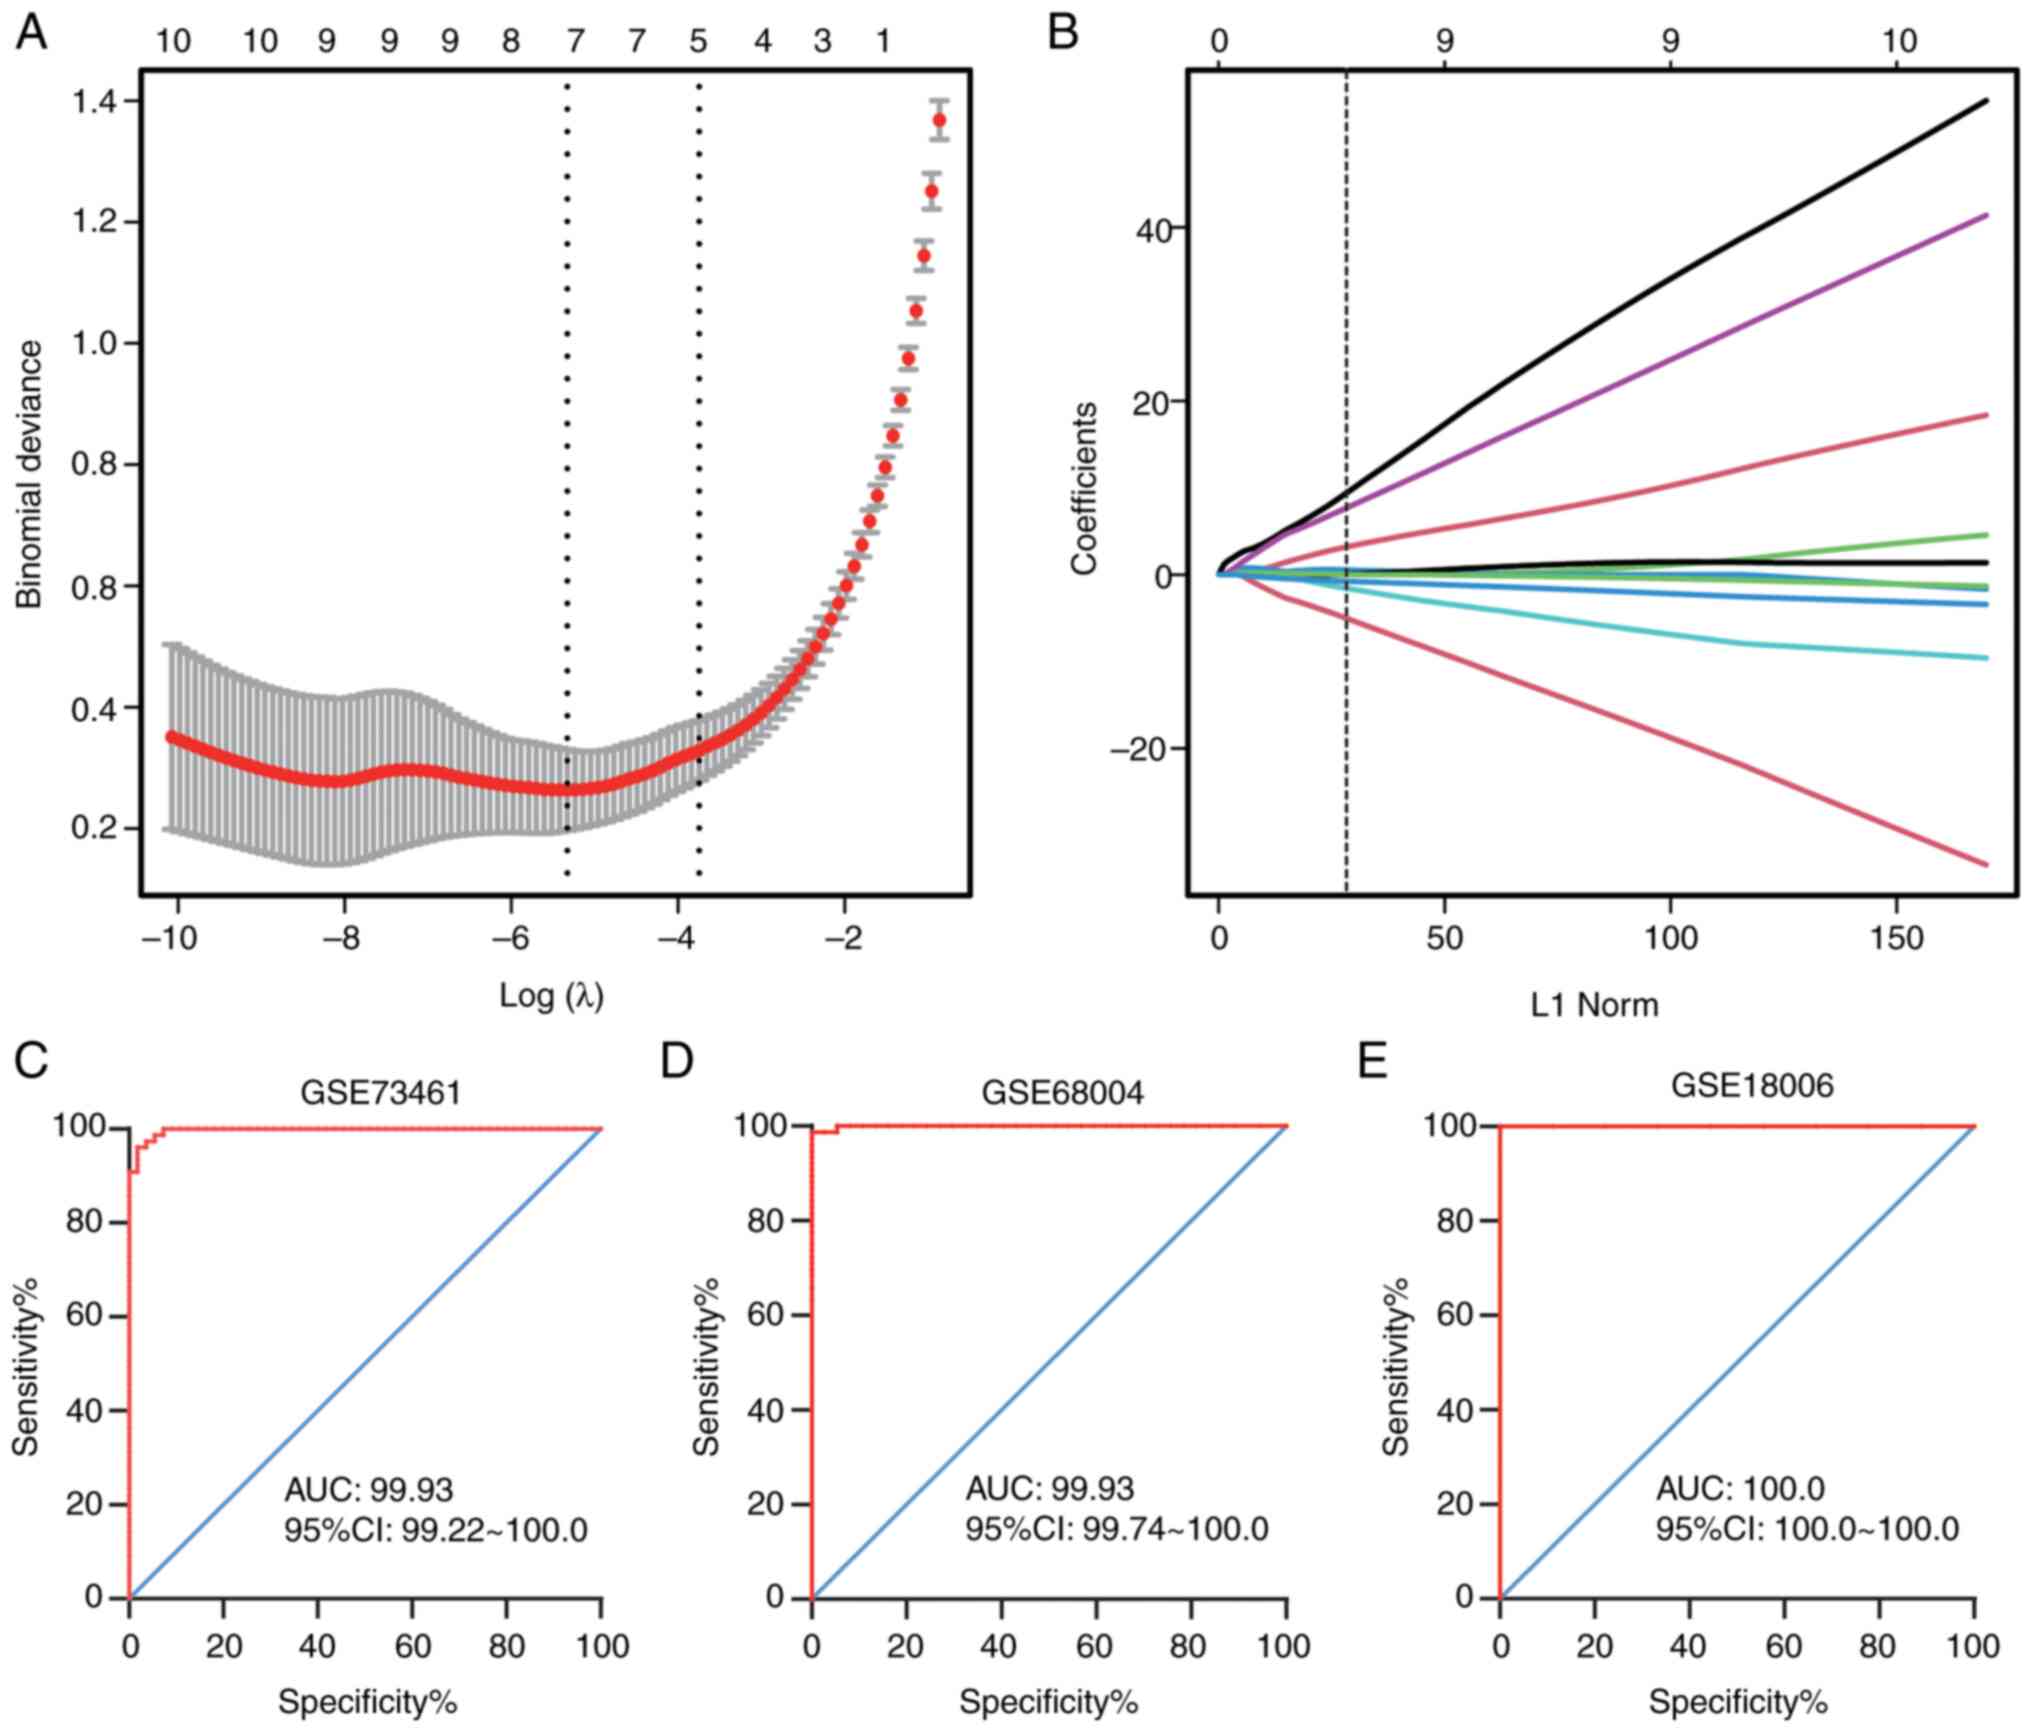
select the optimal penalty parameter (λ value) (Fig. 3A). Based on the best λ value, an
optimal gene model was developed and 6 key genes associated with
the diagnosis of KD were obtained (Fig.
3B). These 6 genes were considered key ferroptosis-related
markers (marker genes) and included EPAS1, MAPK14, SLC2A3, PGD,
SAT1 and TLR4.
Moreover, logistic regression models and subsequent
ROC curve analyses were performed to determine the diagnostic
predictive ability of the marker genes in the training and
validation sets. The AUC values of the marker genes were 0.9969 in
GSE73461 (Fig. 3C), 0.9993 in
GES68004 (Fig. 3D), and 1.0000 in
GSE18006 (validation set; Fig. 3E).
The results indicated that these 6 genes could markedly distinguish
patients with KD from healthy controls, suggesting that they could
be used as potential diagnostic markers for KD.
GSVA
GSVA was then conducted to explore the differential
changes in the signaling pathways between the high-expression and
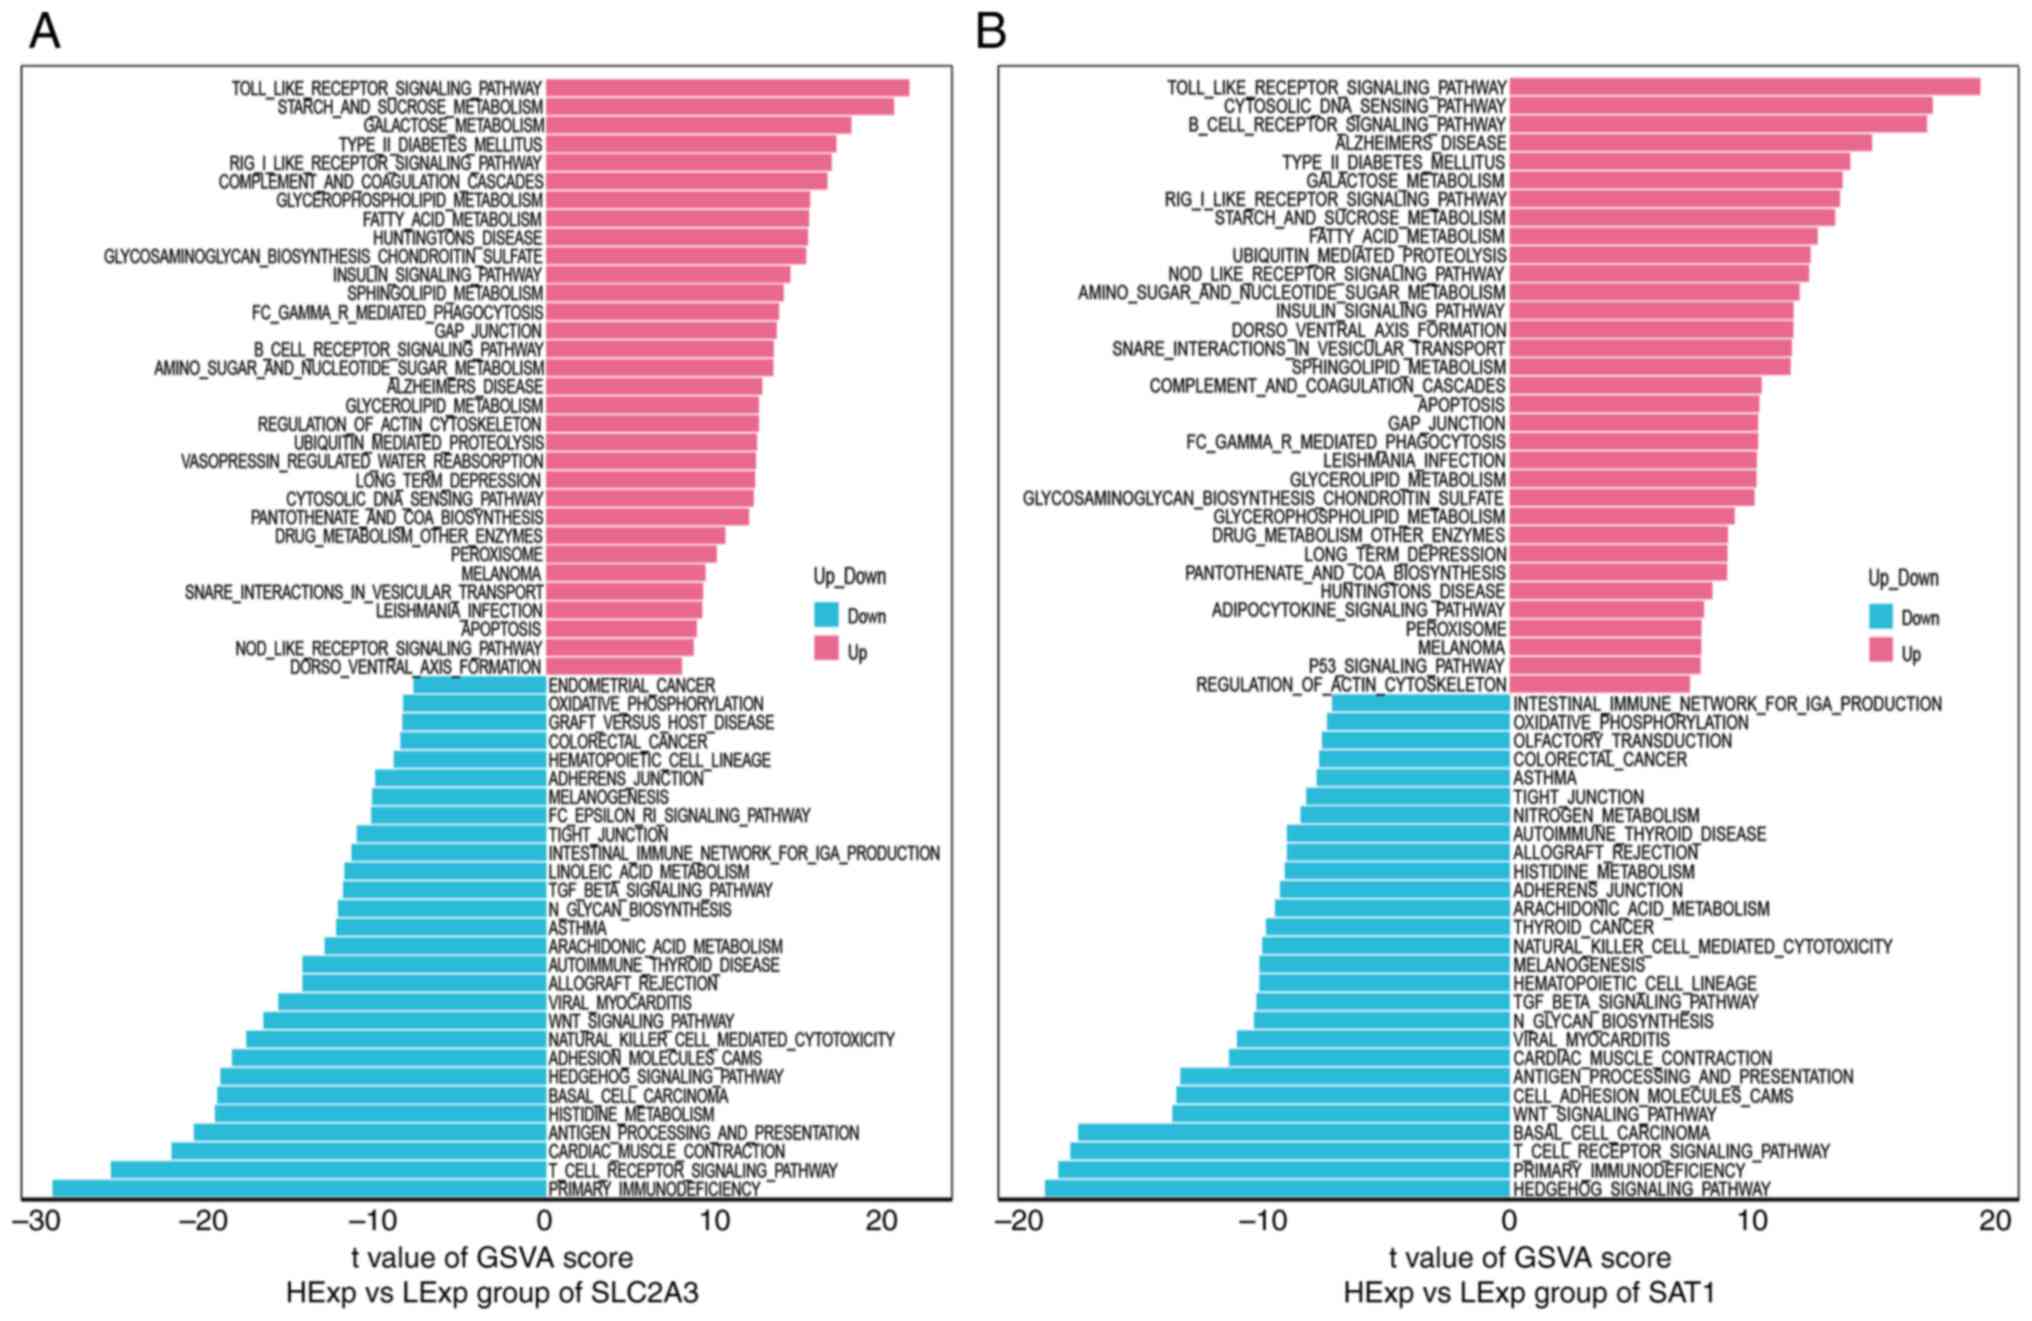
low-expression groups of each marker gene. The data revealed that
high SLC2A3 expression was primarily enriched in the Toll-like
receptor signaling pathway, carbohydrate metabolism (starch and
sucrose metabolism and galactose metabolism), the RIG-I-like
receptor signaling pathway, the complement and coagulation cascades
and fatty acid metabolism. In comparison, low SLC2A3 expression was
associated with adaptive immune responses (primary
immunodeficiency, the T-cell receptor signaling pathway, antigen
processing and antigen presentation), cardiac muscle contraction
and histidine metabolism (Fig. 4A).
The upregulation of SAT1 was closely related to innate immune
activation (the Toll-like receptor, RIG-I-like receptor and
Nod-like receptor signaling pathways), cytosolic DNA sensing, the
B-cell receptor signaling pathway, carbohydrate metabolism and
fatty acid metabolism. Meanwhile, in the SAT1 low-expression group,
the Hedgehog signaling pathway, adaptive immune-related pathways,
the Wnt signaling pathway, cell adhesion molecules and cardiac
muscle contraction were enriched (Fig.
4B). Notably, in the high and low PGD, EPAS1, TLR4 and MAPK14
gene expression groups, the pathway enrichment patterns were
similar to those in the high and low SLC2A3 and SAT1 gene
expression groups (Fig. S1A-D).
These findings suggested that in the early stage of KD, these
marker genes may affect the progression of KD by activating the
innate immune-associated pathways, glucose metabolism and fatty
acid metabolism, and partially reducing the adaptive immune
response-related processes.
Immune cell infiltration landscapes in
patients with KD
Considering the GSVA enrichment data was closely
associated with immune-related biological processes, immune
infiltration analysis was performed using healthy and KD samples by
the CIBERSORT algorithm. The immune infiltration scores were
visualized using split violin plots (Fig. 5A and B). The infiltration levels of CD8 T cells,
CD4 naïve T cells, resting CD4 memory T cells, resting natural
killer (NK) cells and activated NK cells were significantly lower
in patients with KD than in the controls in the training sets
(GSE73461 and GSE68004). By contrast, the infiltration levels of γδ
T cells, monocytes, macrophage M0, and neutrophils were
significantly higher in patients with KD than in the controls in
the training sets (Fig. 5A and
B). The levels of memory B cells,
macrophage M2 and resting mast cells were reduced in patients with
KD in the GSE73461 dataset, and the contents of naïve B cells were
reduced in patients with KD in the GSE68004 dataset. Furthermore,
the contents of activated CD4 memory T cells and activated mast
cells were relatively enhanced in KD group in GSE73461, while the
fraction of resting mast cells was significantly higher in patients
with KD in GSE68004. In summary, these data indicated that most
adaptive immune-related cells are downregulated in patients with
KD.
In addition, the CD80, CTLA4, CD274, PDCD1, CD86,
CD28, BTLA, LAG3, TIGIT, TNFSF4 and TNFRSF4 genes were selected as
immune checkpoint genes, and their expression levels in patients
with KD and healthy controls were analyzed using these microarray
datasets. The difference in immune levels between the two groups
was also presented in the difference in gene expression levels of
these immune checkpoints (Fig. 5C).
As shown in Fig. 5C, the expression
levels of most checkpoint genes were low in patients with KD. By
contrast, the CD274 and TNFSF4 genes were highly expressed in KD,
while the expression level of CD80 remained unchanged. In summary,
most immune checkpoint genes involved in adaptive immunity were
downregulated in KD, implying that the adaptive immune response in
these patients was suppressed to some extent.
Correlation of marker genes with
immune infiltration cells and immune checkpoint genes
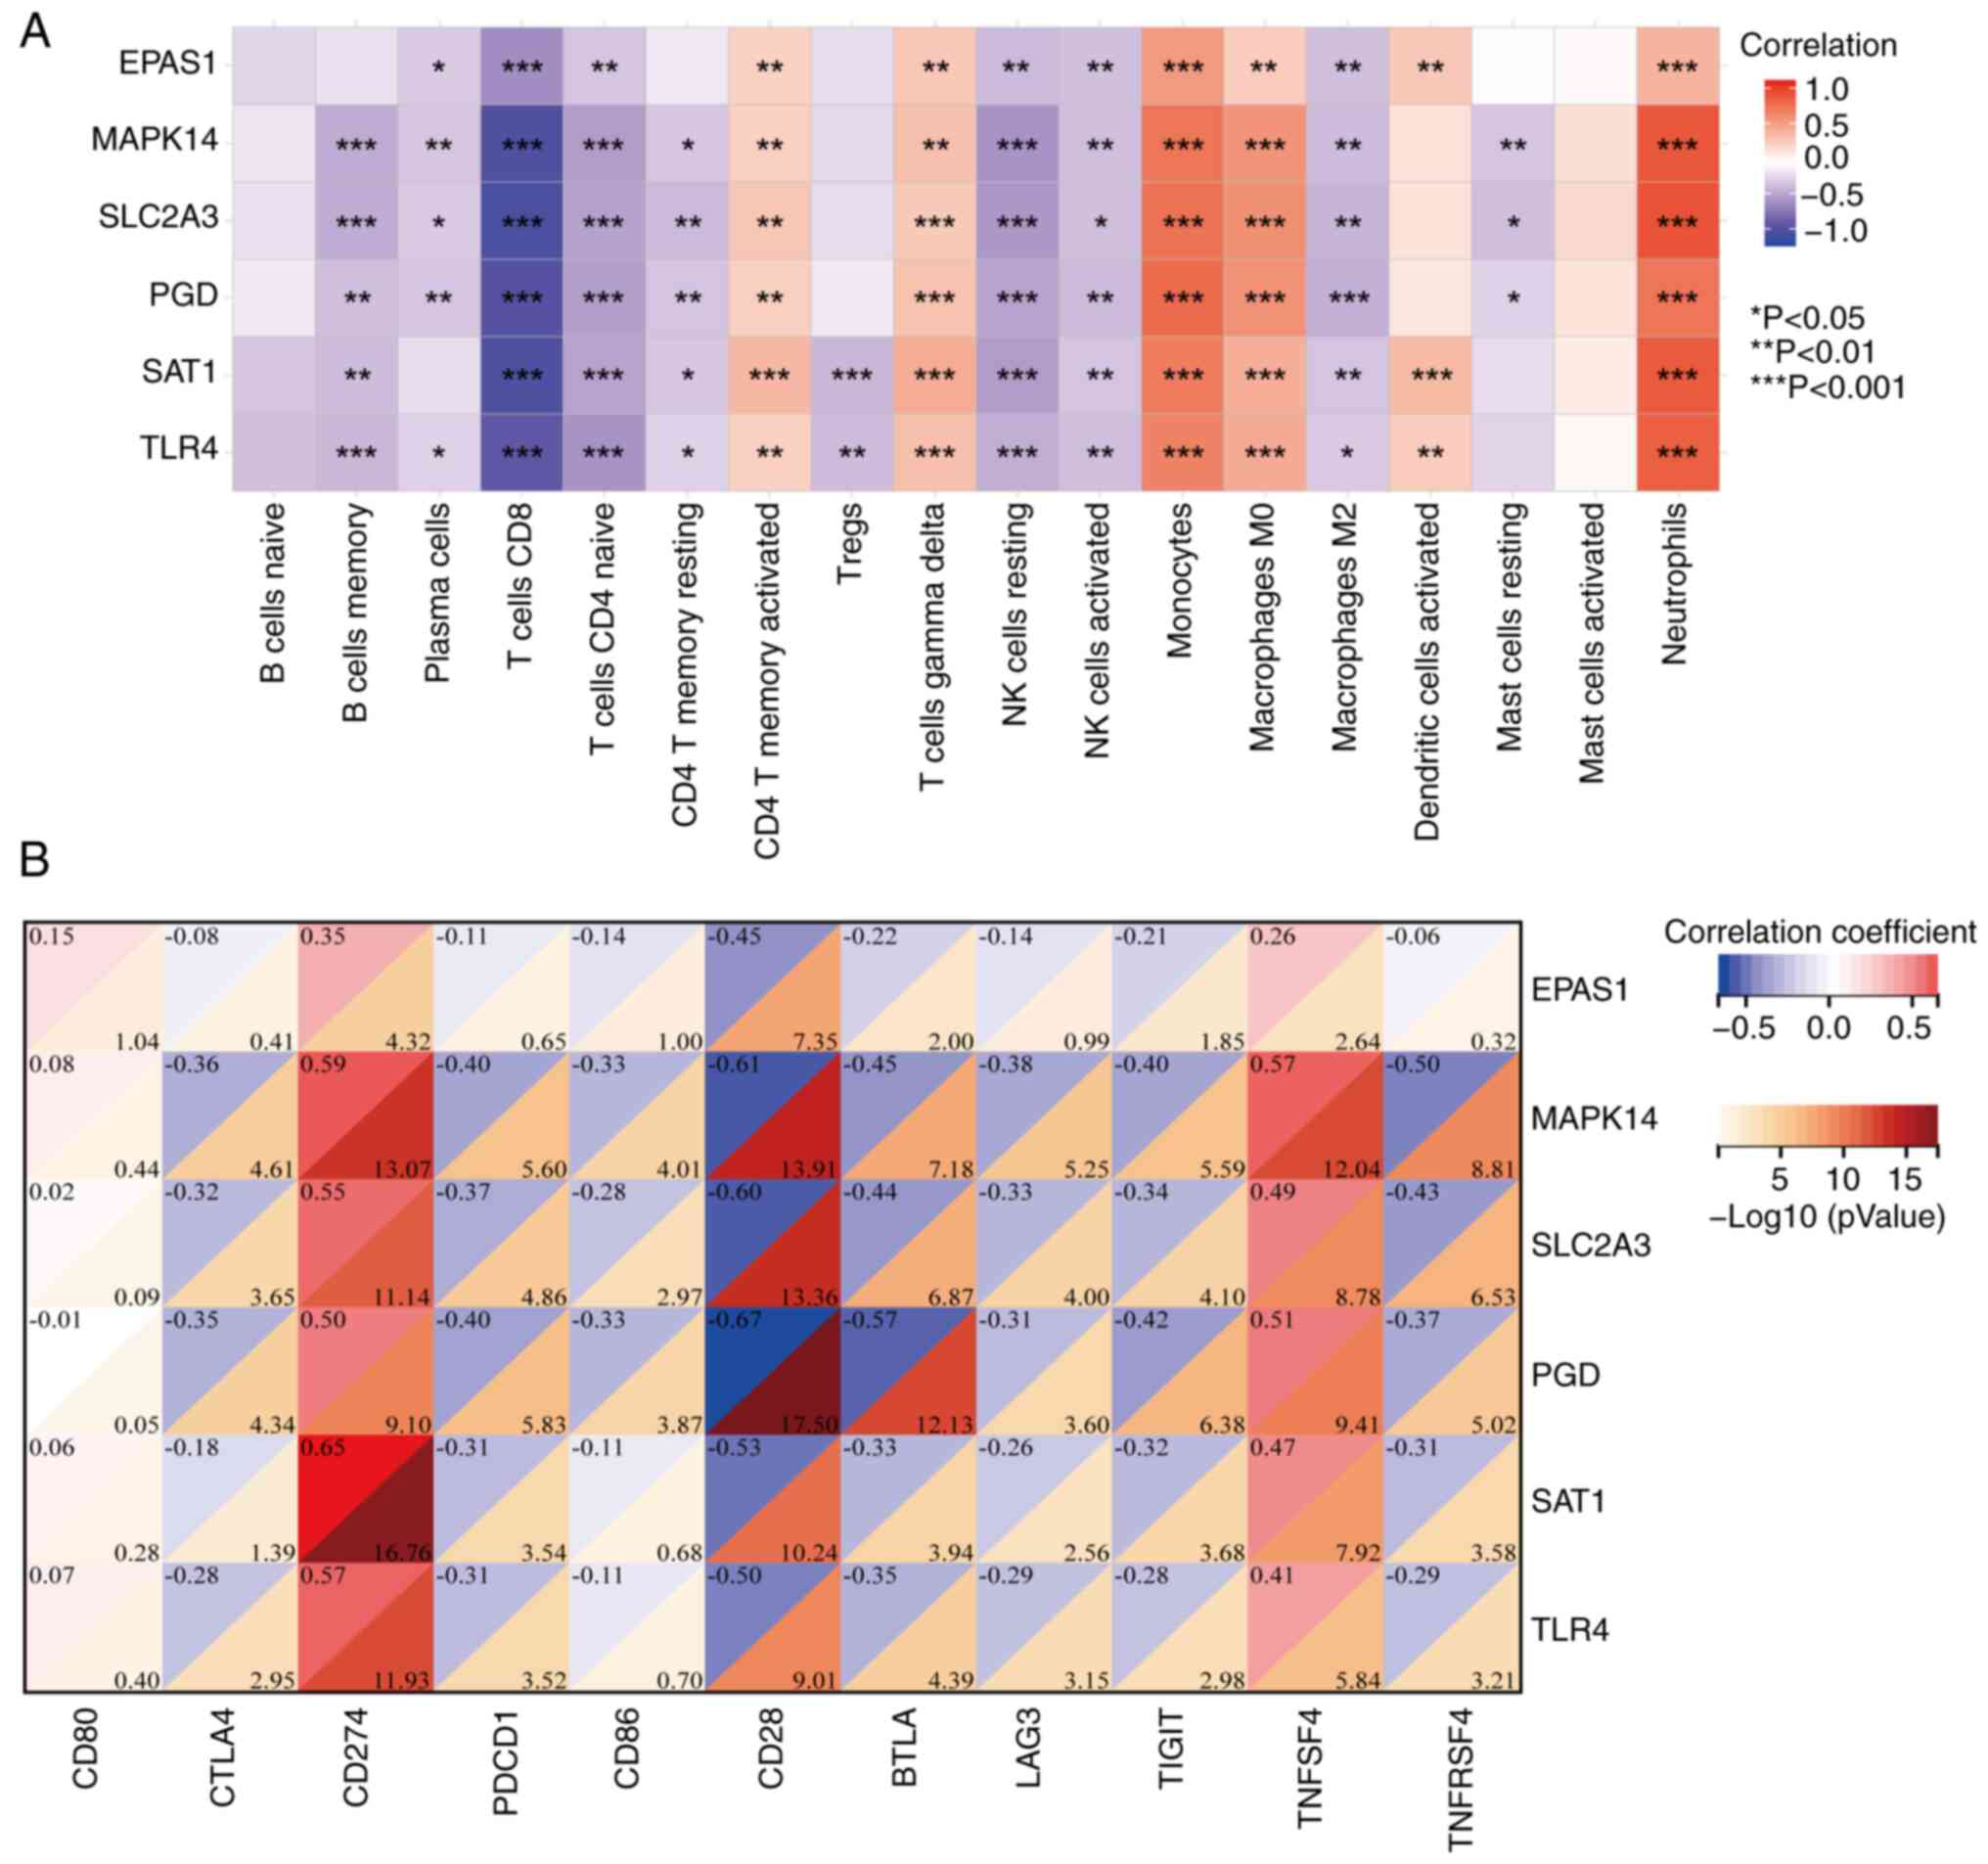
Pearson's correlation coefficient was used to
analyze the correlation of key markers with immune cells and immune
checkpoint genes. The results demonstrated that the key marker
genes exhibited a strong negative correlation with CD8 T cells, CD4
naïve T cells, resting NK cells, activated NK cells and macrophage
M2, with the strongest correlation noted with CD8 T cells (Fig. 6A). By contrast, these candidate
marker genes exhibited a strong positive correlation with activated
CD4 memory T cells, γδ T cells, monocytes, macrophage M0 and
neutrophils (Fig. 6A).
The correlations between the marker genes and immune
checkpoints are presented in Fig.
6B. In total, 5 key genes (excluding EPAS1) were strongly
positively correlated with CD274 and TNFSF4, but negatively
correlated with most immune checkpoint genes, such as CTLA4, PDCD1,
CD28, BTLA, TIGIT and TNFRSF4. EPAS1 was only positively correlated
with CD274 and negatively correlated with CD28 (Fig. 6B). In summary, these results
indicated that changes in immune features may be associated with
the marker genes, both of which may play a key role in the
progression of KD.
Ability of the marker genes to predict
KD in the training set
To determine the efficiency of the identified marker
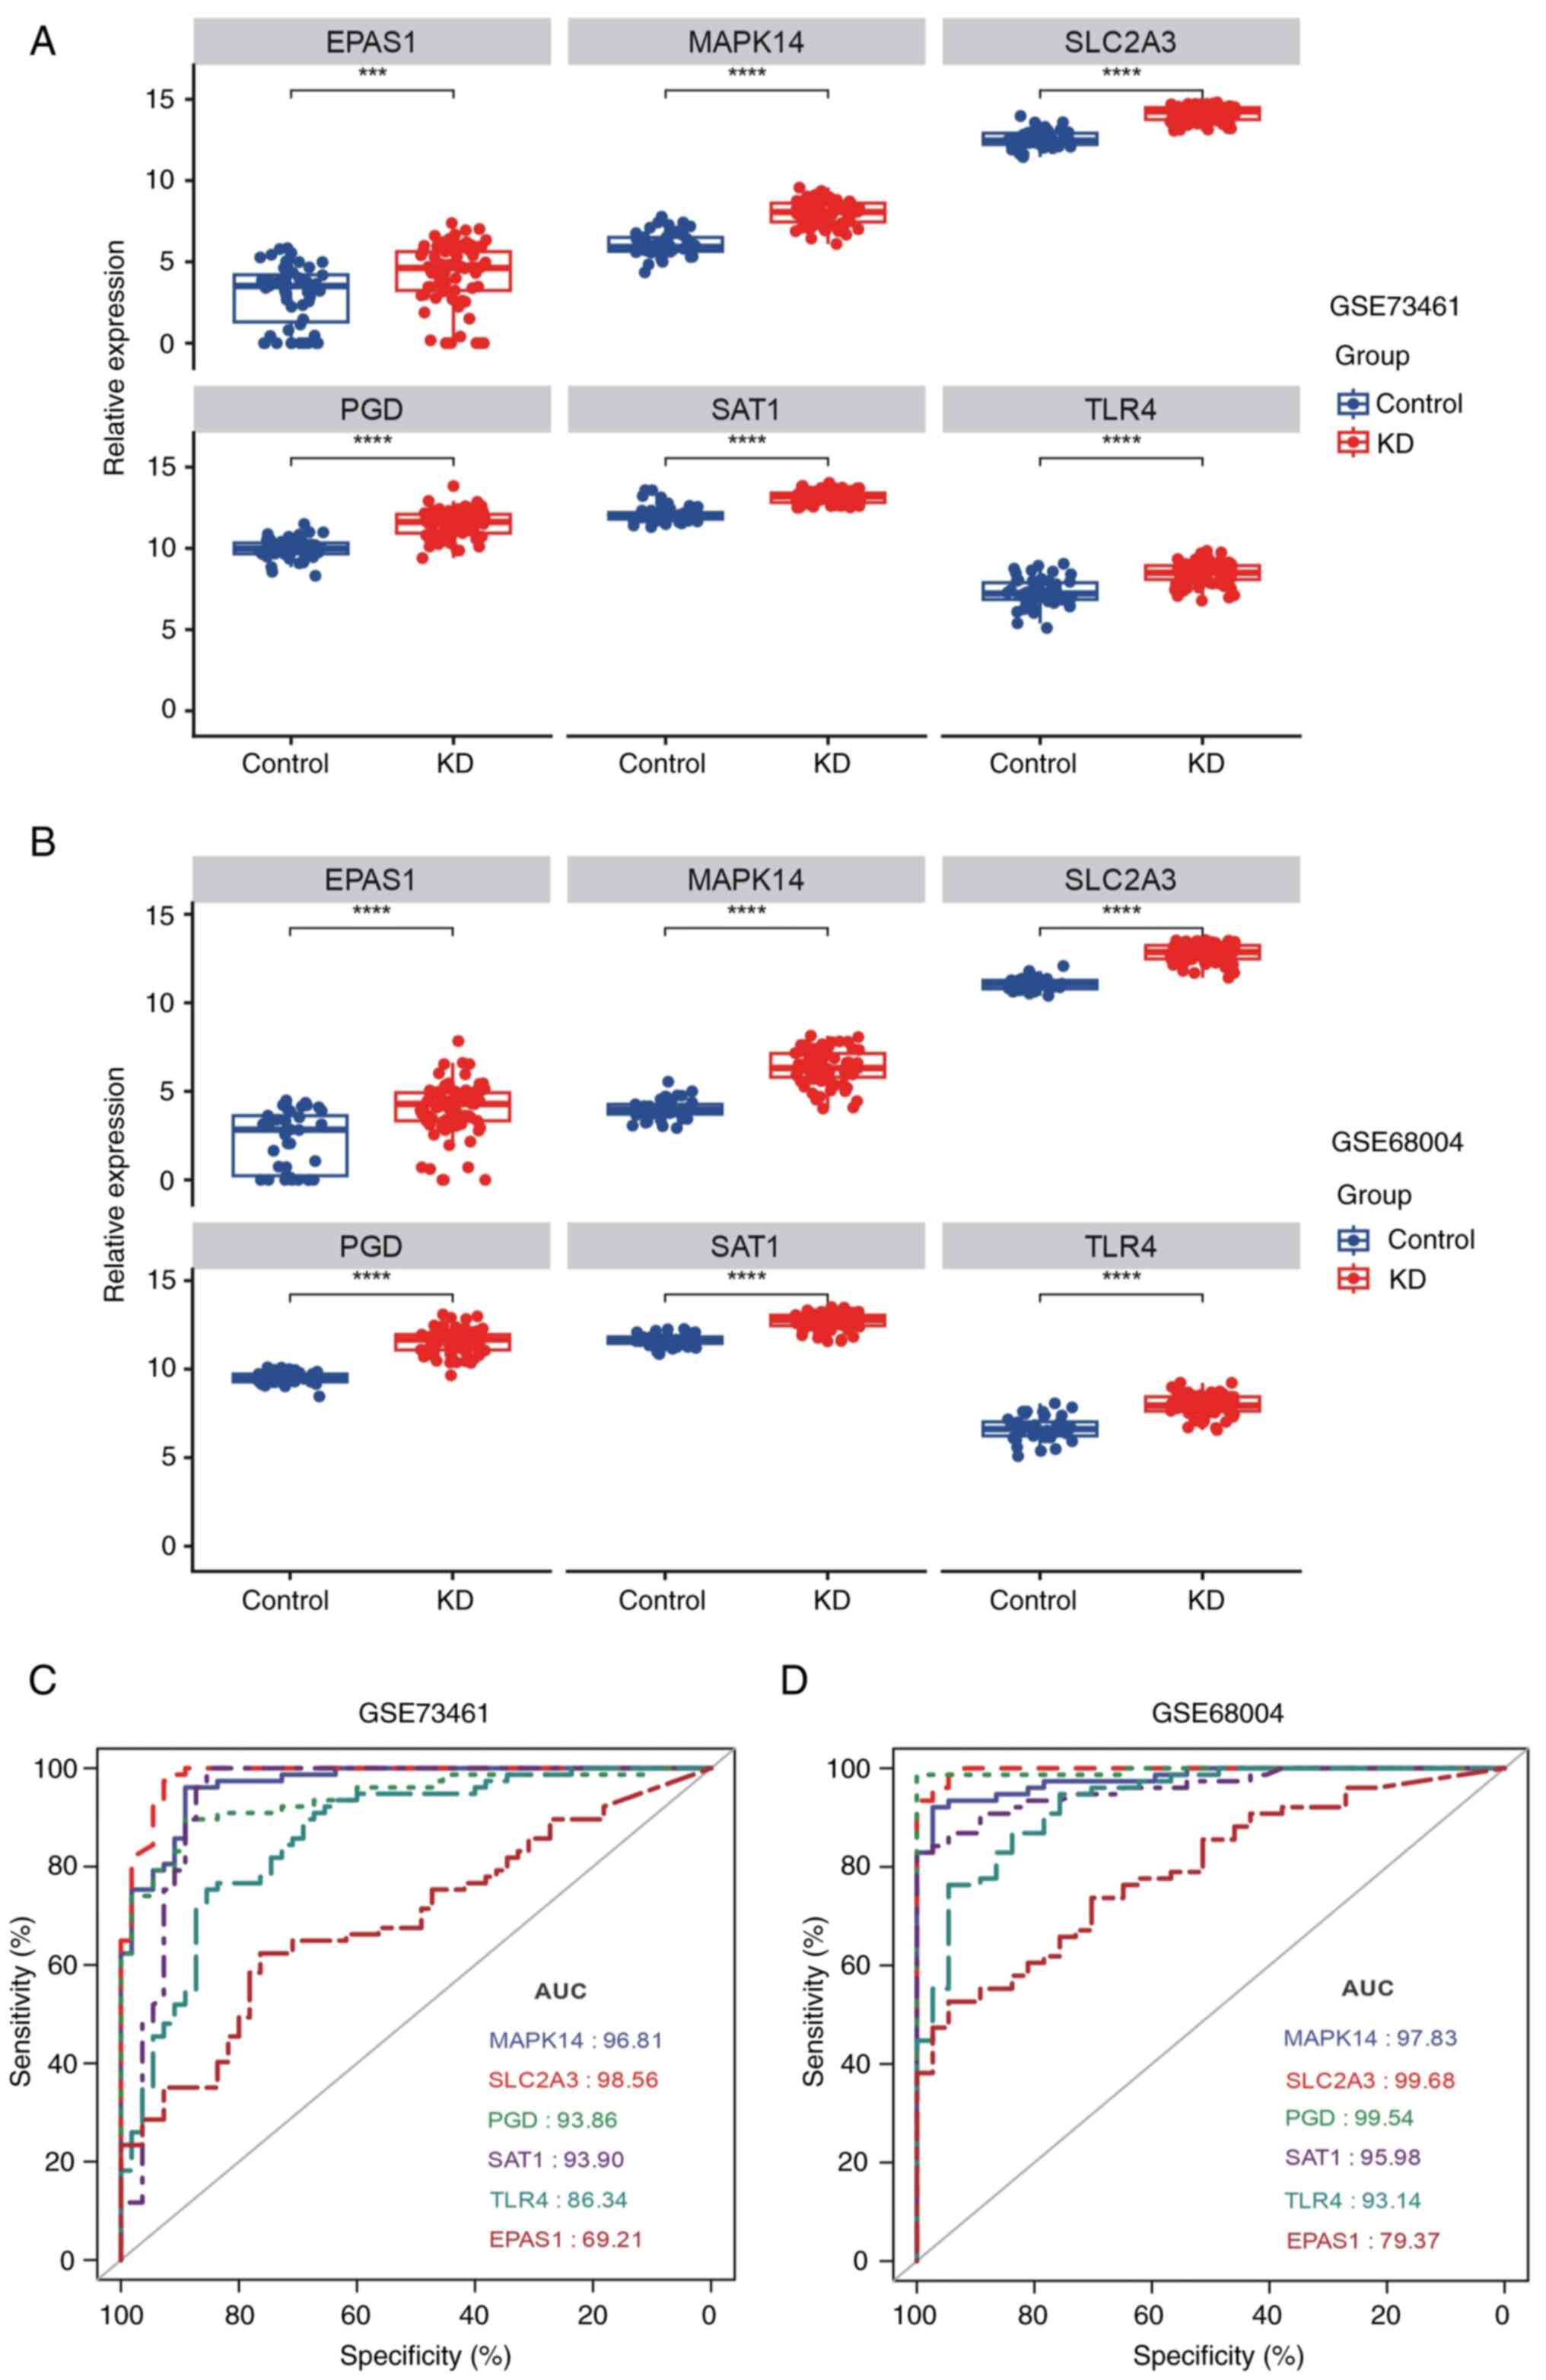
genes in predicting KD, their mRNA expression levels in patients
with KD and healthy individuals were first examined using the
training set. In the GSE73461 and GSE68004 datasets, all 6
ferroptosis-related markers were significantly upregulated in
patients with KD (Fig. 7A and
B), suggesting that high expression
levels of these genes may be involved in the occurrence of KD.
ROC analysis was then conducted to elucidate the
classification power of each marker gene. As shown in Fig. 7C and D, the AUC values of MAPK14, SLC2A3, PGD,
SAT1, TLR4 and EPAS1 for the prediction of KD were 0.968, 0.986,
0.939, 0.939, 0.863 and 0.692, respectively, in the GSE73461
dataset and 0.978, 0.997, 0.995, 0.960, 0.931 and 0.794,
respectively, in the GSE68004 dataset (Fig. 7C and D). Thus, these markers could markedly
differentiate patients with KD from healthy controls. Taken
together, these findings indicated that the 6 marker genes have
notable diagnostic value for predicting KD. Thus, they were
considered diagnostic markers for KD.
Diagnostic performance of marker genes
in the validation set
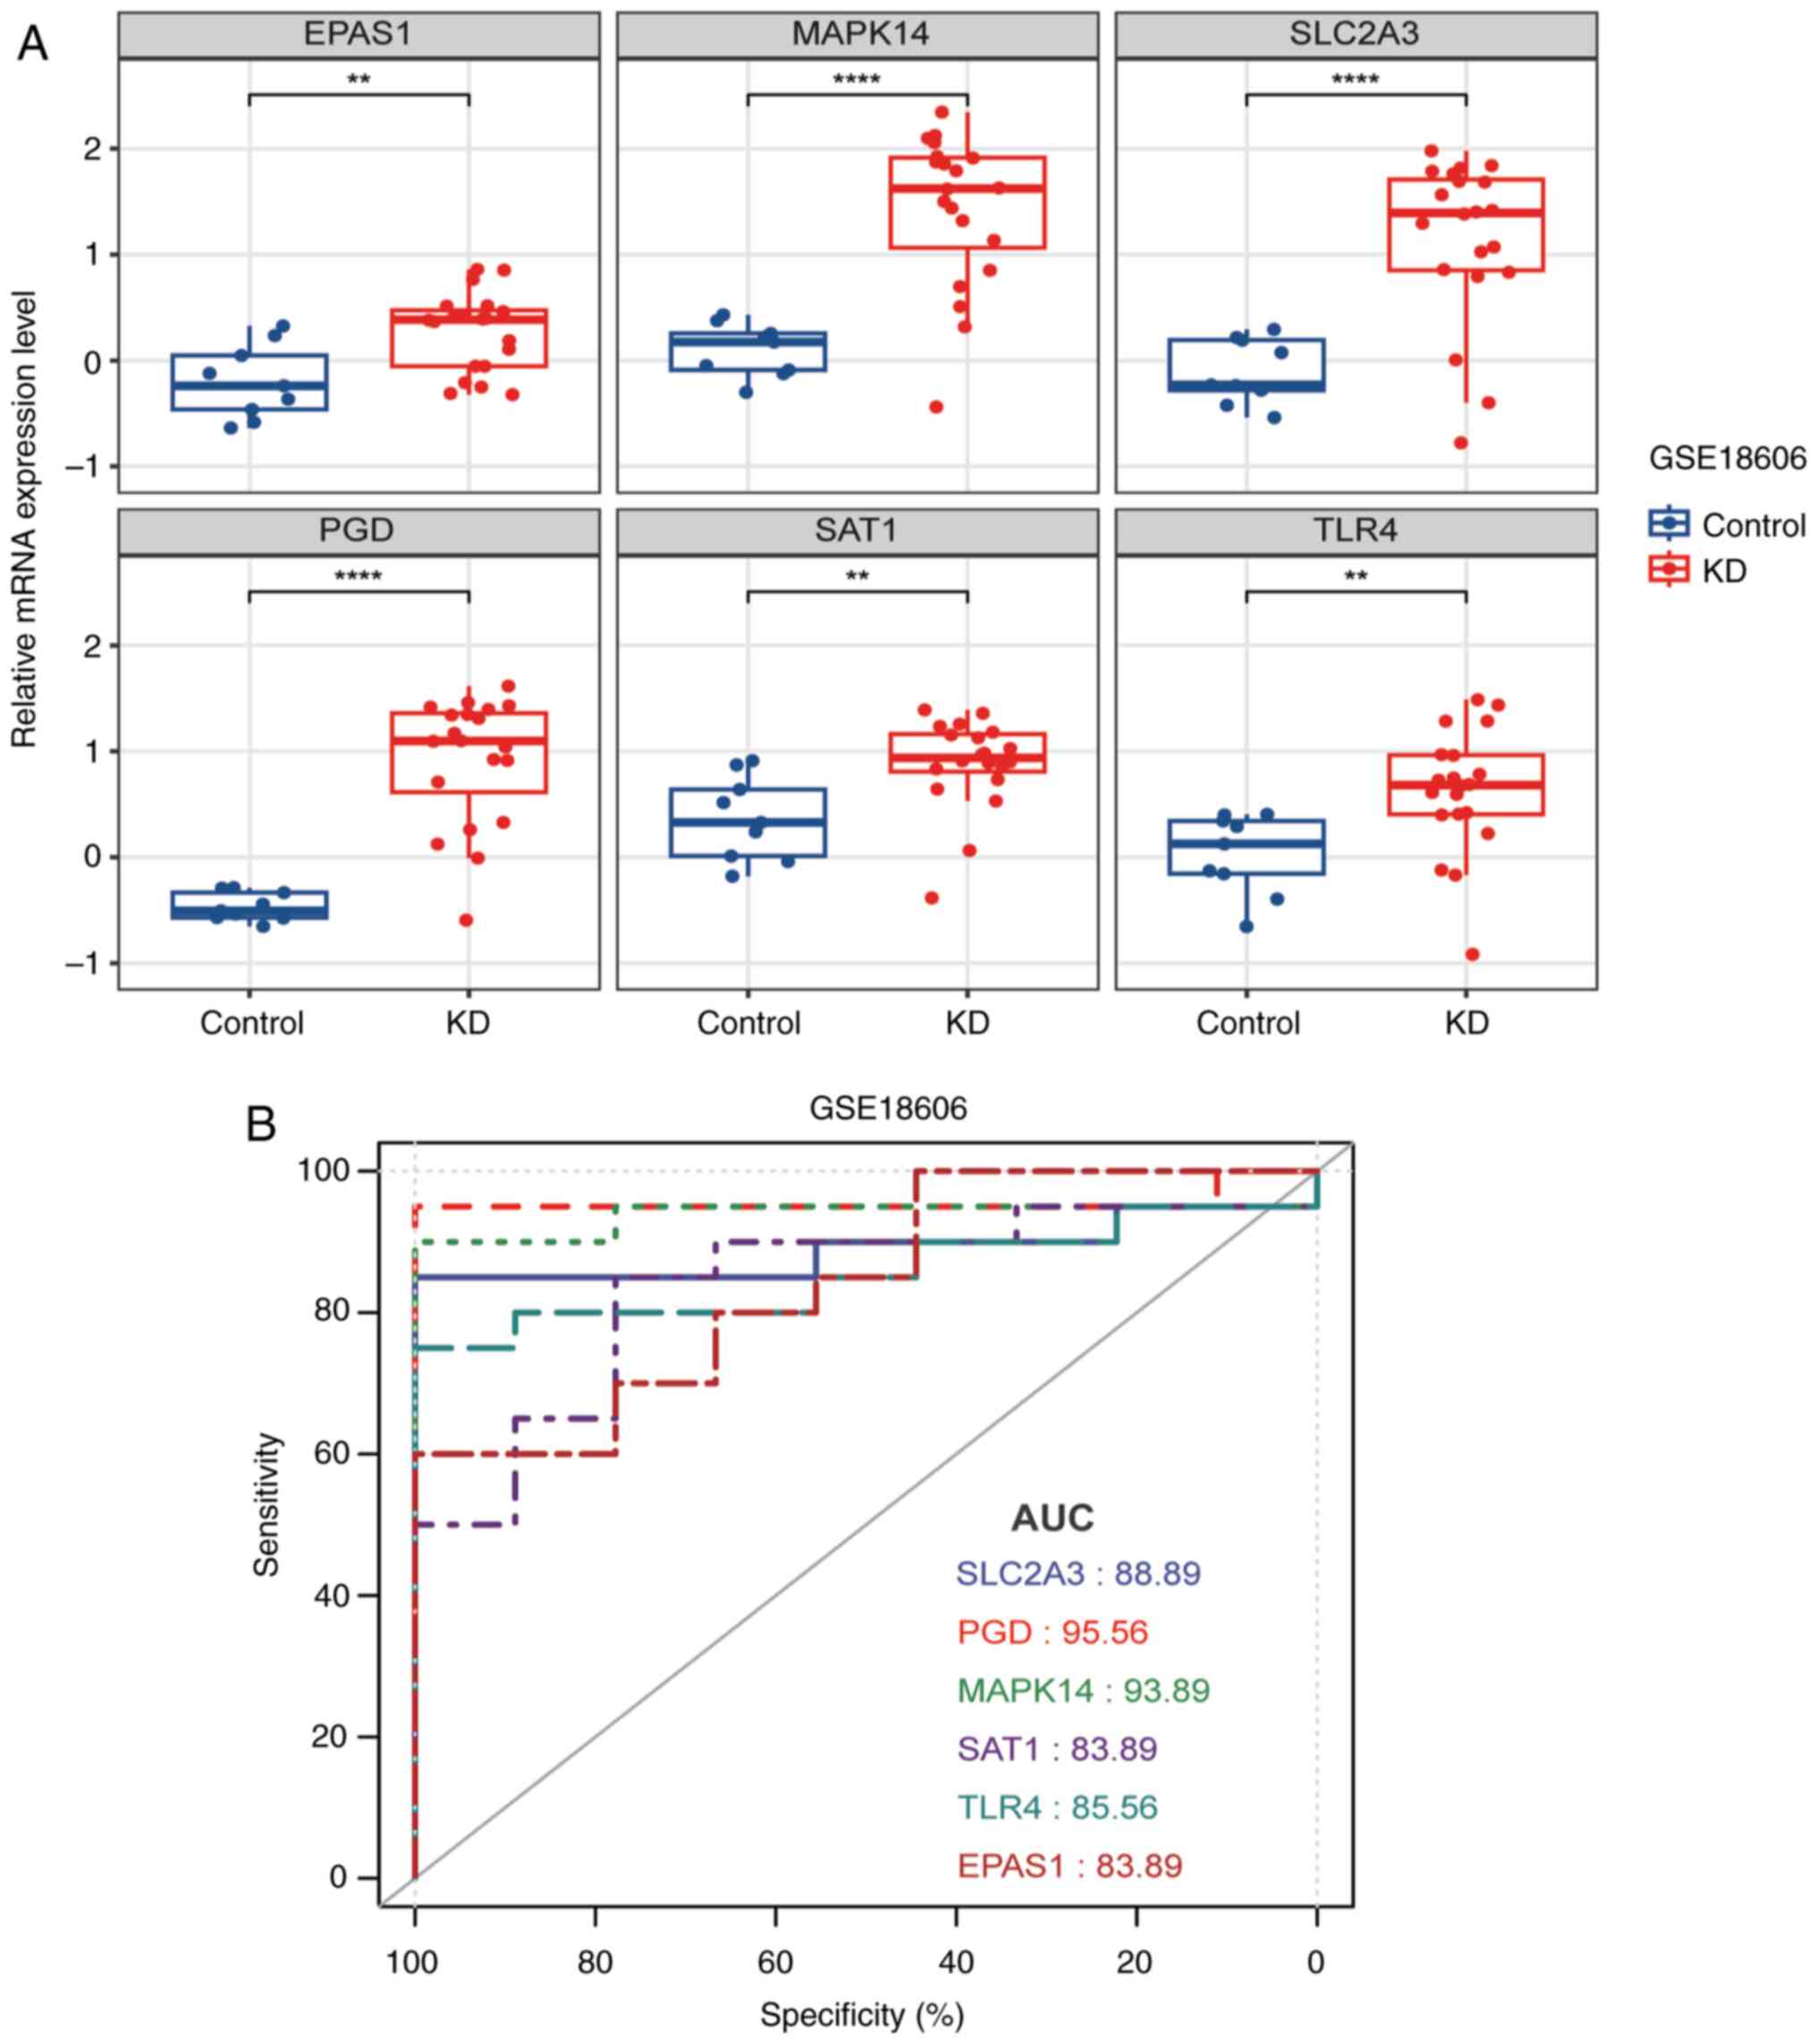
The diagnostic applications of these
ferroptosis-related markers were evaluated using the validation set
(GSE18006). The mRNA expression levels of the 6 genes are exhibited
in Fig. 8A, all of which were
significantly increased in the KD samples (Fig. 8A). Moreover, the AUC values of the
SLC2A3, PGD, MAPK14, SAT1, TLR4 and EPAS1 genes in the validation
set were 0.889, 0.956, 0.939, 0.839, 0.856 and 0.839, respectively
(Fig. 8B). These data revealed the
effectiveness of these markers in the diagnosis of KD and their
potential as diagnostic markers for KD.
Drug prediction
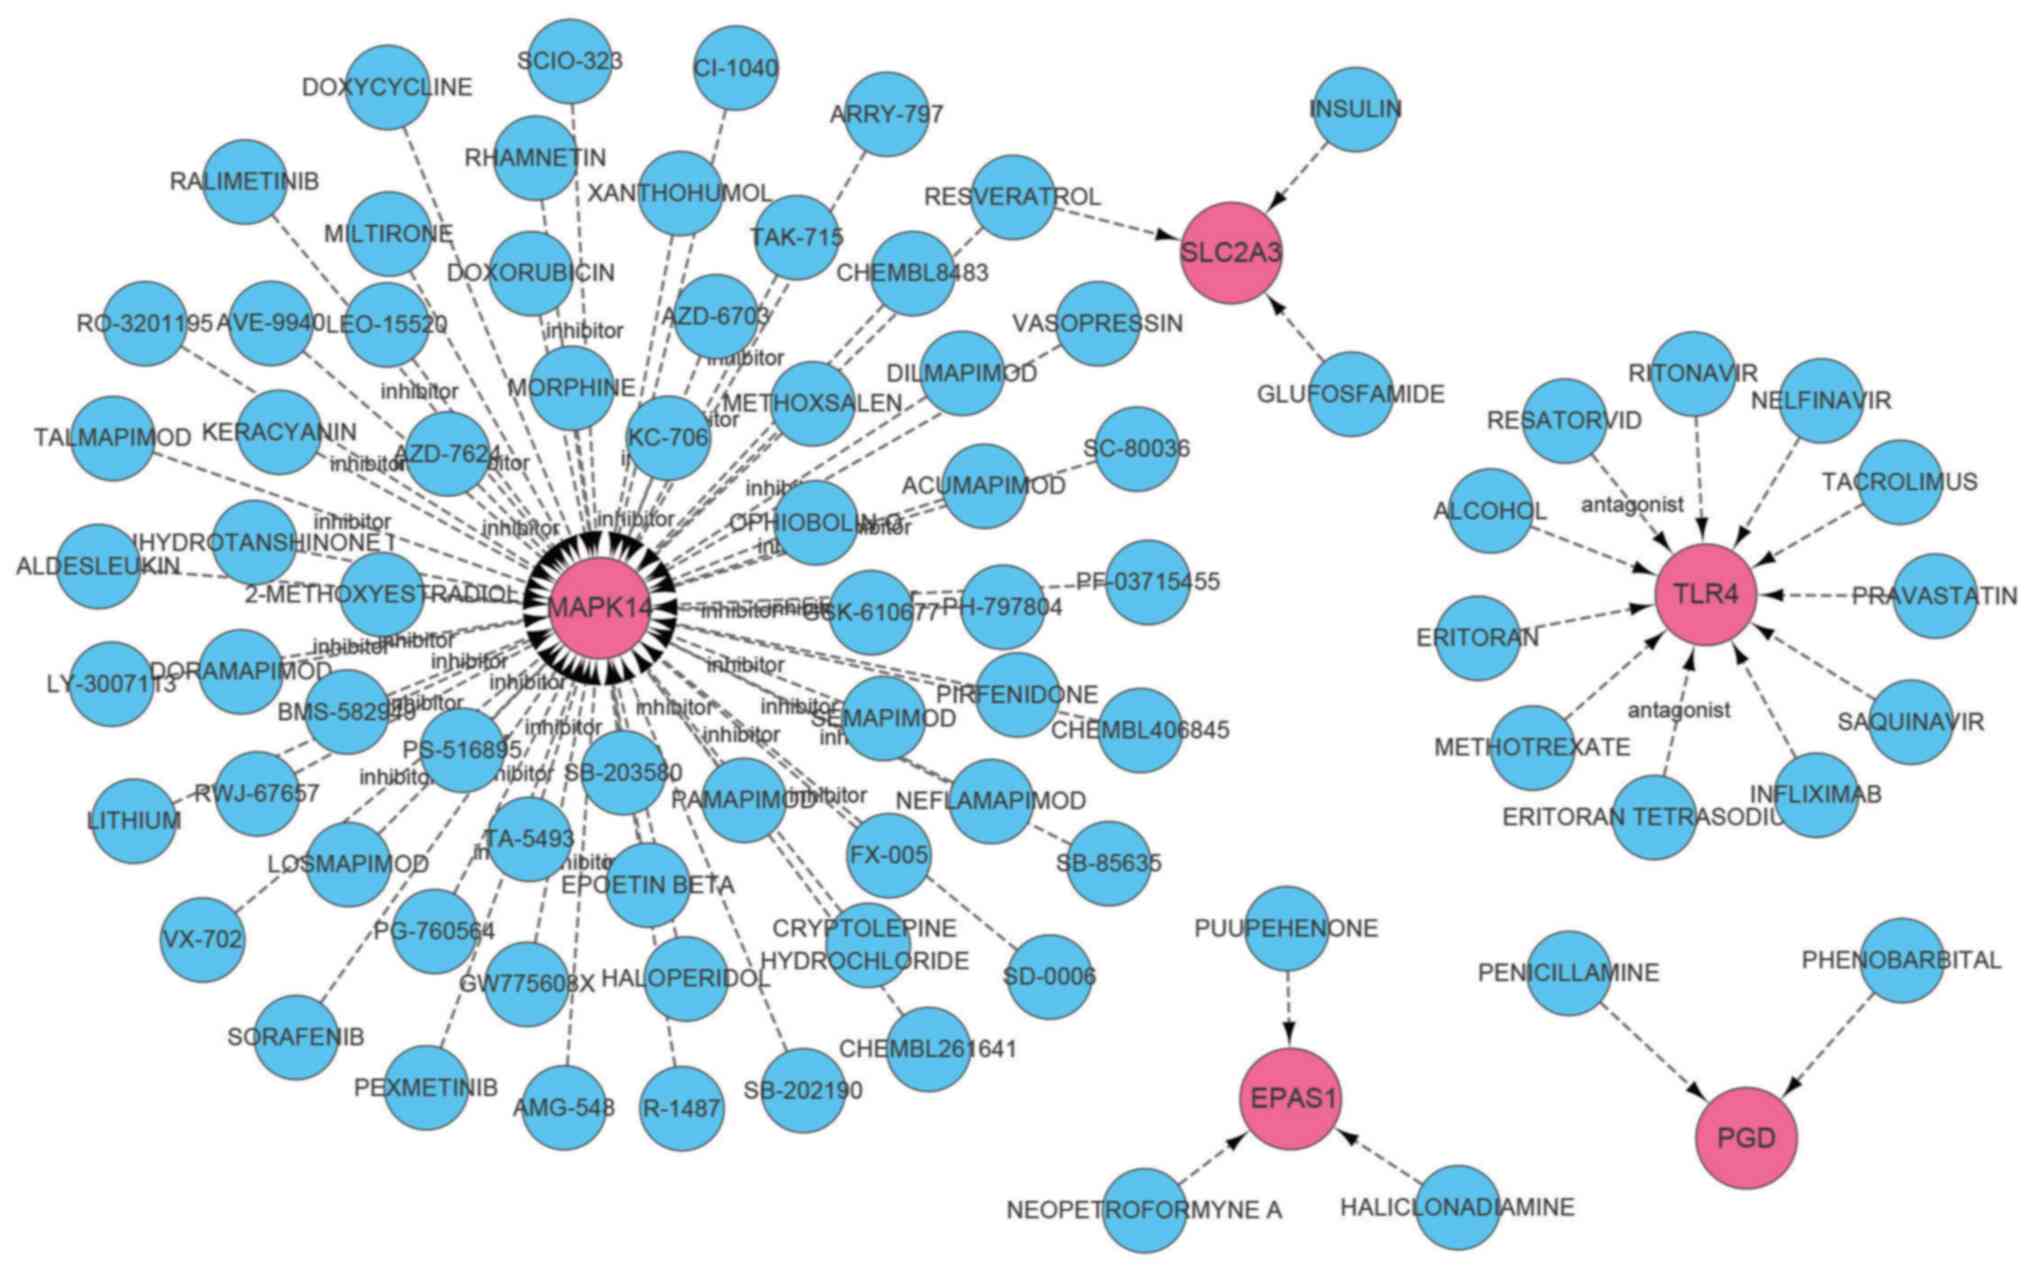
DGIdb was applied to predict drugs that may target
the identified diagnostic markers. An interaction network was
constructed using Cytoscape software and is shown in Fig. 9. The details of the network are also
listed in Table SII. A total of 91
drugs were queried, of which 72 drugs targeted MAPK14, 11 targeted
TLR4, 2 drugs for PGD, and 3 drugs each targeted SLC2A3 and EPAS1.
Furthermore, no drugs targeting SAT1 were detected.
Validation of ferroptosis-related
markers in clinical samples and vascular endothelial cells
Blood samples were collected from 22 patients with
KD and 25 healthy controls at Shenzhen Baoan Women's and Children's
Hospital of Jinan University to further validate the diagnostic
value of the candidate FRG markers using RT-qPCR. As demonstrated
in Fig. 10A, compared with the
healthy controls, the expression levels of MAPK14, SLC2A3 and PGD
were significantly increased in patients with KD. However, the
expression levels of SAT1, TLR4 and EPAS1 did not differ
significantly between the two groups. These clinical validation
results suggested that MAPK14, SLC2A3 and PGD have the potential to
serve as diagnostic biomarkers for KD. Meanwhile, the present study
also provided a set of 6 ferroptosis-related markers for future
research.
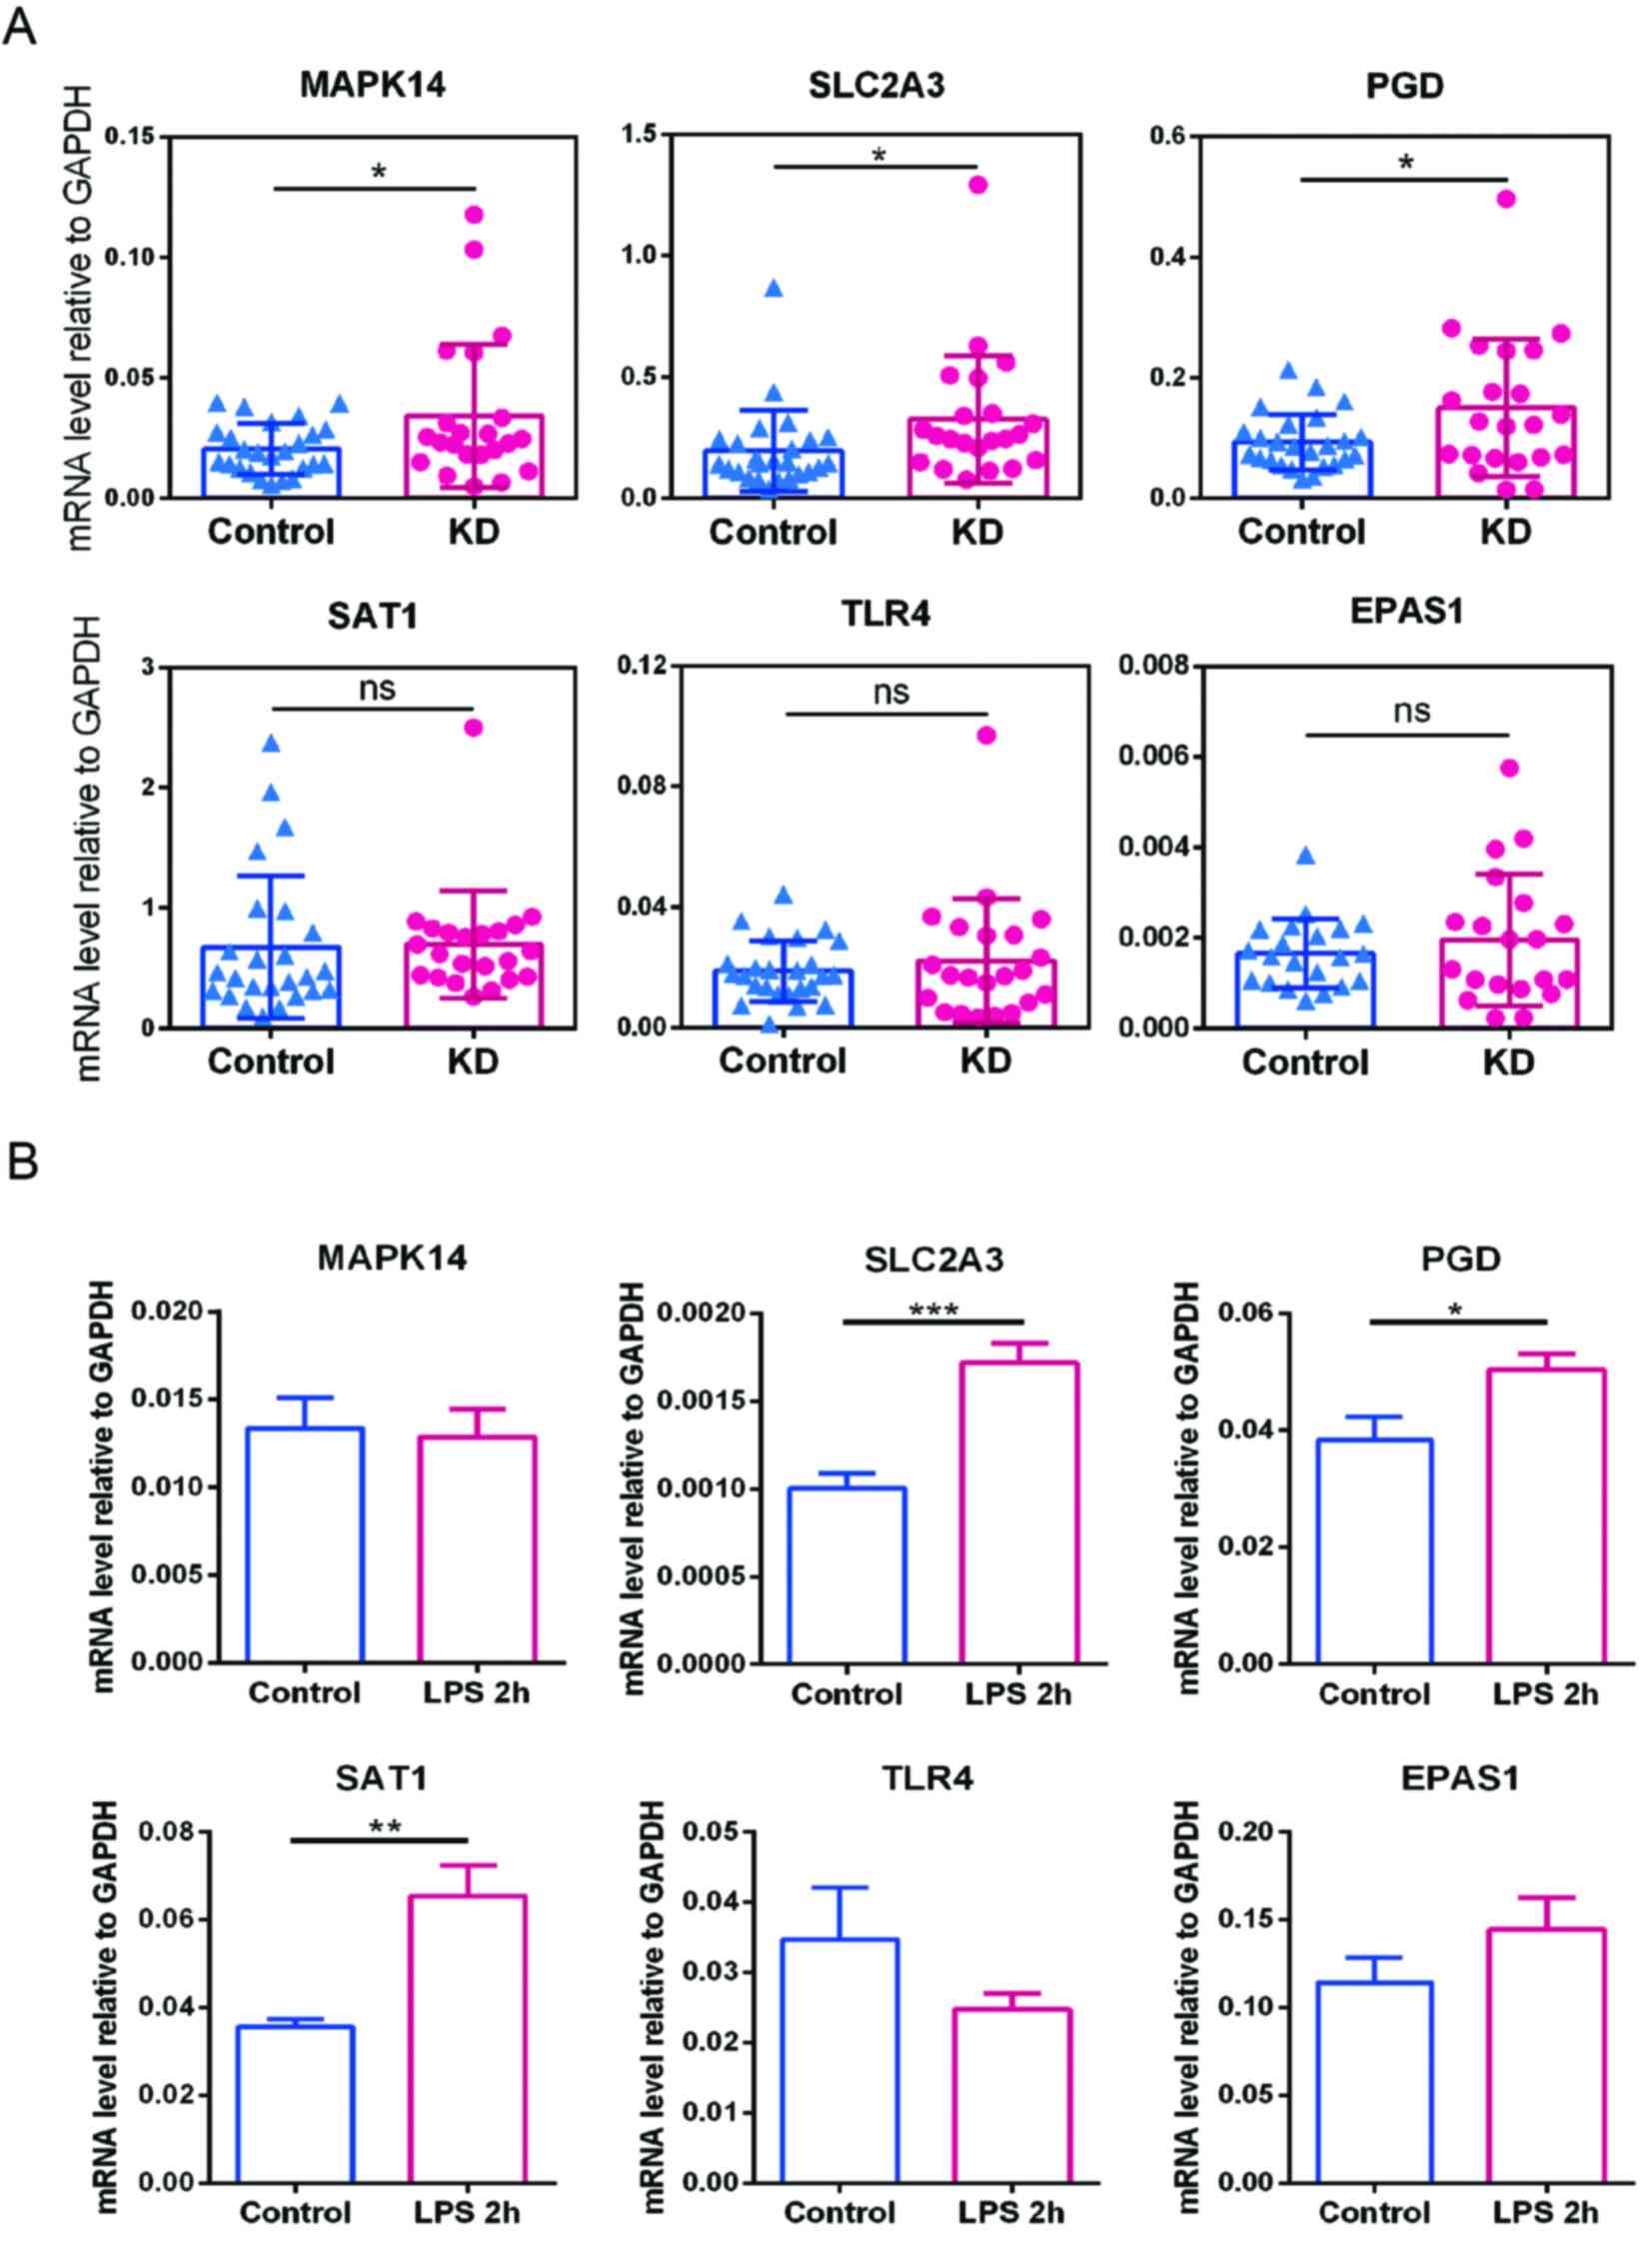 | Figure 10Expression levels of the key markers
in clinical samples and endothelial cells. (A) Expression levels of
EPAS1, MAPK14, SLC2A3, PGD, SAT1 and TLR4 in KD and healthy control
samples from Shenzhen Baoan Women's and Children's Hospital were
analyzed using RT-qPCR, with GAPDH used as the housekeeping gene.
(B) Expression levels of the key markers in human umbilical vein
endothelial cells treated with vehicle (control) or LPS for 2 h
were determined by RT-qPCR. Values represent the mRNA level
relative to GAPDH. Data are presented as the mean ± SD of three
samples from one experiment and is representative of three
independent experiments. *P<0.05,
**P<0.01 and ***P<0.001. KD, Kawasaki
disease; RT-qPCR, reverse transcription-quantitative PCR; LPS,
lipopolysaccharide; ns, no statistical significance. |
KD is mainly characterized by acute systemic
vasculitis, and the seasonality and prevalence of high incidence
areas indicate that KD is caused by infectious factors (9). Therefore, to construct a cellular
model to explore the alteration of candidate markers in the early
onset of KD, HUVECs were treated with the endotoxin, LPS, to induce
an inflammatory response. The expression levels of MAPK14, SLC2A3,
PGD, SAT1, TLR4 and EPAS1 in HUVECs were then measured by RT-qPCR.
The expression levels of SLC2A3, PGD and SAT1 were significantly
upregulated in LPS-stimulated HUVECs compared with the controls
(Fig. 10B). These results
suggested that SLC2A3, PGD and SAT1 are closely related to the
early progression of KD and thus may be potential therapeutic
targets.
Discussion
KD is an acute febrile pediatric disease with
systemic vasculitis as the main lesion; however, its etiology and
pathogenesis are currently unknown. Without timely diagnosis and
intervention, 25-30% of patients with KD become susceptible to
coronary artery abnormalities (4);
therefore, early detection and diagnosis serve a crucial role in
the treatment and prognosis of this disease and can improve
outcomes. With the rapid development of gene microarray technology,
bioinformatics analysis based on altered gene expression data has
become a notable and promising approach for discovering key
biomarkers in the development and progression of various diseases
(24).
In the present study, a comprehensive bioinformatics
analysis of KD-associated microarray datasets was employed to
identify important ferroptosis-related biomarkers and investigate
their diagnostic value in KD. The gene expression profiles of two
KD datasets, GSE73461 and GSE68004 were analyzed and 1,148 DEGs,
including 10 ferroptosis-related DEGs, between the patients with KD
and healthy controls were screened (Fig. 2C). Then, using the LASSO model and
ROC curves, 6 candidate ferroptosis-related markers were acquired
from 10 FR-DEGs, which had a favorable ability to distinguish KD
samples from control samples. All these FRGs were shown to be
upregulated in patients with KD. In addition, the immune cell
infiltration landscape in the KD samples was further analyzed using
the CIBERSORT algorithm and the expression levels of immune
checkpoint genes between the two groups were determined. Finally,
the diagnostic potential of these key biomarkers for KD were
assessed and verified using the training set, validation set, and
clinical samples.
In the present study, GSVA revealed that in the
early stages of KD, the high-expression group of key marker genes
was mainly associated with innate immune signaling pathways
(Toll-like receptor, RIG-I-like receptor and Nod-like receptor
signaling pathways), carbohydrate metabolism, B-cell receptor
signaling pathway and fatty acid metabolism. By contrast, the
low-expression group of the marker genes was mainly enriched in
adaptive immune response-related processes (such as primary
immunodeficiency, T-cell receptor signaling pathway, antigen
processing and antigen presentation), cardiac muscle contraction
and the Wnt signaling pathway. These findings are similar to those
of a previous study (25). It is
now generally accepted that multiple viruses, bacteria and fungi as
well as certain environmental triggers can induce KD (8,26).
Pathogenic microorganisms produce specific molecular motifs,
including lipopeptides, peptidoglycans and endotoxins, which are
known as pathogen-associated molecular patterns (PAMPs) and
microbe-associated molecular patterns (MAMPs). The innate immune
system of the host can express pattern recognition receptors (PRRs)
(such as TLRs, RLRs and NLRs) to recognize these dangerous PAMPs
and MAMPs and thus elicit innate immune responses (27). This may be why the innate immune
signaling pathway was shown to be enriched in the present
study.
Qian et al (28) reported that the upregulated proteins
in patients with KD were mainly associated with certain
metabolomics-related processes, such as the pentose phosphate
pathway, glycolysis and glyceraldehyde-3-phosphate processes, and
that succinic acid, which plays a pivotal role in regulating the
tricarboxylic acid (TCA) cycle, was markedly elevated in the serum
of patients with KD. The TCA cycle is the central hub and final
metabolic pathway of carbohydrate, lipid and amino acid metabolism.
This indicates that the metabolic processes of these three major
nutrients were also changed in patients with KD. Moreover, previous
studies have revealed that T-cell receptor/CD3-induced T-cell
proliferation was significantly inhibited (29), and T-cell-related response pathways
as well as antigen processing and presentation were significantly
downregulated in patients with KD, compared with normal controls
(30-32).
These findings are in line with those of the present study.
In the present study, the immune cell infiltration
profiles in the KD and healthy control samples from two training
datasets, GSE73461 and GSE68004, were investigated. The data
revealed that the infiltration levels of the innate
immunity-associated cells, monocytes, macrophage M0 and
neutrophils, were significantly higher in patients with KD than in
controls. As aforementioned, invading pathogens enter the body of
the host and trigger an inflammatory response through the innate
immune cells via PRRs. It is generally accepted that the acute
phase in patients with KD is mainly characterized by a marked
increase and significant activation of innate immune cells
(33). Furthermore, γδ T cells are
mainly involved in the innate immune response, and the infiltration
of γδ T cells was shown to be significantly elevated in KD in the
present study, consistent with previous findings (30). By contrast, the present results
revealed that the infiltration scores of most cells related to
adaptive immunity, including CD8 T cells, CD4 naïve T cells,
resting CD4 memory T cells, resting NK cells and activated NK
cells, were notably lower in patients with KD. These findings
suggest that the progression of KD is accompanied by abnormalities
in adaptive immunity. Popper et al (34) reported that in the acute phase of
KD, CD8 cells, T cells and NK cells adhere to the arterial walls
and that their expression levels are highly associated with KD
progression. In addition, Xie et al (35) noted a marked increase in the
abundance of B cells and CD8 T cell subtypes in the coronary
arteries of patients with KD. These findings indicate that CD8 T
cells, NK cells and B cells are recruited into the arterial walls,
particularly the coronary arteries, during the acute phase of KD,
which may be why the infiltration levels of these cells were
reduced in the peripheral blood mononuclear cells of patients in
the present study. Thus, an in-depth understanding of the changes
and functions of immune cells, particularly B cells and different
subtypes of T cells, in patients with KD is important for the
diagnosis and early-stage treatment of KD.
In the present study, 6 ferroptosis-related markers,
which are closely associated with immunity and metabolism and may
serve an important role in the progression of KD, were screened for
future research. These markers showed favorable diagnostic
performance in the training and validation sets, and their
diagnostic values were also evaluated using RT-qPCR in blood
samples from Kawasaki patients and controls. A total of three of
the FRG markers (MAPK14, SLC2A3 and PGD) were selected as key
biomarkers for the diagnosis of KD based on the clinical sample
validation data.
MAPK14 (also known as p38α MAPK) is the most highly
expressed isomer out of the four isomers of p38 MAPK, and can be
activated by a variety of environmental factors and extracellular
stimuli, including LPS, pro-inflammatory cytokines (such as IL-1
and TNF-α), chemokines, endotoxins, oxidative stress, hypoxia and
heat shock (36). MAPK14 has been
proven to serve a key role in normal inflammatory activation and
immune responses and represents a valuable pharmaceutical target
for treating chronic and acute inflammatory diseases (37). Additionally, MAPK14 is involved in
guiding the cellular response to various extracellular stresses and
regulating numerous biological processes, including cell
proliferation, differentiation, survival and apoptosis (36). Based on the results of the
bioinformatics analysis and clinical validation performed in this
study, it is hypothesized that MAPK14 may serve as an early
diagnostic marker for KD.
SLC2A3 is a member of the glucose transport protein
family, also known as glucose transporter 3. Glucose transport
proteins have a crucial role in cellular glucose transport. A
recent study has shown that SLC2A3 expression is elevated in
patients with inflammation and sepsis (38); however, SLC2A3 expression has rarely
been studied in KD. Reddy et al (39) found that upon LPS stimulation, sugar
uptake was increased and the SLC2A3 expression levels were
significantly elevated in murine macrophages. Moreover, Fu et
al (40) reported a significant
increase in SLC2A3 protein levels in lymphocytes when the immune
system was activated. In the present study, an increase in
carbohydrate metabolism that was primarily manifested by elevated
glucose utilization during the course of infection and inflammation
in patients with KD was noted, which may be the cause of the
observed elevated SLC2A3 levels. Therefore, SLC2A3 is likely to be
involved in the pathogenesis of KD and may be a potential
diagnostic marker for this disease.
PGD is involved in the redox reaction of the
substrate, phosphogluconate, and is a key enzyme in the pentose
phosphate pathway, a major source of intracellular NADPH. An
increasing number of studies have revealed that PGD is upregulated
in various cancer types, which may be associated with cancer
metastasis and poor prognosis, and plays a role in tumor
immunotherapy (41,42). However, to the best of our
knowledge, whether PGD has a role in KD has not yet been studied.
In the present study, the results of the database and clinical
validation analysis revealed that PGD was highly expressed in
patients with early-stage KD. Therefore, it is hypothesized that
PGD may have a notable role in the development of KD. However,
further experiments are needed to verify this hypothesis. In short,
the 3 biomarkers identified in the present study, could effectively
differentiate between KD and healthy controls, either alone or in
combination; therefore, they may serve as potential diagnostic
markers for this disease.
In the present study, cross-sectional studies were
used to identify the most important FRGs in KD. A cross-sectional
study is mainly conducted at the same time or over a shorter period
of time. It focuses on comparing different variables of different
groups and on revealing the effects of different factors on the
subjects. A longitudinal study, also called a tracking study, which
is a long-term study that tracks changes in diseases, health
conditions, and other factors in the same specific group over time.
It is more concerned with identifying patterns of change and trends
over time, and the factors that lead to these changes. The two
research methods have their own advantages, limitations and
applications. In the present study, the differences in gene
expression between patients with KD and controls were compared to
find the FRG markers that play a key role in the early stage of KD.
Cross-sectional studies were therefore the most appropriate
choice.
Individual variability in gene expression, including
FRGs, may exist in patients with KD. This variability can be caused
by a variety of factors, including different genetic backgrounds,
different causes of the disease and different environmental
factors. All of these may lead to individual differences in gene
expression in patients with KD. Individual variability makes it
difficult to identify consistent FRGs. Certain genes may be
significantly up- or down-regulated in some patients but not in
others. This narrows the range of candidate genes. However,
individual differences are not unique to KD; they are common to
numerous diseases. In the present study, after integrative
bioinformatics analysis, consistent ferroptosis-related biomarkers
were still found in patients with KD. Strategies to improve this
problem are usually to increase the sample size and to improve
capturing the variability in gene expression through larger group
analyses.
The present study still has certain limitations.
Firstly, there are very few KD datasets in public databases, and
even fewer datasets that meet our research needs and in which
patients have not been treated with IVIG as a therapy. The authors
were only able to find 3 KD datasets that met the requirements of
the present study, and the sample size was relatively small. Small
sample sizes may affect the statistical power of a study. This is
mainly because small sample sizes may lead to a reduced ability to
detect effect size, which can increase the likelihood of false
negatives. Therefore, large sample sizes are needed in future
studies to increase the generalizability of the study. Secondly,
although the diagnostic ability of the marker genes identified by
the comprehensive analysis was clinically validated, the clinical
sample size was small. Hence, future prospective research with a
larger sample size is needed for further verification to obtain
more convincing findings. Furthermore, studies on the biological
roles and mechanisms of the key genes were lacking. To gain a
deeper insight to the exact roles of these biomarkers in the
pathogenesis of KD and their associated regulatory mechanisms,
future experiments should focus on understanding their functions
and signaling pathways. In addition, since the LASSO model also has
certain limitations, other machine learning algorithms or
multi-model comparisons could be used in future studies to more
comprehensively identify potential key biomarkers in KD. Last, a
small number of patients who were unsure about the use of
medication or who had other underlying medical conditions may not
have been excluded from the cohort. As such relevant information
was not easy to find in the datasets, the authors were unable to
make adjustments during the analysis. Future studies should
consider other potential medical conditions or medications that may
affect biomarker levels, and find effective adjustment methods in
the analysis process.
In conclusion, the infiltration landscapes of immune
cells and the expression of immune checkpoint genes in patients
with KD were investigated in the present study. Using integrated
bioinformatics analyses, 6 important FRGs that are closely
associated with KD were identified. Of these genes, MAPK14, SLC2A3
and PGD could effectively discriminate patients with KD from the
controls, as demonstrated through clinical validation, and may
serve as significant biomarkers for KD diagnosis. These findings
not only indicate the importance of FRGs in the early prediction
and treatment of KD, but also provide new insights into the
pathogenesis underlying this disease.
Supplementary Material
GSVA of the signaling pathways of the
ferroptosis-related markers. (A-D) Differences in the Kyoto
Encyclopedia of Genes and Genomes pathways identified by GSVA
between the high and low expression group of (A) MAPK14, (B) PGD,
(C) TLR4 and (D) EPAS1. The T-values shown are from a linear model.
The red and green columns indicate the signaling pathways enriched
in the high and low gene expression groups, respectively. GSVA,
gene set variation analysis.
Ferroptosis-related genes
Prediction of drugs targeting
ferroptosis-related markers.
Acknowledgements
The authors would like to thank Mr Dede Xu (Haining
Annealing Clinical Testing Laboratory Company, LTD.) for his help
in bioinformatics analysis.
Funding
Funding: The present study was supported by the research fund of
National Natural Science Foundation of China (grant no. 82101804),
the Basic research project of Shenzhen Science and Technology
Innovation Program (grant no. JCYJ20220530160015034) and the
High-level Medical Team Project in Baoan, Shenzhen (grant no.
202404).
Availability of data and materials
The data generated in the present study may be found
in the GEO under accession numbers GSE73461, GSE68004 and GSE18606
or at the following URL: https://www.ncbi.nlm.nih.gov/geo/query/acc.cgi?acc=GSE73461;
https://www.ncbi.nlm.nih.gov/geo/query/acc.cgi?acc=GSE68004;
and https://www.ncbi.nlm.nih.gov/geo/query/acc.cgi?acc=GSE18606.
The data generated in the present study are included in the figures
and/or tables of this article.
Authors' contributions
TZ and RY conceived the idea and devised the study.
RY performed the bioinformatics analysis and conducted laboratory
experiments. SC performed the data analyses and prepared figures
and/or tables. XL acquired patient samples and collected patient
data. JL conducted the statistical analyses and interpreted the
findings. RY and TZ wrote and revised the manuscript. SC and TZ
confirm the authenticity of all the raw data. All authors read and
approved the final version of the manuscript.
Ethics approval and consent to
participate
The study procedure was approved (approval. no.
LLSC-2023-03-09-04-KS) by the Medical Ethics Committee of Shenzhen
Baoan Women's and Children's Hospital of Jinan University
(Shenzhen, China). Informed consent was acquired from the
participants' legal guardian.
Patient consent for publication
Not applicable.
Competing interests
The authors declare that they have no competing
interests.
References
|
1
|
Ramphul K and Mejias SG: Kawasaki disease:
A comprehensive review. Arch Med Sci Atheroscler Dis. 3:e41–e45.
2018.PubMed/NCBI View Article : Google Scholar
|
|
2
|
Senzaki H: Long-term outcome of Kawasaki
disease. Circulation. 118:2763–2772. 2008.PubMed/NCBI View Article : Google Scholar
|
|
3
|
Newburger JW, Takahashi M and Burns JC:
Kawasaki disease. J Am Coll Cardiol. 67:1738–1749. 2016.PubMed/NCBI View Article : Google Scholar
|
|
4
|
McCrindle BW, Rowley AH, Newburger JW,
Burns JC, Bolger AF, Gewitz M, Baker AL, Jackson MA, Takahashi M,
Shah PB, et al: Diagnosis, treatment, and long-term management of
kawasaki disease: A scientific statement for health professionals
from the American heart association. Circulation. 135:e927–e999.
2017.PubMed/NCBI View Article : Google Scholar
|
|
5
|
Duan C, Du ZD, Wang Y and Jia LQ: Effect
of pravastatin on endothelial dysfunction in children with medium
to giant coronary aneurysms due to Kawasaki disease. World J
Pediatr. 10:232–237. 2014.PubMed/NCBI View Article : Google Scholar
|
|
6
|
Singh S, Vignesh P and Burgner D: The
epidemiology of Kawasaki disease: A global update. Arch Dis Child.
100:1084–1088. 2015.PubMed/NCBI View Article : Google Scholar
|
|
7
|
Kainth R and Shah P: Kawasaki disease:
Origins and evolution. Arch Dis Child. 106:413–414. 2021.PubMed/NCBI View Article : Google Scholar
|
|
8
|
Dietz SM, van Stijn D, Burgner D, Levin M,
Kuipers IM, Hutten BA and Kuijpers TW: Dissecting Kawasaki disease:
A state-of-the-art review. Eur J Pediatr. 176:995–1009.
2017.PubMed/NCBI View Article : Google Scholar
|
|
9
|
Nakamura A, Ikeda K and Hamaoka K:
Aetiological significance of infectious stimuli in Kawasaki
disease. Front Pediatr. 7(244)2019.PubMed/NCBI View Article : Google Scholar
|
|
10
|
Rypdal M, Rypdal V, Burney JA, Cayan D,
Bainto E, Skochko S, Tremoulet AH, Creamean J, Shimizu C, Kim J and
Burns JC: Clustering and climate associations of Kawasaki disease
in San Diego County suggest environmental triggers. Sci Rep.
8(16140)2018.PubMed/NCBI View Article : Google Scholar
|
|
11
|
Singh S, Jindal AK and Pilania RK:
Diagnosis of Kawasaki disease. Int J Rheum Dis. 21:36–44.
2018.PubMed/NCBI View Article : Google Scholar
|
|
12
|
Ng YM, Sung RYT, So LY, Fong NC, Ho MH,
Cheng YW, Lee SH, Mak WC, Wong DM, Yam MC, et al: Kawasaki disease
in Hong Kong, 1994 to 2000. Hong Kong Med J. 11:331–335.
2005.PubMed/NCBI
|
|
13
|
Jiang X, Stockwell BR and Conrad M:
Ferroptosis: Mechanisms, biology and role in disease. Nat Rev Mol
Cell Biol. 22:266–282. 2021.PubMed/NCBI View Article : Google Scholar
|
|
14
|
Angeli JPF, Shah R, Pratt DA and Conrad M:
Ferroptosis inhibition: Mechanisms and opportunities. Trends
Pharmacol Sci. 38:489–498. 2017.PubMed/NCBI View Article : Google Scholar
|
|
15
|
Stockwell BR, Friedmann Angeli JP, Bayir
H, Bush AI, Conrad M, Dixon SJ, Fulda S, Gascón S, Hatzios SK,
Kagan VE, et al: Ferroptosis: A regulated cell death nexus linking
metabolism, redox biology, and disease. Cell. 171:273–285.
2017.PubMed/NCBI View Article : Google Scholar
|
|
16
|
Matsushita M, Freigang S, Schneider C,
Conrad M, Bornkamm GW and Kopf M: T cell lipid peroxidation induces
ferroptosis and prevents immunity to infection. J Exp Med.
212:555–568. 2015.PubMed/NCBI View Article : Google Scholar
|
|
17
|
Wu X, Qin K, Iroegbu CD, Xiang K, Peng J,
Guo J, Yang J and Fan C: Genetic analysis of potential biomarkers
and therapeutic targets in ferroptosis from coronary artery
disease. J Cell Mol Med. 26:2177–2190. 2022.PubMed/NCBI View Article : Google Scholar
|
|
18
|
Wen H, Hun M, Zhao M, Han P and He Q:
Serum ferritin as a crucial biomarker in the diagnosis and
prognosis of intravenous immunoglobulin resistance and coronary
artery lesions in Kawasaki disease: A systematic review and
meta-analysis. Front Med (Lausanne). 9(941739)2022.PubMed/NCBI View Article : Google Scholar
|
|
19
|
Wright VJ, Herberg JA, Kaforou M, Shimizu
C, Eleftherohorinou H, Shailes H, Barendregt AM, Menikou S, Gormley
S, Berk M, et al: Diagnosis of Kawasaki disease using a minimal
whole-blood gene expression signature. JAMA Pediatr.
172(e182293)2018.PubMed/NCBI View Article : Google Scholar
|
|
20
|
Jaggi P, Mejias A, Xu Z, Yin H,
Moore-Clingenpeel M, Smith B, Burns JC, Tremoulet AH,
Jordan-Villegas A, Chaussabel D, et al: Whole blood transcriptional
profiles as a prognostic tool in complete and incomplete Kawasaki
disease. PLoS One. 13(e0197858)2018.PubMed/NCBI View Article : Google Scholar
|
|
21
|
Fury W, Tremoulet AH, Watson VE, Best BM,
Shimizu C, Hamilton J, Kanegaye JT, Wei Y, Kao C, Mellis S, et al:
Transcript abundance patterns in Kawasaki disease patients with
intravenous immunoglobulin resistance. Hum Immunol. 71:865–873.
2010.PubMed/NCBI View Article : Google Scholar
|
|
22
|
Newman AM, Liu CL, Green MR, Gentles AJ,
Feng W, Xu Y, Hoang CD, Diehn M and Alizadeh AA: Robust enumeration
of cell subsets from tissue expression profiles. Nat Methods.
12:453–457. 2015.PubMed/NCBI View Article : Google Scholar
|
|
23
|
Livak KJ and Schmittgen TD: Analysis of
relative gene expression data using real-time quantitative PCR and
the 2(-Delta Delta C(T)) method. Methods. 25:402–408.
2001.PubMed/NCBI View Article : Google Scholar
|
|
24
|
Li Y, Li Y, Bai Z, Pan J, Wang J and Fang
F: Identification of potential transcriptomic markers in developing
pediatric sepsis: A weighted gene co-expression network analysis
and a case-control validation study. J Transl Med.
15(254)2017.PubMed/NCBI View Article : Google Scholar
|
|
25
|
Hara T, Nakashima Y, Sakai Y, Nishio H,
Motomura Y and Yamasaki S: Kawasaki disease: A matter of innate
immunity. Clin Exp Immunol. 186:134–143. 2016.PubMed/NCBI View Article : Google Scholar
|
|
26
|
Jackson H, Menikou S, Hamilton S, McArdle
A, Shimizu C, Galassini R, Huang H, Kim J, Tremoulet A, Thorne A,
et al: Kawasaki disease patient stratification and pathway analysis
based on host transcriptomic and proteomic profiles. Int J Mol Sci.
22(5655)2021.PubMed/NCBI View Article : Google Scholar
|
|
27
|
Shao Y, Saredy J, Yang WY, Sun Y, Lu Y,
Saaoud F, Drummer C IV, Johnson C, Xu K, Jiang X, et al: Vascular
endothelial cells and innate immunity. Arterioscler Thromb Vasc
Biol. 40:e138–e152. 2020.PubMed/NCBI View Article : Google Scholar
|
|
28
|
Qian G, Xu L, Qin J, Huang H, Zhu L, Tang
Y, Li X, Ma J, Ma Y, Ding Y and Lv H: Leukocyte proteomics coupled
with serum metabolomics identifies novel biomarkers and abnormal
amino acid metabolism in Kawasaki disease. J Proteomics.
239(104183)2021.PubMed/NCBI View Article : Google Scholar
|
|
29
|
Kuijpers TW, Wiegman A, van Lier RA, Roos
MT, Wertheim-van Dillen PM, Pinedo S and Ottenkamp J: Kawasaki
disease: A maturational defect in immune responsiveness. J Infect
Dis. 180:1869–1877. 1999.PubMed/NCBI View
Article : Google Scholar
|
|
30
|
Ikeda K, Yamaguchi K, Tanaka T, Mizuno Y,
Hijikata A, Ohara O, Takada H, Kusuhara K and Hara T: Unique
activation status of peripheral blood mononuclear cells at acute
phase of Kawasaki disease. Clin Exp Immunol. 160:246–255.
2010.PubMed/NCBI View Article : Google Scholar
|
|
31
|
Hoang LT, Shimizu C, Ling L, Naim AN, Khor
CC, Tremoulet AH, Wright V, Levin M, Hibberd ML and Burns JC:
Global gene expression profiling identifies new therapeutic targets
in acute Kawasaki disease. Genome Med. 6(541)2014.PubMed/NCBI View Article : Google Scholar
|
|
32
|
Hara T, Yamamura K and Sakai Y: The
up-to-date pathophysiology of Kawasaki disease. Clin Transl
Immunology. 10(e1284)2021.PubMed/NCBI View Article : Google Scholar
|
|
33
|
Sakurai Y: Autoimmune aspects of Kawasaki
disease. J Investig Allergol Clin Immunol. 29:251–261.
2019.PubMed/NCBI View Article : Google Scholar
|
|
34
|
Popper SJ, Shimizu C, Shike H, Kanegaye
JT, Newburger JW, Sundel RP, Brown PO, Burns JC and Relman DA:
Gene-expression patterns reveal underlying biological processes in
Kawasaki disease. Genome Biol. 8(R261)2007.PubMed/NCBI View Article : Google Scholar
|
|
35
|
Xie Z, Huang Y, Li X, Lun Y, Li X, He Y,
Wu S, Wang S, Sun J and Zhang J: Atlas of circulating immune cells
in Kawasaki disease. Int Immunopharmacol.
102(108396)2022.PubMed/NCBI View Article : Google Scholar
|
|
36
|
Cargnello M and Roux PP: Activation and
function of the MAPKs and their substrates, the MAPK-activated
protein kinases. Microbiol Mol Biol Rev. 75:50–83. 2011.PubMed/NCBI View Article : Google Scholar
|
|
37
|
Zheng T, Zhang B, Chen C, Ma J, Meng D,
Huang J, Hu R, Liu X, Otsu K, Liu AC, et al: Protein kinase p38α
signaling in dendritic cells regulates colon inflammation and
tumorigenesis. Proc Natl Acad Sci USA. 115:E12313–E12322.
2018.PubMed/NCBI View Article : Google Scholar
|
|
38
|
Yan R and Zhou T: Identification of key
biomarkers in neonatal sepsis by integrated bioinformatics analysis
and clinical validation. Heliyon. 8(e11634)2022.PubMed/NCBI View Article : Google Scholar
|
|
39
|
Reddy ABM, Srivastava SK and Ramana KV:
Aldose reductase inhibition prevents lipopolysaccharide-induced
glucose uptake and glucose transporter 3 expression in RAW264.7
macrophages. Int J Biochem Cell Biol. 42:1039–1045. 2010.PubMed/NCBI View Article : Google Scholar
|
|
40
|
Fu Y, Maianu L, Melbert BR and Garvey WT:
Facilitative glucose transporter gene expression in human
lymphocytes, monocytes, and macrophages: A role for GLUT isoforms
1, 3, and 5 in the immune response and foam cell formation. Blood
Cells Mol Dis. 32:182–190. 2004.PubMed/NCBI View Article : Google Scholar
|
|
41
|
Khan GB, Qasim M, Rasul A, Ashfaq UA and
Alnuqaydan AM: Identification of Lignan compounds as new
6-phosphogluconate dehydrogenase inhibitors for lung cancer.
Metabolites. 13(34)2022.PubMed/NCBI View Article : Google Scholar
|
|
42
|
Liu T, Qi J, Wu H, Wang L, Zhu L, Qin C,
Zhang J and Zhu Q: Phosphogluconate dehydrogenase is a predictive
biomarker for immunotherapy in hepatocellular carcinoma. Front
Oncol. 12(993503)2022.PubMed/NCBI View Article : Google Scholar
|


