Introduction
Breast cancer (BC) is currently the most prevalent
cancer and the leading cause of cancer death in women, accounting
for 25% of all cancers and 15% of cancer deaths worldwide (1). The main factor leading to the
difficulty of treatment is the high heterogeneity of BC, which is
susceptible to relapse and metastasis (2). At present, it is mainly based on the
TNM stage and estrogen receptor (ER), progesterone receptor (PR)
and human epidermal growth factor receptor 2 (HER2) to predict the
prognosis of BC and guide treatment. However, patients with the
same molecular subtypes have different responses to treatment,
resulting in different outcomes (3,4).
Therefore, further searching for molecular therapeutic targets of
BC and constructing its prognostic model have become the focus of
research.
Necroptosis is a new form of programmed necrotic
cell death, which is similar to apoptosis in mechanism and necrosis
in morphology (5). When
necroptosis occurs, the cell membrane breaks and the cell contents
are released, which leads to a severe inflammatory response that
does not depend on caspase (6,7).
Necroptosis is regulated by the receptor interacting protein kinase
3 (RIPK3) and the mixed lineage kinase domain-like (MLKL)
pseudokinase (8). Emerging data
indicated that necroptosis plays a considerable role in
tumorigenesis, tumor progression and regulation of tumor immunity
(9). In the past decade,
necroptosis has been studied in a variety of cancers, most of which
show low expression of RIPK3 or MLKL in tumors, which is related to
short survival time and poor prognosis (10,11).
It has been reported that necrotic apoptosis is the main form of
tumor cell death in mouse BC model (12). Therefore, inducing necroptosis of
BC cells can become a new and promising therapeutic strategy for
BC.
Immunotherapy for cancer has changed the course of
cancer treatment (13). Although
immunotherapy for BC helps to improve the overall survival (OS)
rate of patients, the current response rate of immunotherapy (such
as checkpoint blocking) is only 10-30% (14). Therefore, it is necessary to find a
new way of immunotherapy for BC. In tumor microenvironment (TME),
necroptosis can increase tumor antigen load, enhance antitumor
immunity, and cooperate with immune checkpoint blocking to promote
lasting tumor clearance (15).
However, there is significant intratumoral heterogeneity in immune
cell infiltration (16). A recent
study has shown that single-cell RNA-sequencing (RNA-seq)
technology plays an important role in analyzing the
immunosuppressive microenvironment of metastatic BC (17). Therefore, identifying BC immune
cell subpopulations at the single-cell level and exploring the
expression of necroptosis genes will contribute to the
immunotherapy of BC.
In the present study, it was aimed to
comprehensively analyze the expression pattern of necroptosis
related-genes (NRGs) in BC, construct NRGs' signature to predict
the prognosis of patients with BC, and explore the relationship
between necroptosis and BC tumour immune microenvironment (TIME) at
the single-cell level. It was found that NRGs were highly active in
CD4+ T cells and differentially expressed in their
developmental trajectories. Then, based on NRGs, three
necroptosis-associated subtypes that could also differentiate
patient outcomes were found. Next, a new prognostic model based on
NRGs, which could effectively predict the prognosis of patients
with BC, was constructed and validated. Finally, the prognostic
genes were analyzed from the perspectives of immune checkpoints,
immune cell infiltration and somatic mutations, revealing that they
could serve as a novel potential BC prognostic biomarker.
Materials and methods
Data acquisition and processing
The BC related single-cell dataset GSE114724 was
downloaded from the GEO database (https://www.ncbi.nlm.nih.gov/geo/) through the
GEOquery package. The data source is Homo sapiens, and its
data platform is GPL16791. A total of three BC samples were
selected for follow-up analysis: GSM3148575, GSM3148577 and
GSM3148578. Sample GSM3148575 included 7,096 cells, sample
GSM3148577 included 4,926 cells and sample GSM3148577 included
5,232 cells.
In the present study, R packet ‘Seurat’ (18) was used to create single-cell data
as Seurat objects, and the proportion of mitochondria in each cell
was calculated by the ‘PercentageFeatureSet’ function of Seurat
package. Low-quality cells were excluded based on three quality
measures: Mitochondrial gene content >5%, feature <500, and
unique molecular identifier (UMI) count >20,000. After the
aforementioned steps, 10,261 cells were obtained.
Subsequently, the samples were integrated and the
Canonical Correlation Analysis (CCA) method was used to remove the
batch effect. For Seurat objects, linear dimensionality reduction
was performed and the most variable genes expressed in the dataset
were used to calculate principal component (PC). Then, the
‘FindNeighbors’ and ‘FindClusters’ functions of Seurat were used to
group the cells into the optimal number of cluster in order to
identify the cell types, and Uniform Manifold Approximation and
Projection (UMAP) was used to reduce the information captured in
the selected important PCs to two dimensions, and the visual
clustering of cells was realized based on graphics.
BC transcriptome data was downloaded from The Cancer
Genome Atlas Genomic Data Commons (TCGA GDC) official website
(https://portal.gdc.cancer.gov/), and the
selected data type was Fragments Per Kilobase Million. And the
clinical data of patients with BC were downloaded from the TCGA GDC
website (n=1,285). After removing samples that lacked clinical
information, TCGA-BC included 878 BC samples and 41 paracancerous
tissue samples. Details of patients with BC are listed in Table I.
 | Table ITCGA-breast cancer sample baseline
data in TCGA database. |
Table I
TCGA-breast cancer sample baseline
data in TCGA database.
|
Characteristics | Number of cases
(%) |
|---|
| T stage | |
|
T1 | 236(27) |
|
T2 | 515(59) |
|
T3 | 97(11) |
|
T4 | 30(3) |
| N stage | |
|
N0 | 429(49) |
|
N1 | 299(34) |
|
N2 | 96(11) |
|
N3 | 54(6) |
| M stage | |
|
M0 | 860(98) |
|
M1 | 18(2) |
| Overall
survival | |
|
Dead | 130(15) |
|
Alive | 748(85) |
| Sex | |
|
Female | 867(99) |
|
Male | 11(1) |
In addition, the BC dataset GSE42568 was downloaded
from the GEO database through the GEOquery package to verify the
accuracy of the prognostic model. The GSE42568(19) data set comes from Homo
sapiens, and its data platform is GPL570. It contains a total
of 121 samples, including 104 cases of BC and 17 cases of normal
samples. BC samples were selected from these samples for survival
analysis.
In the present study, NRGs were obtained from
previous literature for follow-up analysis, including 101 NRGs
(Table SI) (20). At the same time, the immune
checkpoint genes (ICGs) were obtained from the previous literature
for follow-up analysis; a total of 47 ICGs were obtained (Table SII) (21). To analyze somatic mutations in TCGA
patients with BC, ‘TCGAbiolinks’ R package was used to download the
patient's ‘Masked Copy Number Segment’ data (n=897).
Cell annotation
A total of 14 clusters were visualized by UMAP, and
7 different cell types were revealed by artificial annotation of
cell type marker genes, including B cells, CD4+ T cell,
CD8+ T cell, progenitor cells, endothelial cells,
natural killer (NK) T cells and regulatory T cells. Cell group
marker genes were displayed in Table
II. In order to understand the expression pattern of diagnostic
markers in patients with BC, the differences of gene expression
were compared in different cell groups.
| Table IICell population marker gene
information. |
Table II
Cell population marker gene
information.
|
Cluster/subsets | Cells (N) | Marker gene |
|---|
| CD8+ T
cells | 2804 | GZMK, CD8A,
KRT86 |
| CD4+ T
cells | 1337 | IL7R, CCR7 |
| B cells | 1720 | KLF2, SELL |
| Progenitor
cells | 81 | MCM7, TUBA1B |
| Endothelial
cells | 30 | STMN1, HMGN2 |
| Regulatory T
cells | 1647 | IL2RA, FOXP3 |
| Natural killer T
cells | 2642 | ZNF683, MT-ND6 |
Identification of differential genes
in cell groups
For the seven cell groups that had been annotated,
the function ‘FindAllMarkers’ was used to calculate the
differential genes among all cell groups, and the genes selected
according to the criteria of |log2FoldChange|>0.25 and P<0.05
were used as the single-cell differentially expressed genes
(scDEGs) for further study. Then, NRGs and scDEGs were intersected,
and the obtained genes were used as the key genes in the present
study.
Using AUCell to score the cell
populations
AUCell could identify cells with active gene sets in
single-cell RNA-seq data. AUCell used ‘Area Under Curve’ (AUC) to
calculate whether the key subset of the input gene set was enriched
in the expressed genes of each cell. Key genes for AUCell scoring
were selected and high-scoring cell populations were searched.
Gene Ontology (GO) and Kyoto
Encyclopedia of Genome and Genomes (KEGG) pathway functional
enrichment analysis
The differential genes in CD4+ T cell
population were analyzed by GO annotation and KEGG pathway
enrichment analysis using ‘clusterProfiler’ package of R, and the
critical value of FDR <0.05 was considered to be statistically
significant. The first 8 results with the lowest P-value of
biological processes (BP), cellular components (CC) and molecular
functions (MF) in GO and the top 10 results with the lowest P-value
of KEGG were shown in bar chart and bubble chart, respectively.
Pseudotime analysis
Pseudotime analysis could arrange each cell on the
corresponding track according to the time sequence gene expression,
and divide the sample into several differentiated cell groups
according to the gene expression status to generate an intuitive
tree map of pedigree development, which could predict the
differentiation and development trajectory of cells. For the
subsets of CD4+ T cells, pseudotime analysis was used to
predict the differentiation and development of subsets, and the
changes of NRGs during the pseudotime process were analyzed.
Disease typing based on key genes
Consistent clustering is a method that could
determine the number and members of possible clusters in a dataset.
The R-packet ‘ConsensusClusterPlus’ was used to cluster the TCGA-BC
dataset consistently using the aforementioned key genes in order to
improve distinguishing different subtypes of BC. In addition, PC
analysis (PCA) was used to analyze different BC molecular
subtypes.
Construction of prognostic risk model
based on key genes
In order to determine the effect of key genes on the
prognosis of patients with BC, the Least Absolute Shrinkage and
Selection Operator (LASSO) algorithm was used to construct the
prognostic risk model of BC. The ‘glmnet’ package of R was used to
select the LASSO feature genes. The selected features were screened
in the process of model construction, and the genes in the best
model were selected as the BC prognostic genes. Finally, according
to the risk regression coefficients of all genes in the model, a
formula for calculating the risk score was constructed:
In the present study, a prognostic risk model for BC
samples was constructed from TCGA datasets, and R-packet ‘maxstat’
was used to calculate the best cut-off value of the ability to
predict the survival time of patients with BC. Based on cut-off
value, the patients were divided into high- and low-risk groups.
The Kaplan-Meier (KM) method of R-packet ‘survival’ was used for
survival analysis, and R-packet ‘survminer’ was used to visualize
the results. In addition, GEO datasets were used to validate the
prognostic model.
Evaluation model of prognostic risk
model
Based on the TCGA-BC dataset, univariate and
multivariate COX regression analysis was used to evaluate the
ability of risk scores combined with clinicopathological features
of patients with BC to predict OS, and the results were shown
through forest maps. In addition, according to the clinical
information of the sample in the present study, R-packet ‘rms’ was
used to construct a line chart to study the relationship between
clinical factors and prognosis, and the calibration curves of 1-,
3- and 5-year, respectively, were drawn.
Immune infiltration analysis
CIBERSORT (22)
calculation method was used to analyze the data of high- and
low-risk groups in TCGA-BC dataset to obtain immune infiltration
information, and R ‘ggplot2’ package was used to draw a bar chart
to show the distribution of 22 kinds of immune cell infiltration in
each sample. Subsequently, a heat map was drawn to reflect the
correlation between prognostic genes and immune cells. Finally, the
scores of different immune cells were compared between high- and
low-risk groups, so as to obtain immune cells with different
infiltration levels between the two groups.
In the study of Ru et al (23), the data of 28 kinds of immune cells
were collected, R-packet Gene Set Variation Analysis was used to
explore the difference of immune infiltration among different BC
molecular subtypes, and the results were shown by box chart.
Estimate
In the present study, Estimate R package was used to
estimate the proportion of immune components and stromal components
of each sample in TME in the form of ImmuneScore, StromalScore and
ESTIMATEScore. The higher the score, the greater the proportion of
corresponding components in TME.
Analysis of somatic mutation and
differential expression of HLA gene family
R-packet ‘maftools’ was used to visualize somatic
mutations in high- and low-risk groups in TCGA-BC datasets, and the
mutation differences between the two groups were compared; the
results were shown in the waterfall map. At the same time, the
differential expression of human leukocyte antigen (HLA) family
genes was analyzed in high- and low-risk groups.
Cell culture
The MDA-MB-231 cell line (CL-0150, Procell Life
Science & Technology Co., Ltd.) was cultured at 37˚C with 5%
CO2 in DMEM (cat. no. PM150210; Procell Life Science
& Technology Co., Ltd.) with 10% fetal bovine serum (FBS) (cat.
no. 10091148; Gibco; Thermo Fisher Scientific, Inc.), 100 µg/ml
streptomycin and 100 U/ml penicillin (cat. no. SV30010; Hyclone;
Cytiva). The MCF10A cell line (cat. no. CRL-10317; Shanghai Zhong
Qiao Xin Zhou Biotechnology Co., Ltd.) was cultured in 37˚C, 5%
CO2, complete medium (cat. no. ZQ-1311; Shanghai Zhong
Qiao Xin Zhou Biotechnology Co., Ltd.) containing 5% horse serum
and 1% penicillin/streptomycin (Hyclone; Cytiva). MCF-7 cells were
borrowed from Key Laboratory of Fertility maintenance, Ministry of
Education (Professor Jing Chen). However, appropriate measures were
received to ensure that the source and quality of these cells were
reliable, and these cells were used for the present research to
explore some of the characteristics of BC.
Reverse transcription-quantitative
(RT-qPCR)
Total RNA was isolated using TRIZOL (Ambion; Thermo
Fisher Scientific, Inc.). Afterwards, the RNA underwent
phenol-chloroform extractions to further purify it. The quantity
and quality (the acceptable ratio of A260/A280 was ≤1.8 and ≥2.2)
of the purified RNA were assessed by measuring the absorbance at
260/280 nm (A260/A280) using Nanodrop One
(NanoDrop Technologies; Thermo Fisher Scientific, Inc.). The level
of gene expression was assessed using GAPDH as a control gene. cDNA
synthesis [HiScript® III RT SuperMix for qPCR (+gDNA
wiper), Vazyme Biotech Co., Ltd.] was performed using standard
procedures (37˚C for 15 min, 85˚C for 5 sec, and then maintained at
4˚C) and RT-qPCR analysis was carried out on the Bio-Rad S1000
instrument with HieffÔ qPCR SYBR® Green Master Mix (Low
Rox Plus) (Shanghai Yeasen Biotechnology Co., Ltd.). The procedure
was as follows: 95˚C for 5 min, then 40 cycles at 95˚C for 10 sec,
and 30 sec at 60˚C. Afterwards, the concentration of each
transcript was normalized to the level of GAPDH mRNA using the
2-ΔΔCq method (24).
The primer sequences were as follows: GAPDH forward,
5'GGTCGGAGTCAACGGATTTG-3' and reverse, 5'-GGAAGATGGTGATGGGATTTC-3';
BCL2 forward, 5'-TCATGTGTGTGGAGAGCGTCAAC-3' and reverse,
5'-GTGTGCAGGTGCCGGTTCAG-3'; BIRC3 forward,
5'-TATCCACATCAGACAGCCCAGGAG-3' and reverse,
5'-TTCCACGGCAGCATTAATCACAGG-3'; AIFM1 forward,
5'-GGCGGCGGGTGCTTTGAAG-3' and reverse,
5'-CATGCCATCGCTGGAACAAGTTG-3'; IFNG forward,
5'-TGACTTGAATGTCCAACGCAAAGC-3' and reverse,
5'-CGACCTCGAAACAGCATCTGACTC-3'; and VDAC1 forward,
5'-GATTGACCCTGACGCCTGCTTC-3' and reverse,
5'-CTTGCCATCCAGAAGAGCTGACAG-3'.
Statistical analysis
All data calculation and statistical analysis were
carried out by R software (https://www.r-project.org/; 4.1.2). For the comparison
of two groups of continuous variables, the statistical significance
of normal distribution variables was estimated by independent
Student t-test, and the difference between non-normal distribution
variables was analyzed by Wilcoxon rank sum test. For the
comparison of several groups of continuous variables, ANOVA
(one-way, parametric) was used when the variance was uniform, and
Kruskal-Wallis test (non-parametric) was used when the variance was
uneven, and then Dunnett's was used for the appropriate multiple
comparison test after the occurrence of significant results. The
survival package of R was used for survival analysis, the
Kaplan-Meier survival curve was used to show the difference in
survival, and the log-rank test was used to evaluate the
significant difference in survival time between the two groups.
Univariate and multivariate Cox regression analysis was based on
survival package, and LASSO model was based on ‘glmnetR’ package.
All the statistical P-values were bilateral, and P<0.05 was
considered to indicate a statistically significant difference.
Results
Cellular heterogeneity
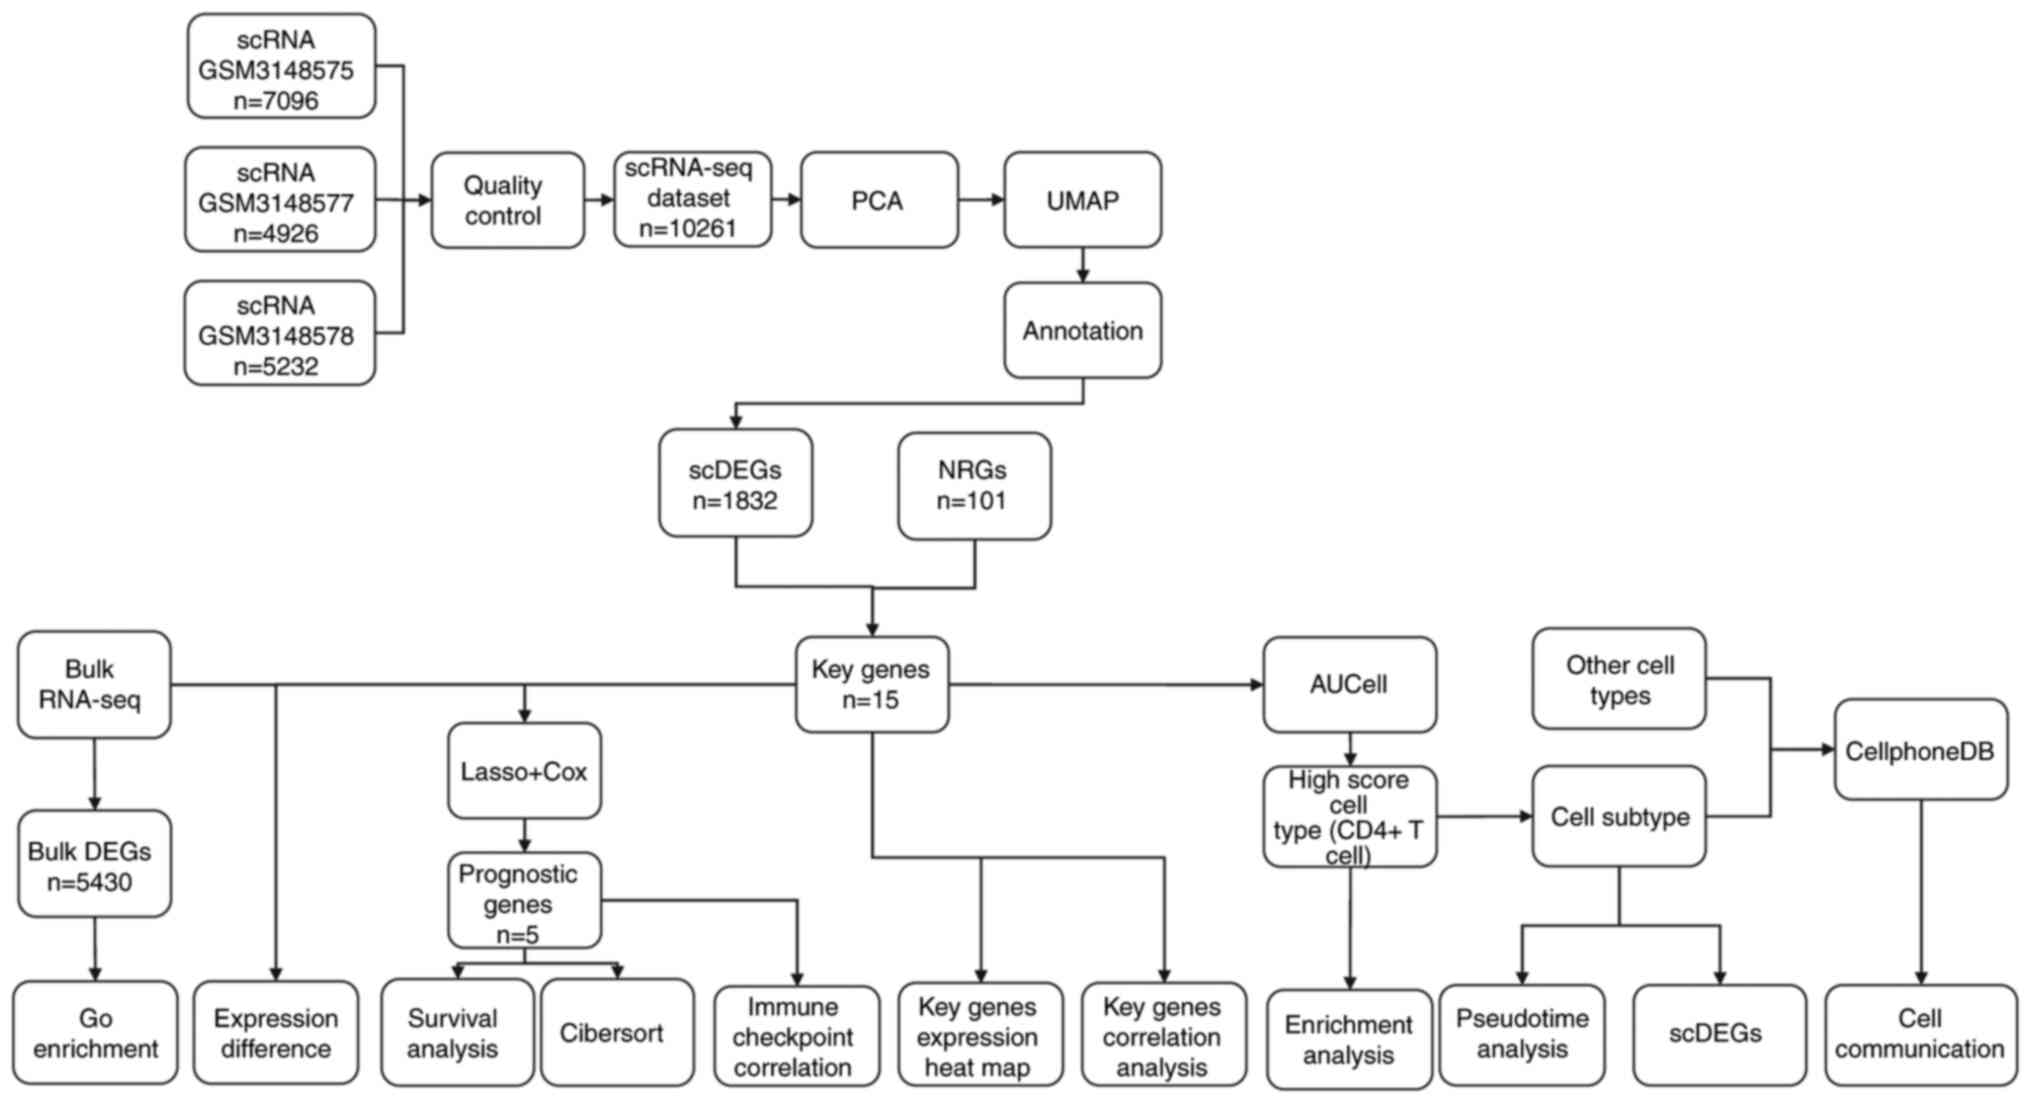
The flow chart of the overall analysis of the
present study is demonstrated in Fig.
1. The BC samples of single-cell data were integrated and CCA
method was used to remove the batch effect, and then ‘Seurat’
package was used to analyze the cellular heterogeneity of
single-cell data. After removing the cells with mitochondrial gene
content >5%, feature number <500 and UMI >20,000, the
cluster diagrams of 7 cell types in BC samples were obtained by
UMAP clustering (Fig. 2A). Then
the expression of marker genes in different cell clusters of 7
single-cell types was analyzed and shown by a bubble diagram
(Fig. 2B). It was found that there
were significant differences in marker genes' expression among
different cell clusters (Fig.
2C-K). At the same time, the expression differences among
different cell populations were analyzed and the expression heat
map of top 10 differential genes was constructed (Fig. 2L). Next, the differences in the
proportion of different cell groups in patients with BC were also
analyzed. It was found that CD8+ T cells accounted for the highest
proportion in BC samples, followed by B cells and regulatory T
cells, while progenitor cells accounted for the lowest, and other
cell types had a similar proportion (Fig. 2M).
Analysis of correlation and difference
of NRGs
For the seven cell types that had been annotated,
the function ‘FindAllMarkers’ was used to calculate the
differential genes among cell types, and a total of 1,832 scDEGs
were selected based on |log2FoldChange|>0.25 and P<0.05. A
total of 101 NRGs were obtained in the literature (18).
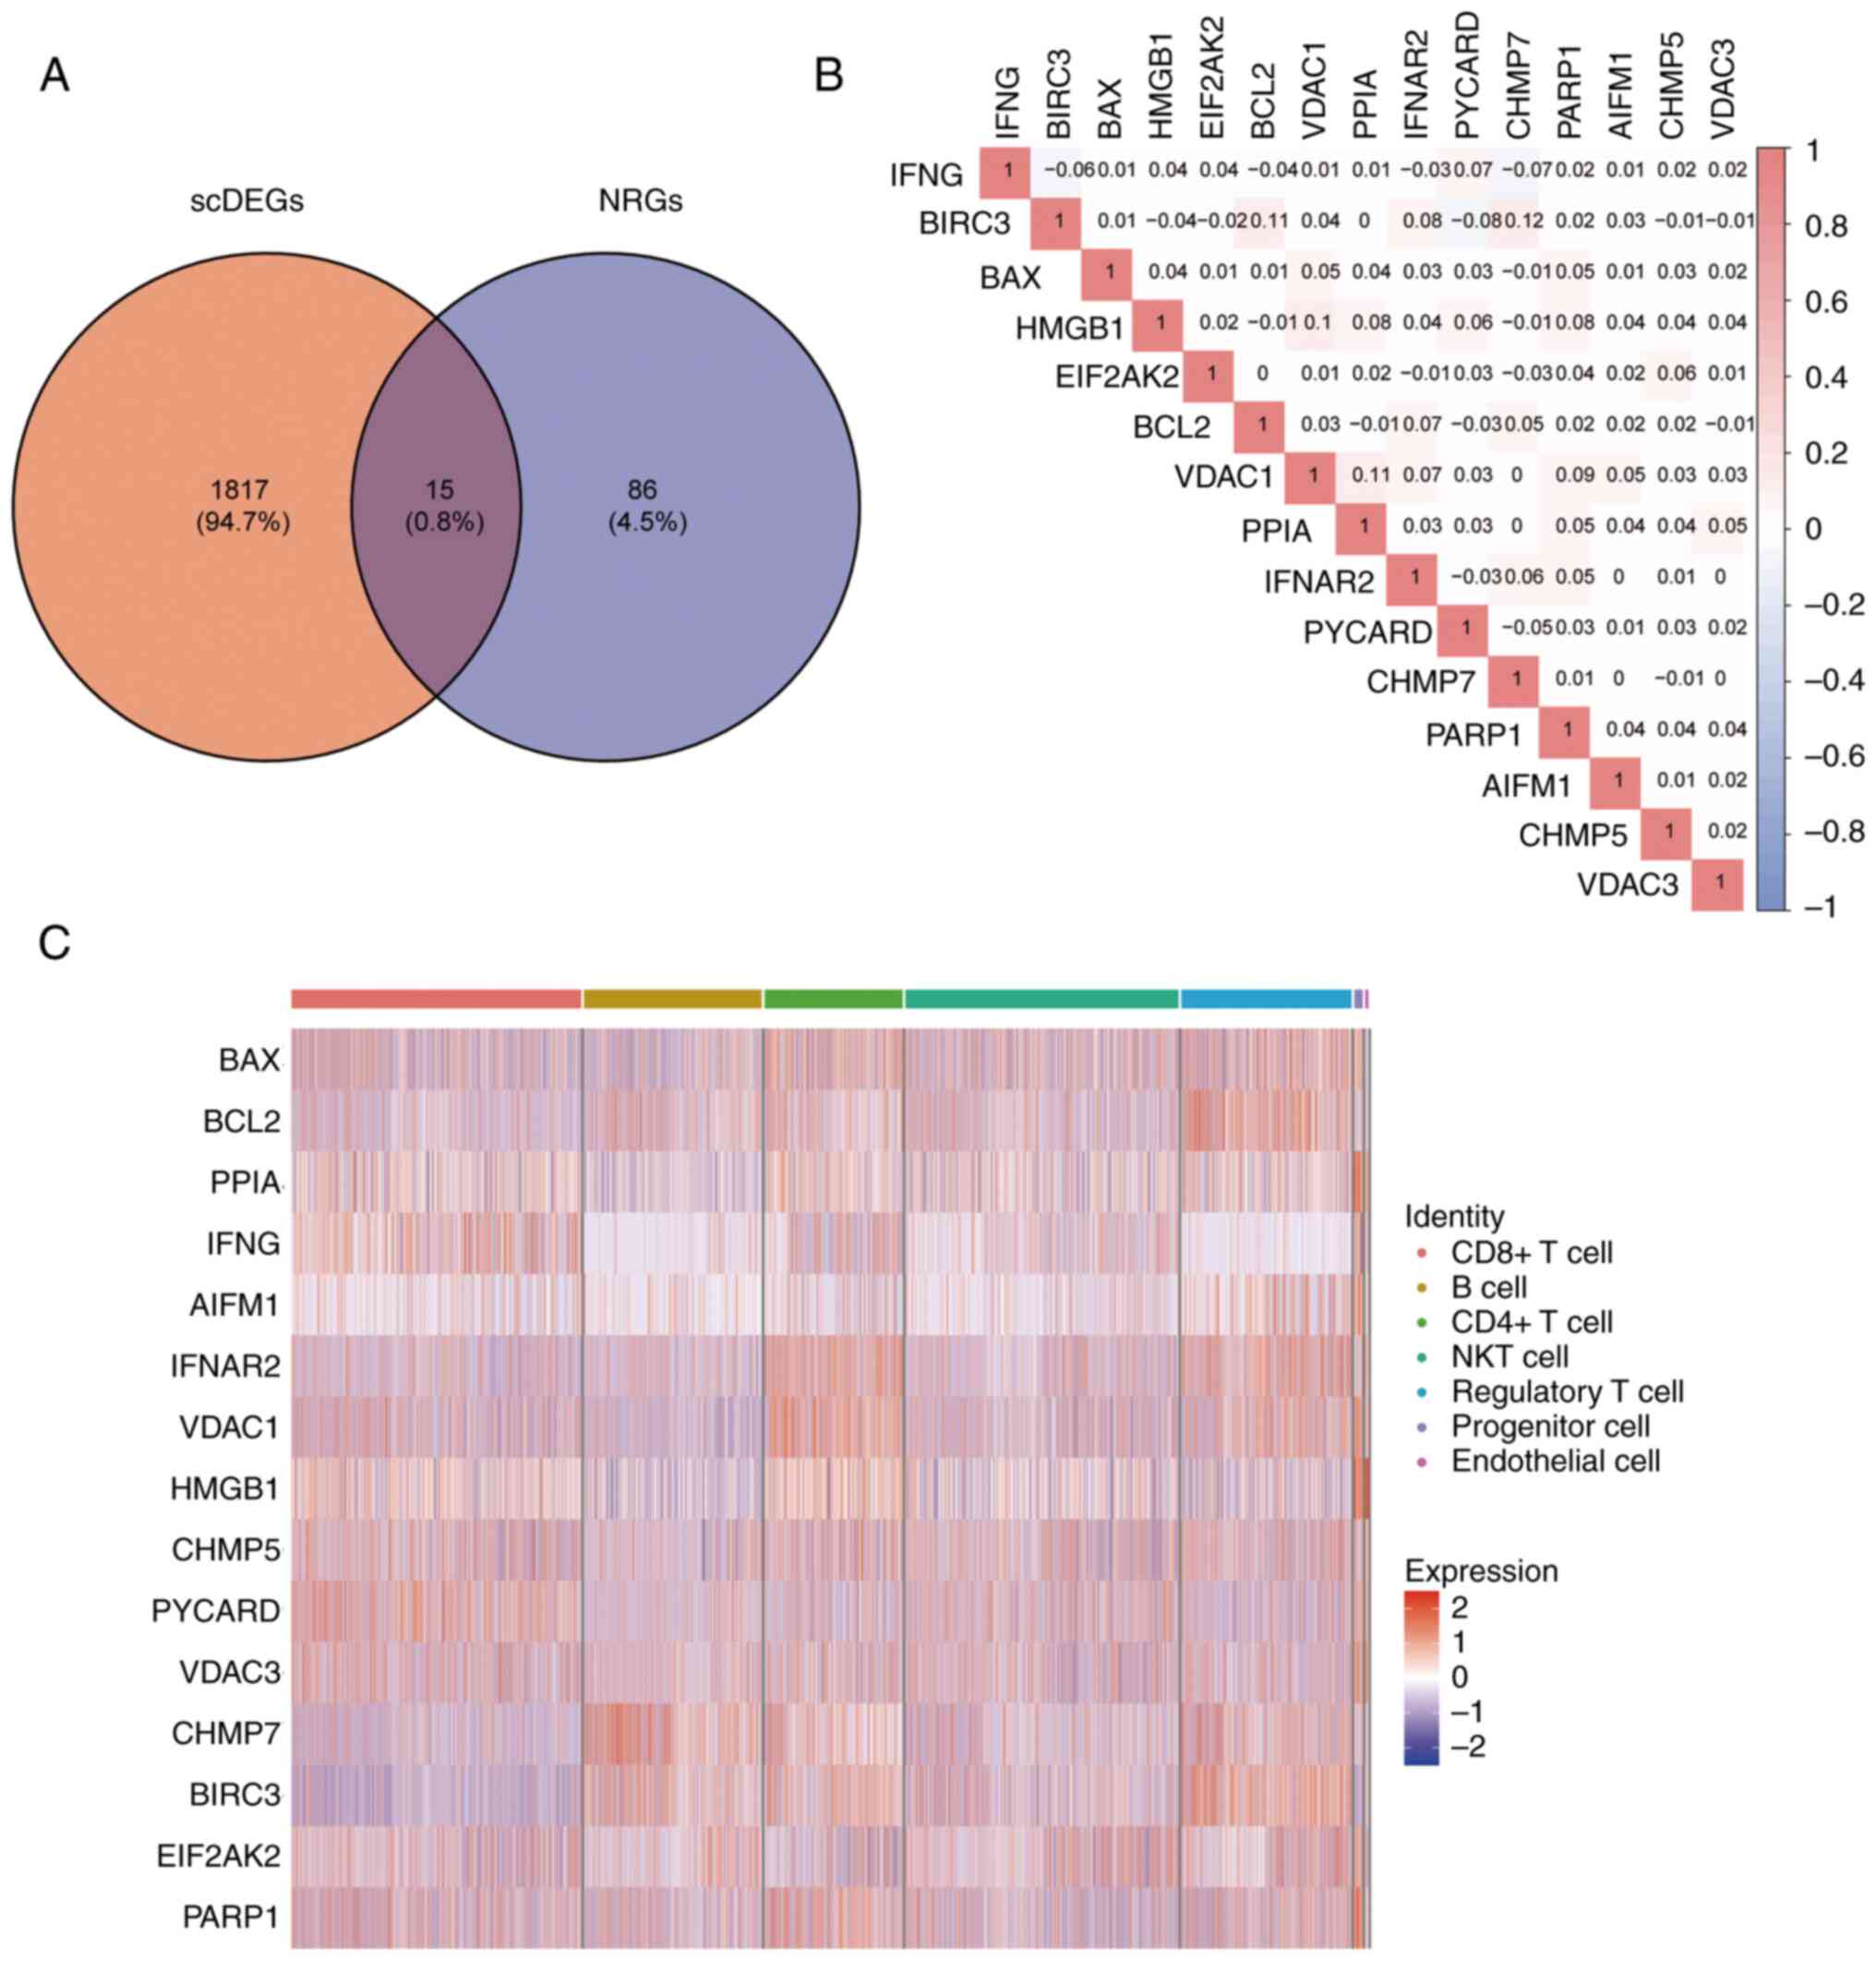
Then, the intersection of NRGs and scDEGs was received (Fig. 3A) and 15 key genes resulted for
follow-up research (BAX, BCL2, PPIA, IFNG, AIFM1, IFNAR2, VDAC1,
HMGB1, CHMP5, PYCARD, VDAC3, CHMP7, BIRC3, EIF2AK2 and PARP1).
Through Pearson correlation analysis, it was found
that there was a positive correlation in expression of most key
genes, which indicated that there might be similar expression
patterns of key genes in patients with BC (Fig. 3B). Among them, the correlation
between CHMP7 and BIRC3 was the highest, while BIRC3 and PYCARD had
the largest negative correlation. Finally, a heat map was used to
demonstrate the expression of key genes in the cell populations
(Fig. 3C).
Key genes AUCell score
In order to verify the activity of key genes in
different cell types, AUCell packages were used to demonstrate the
activity of key genes in BC samples of single-cell data sets with
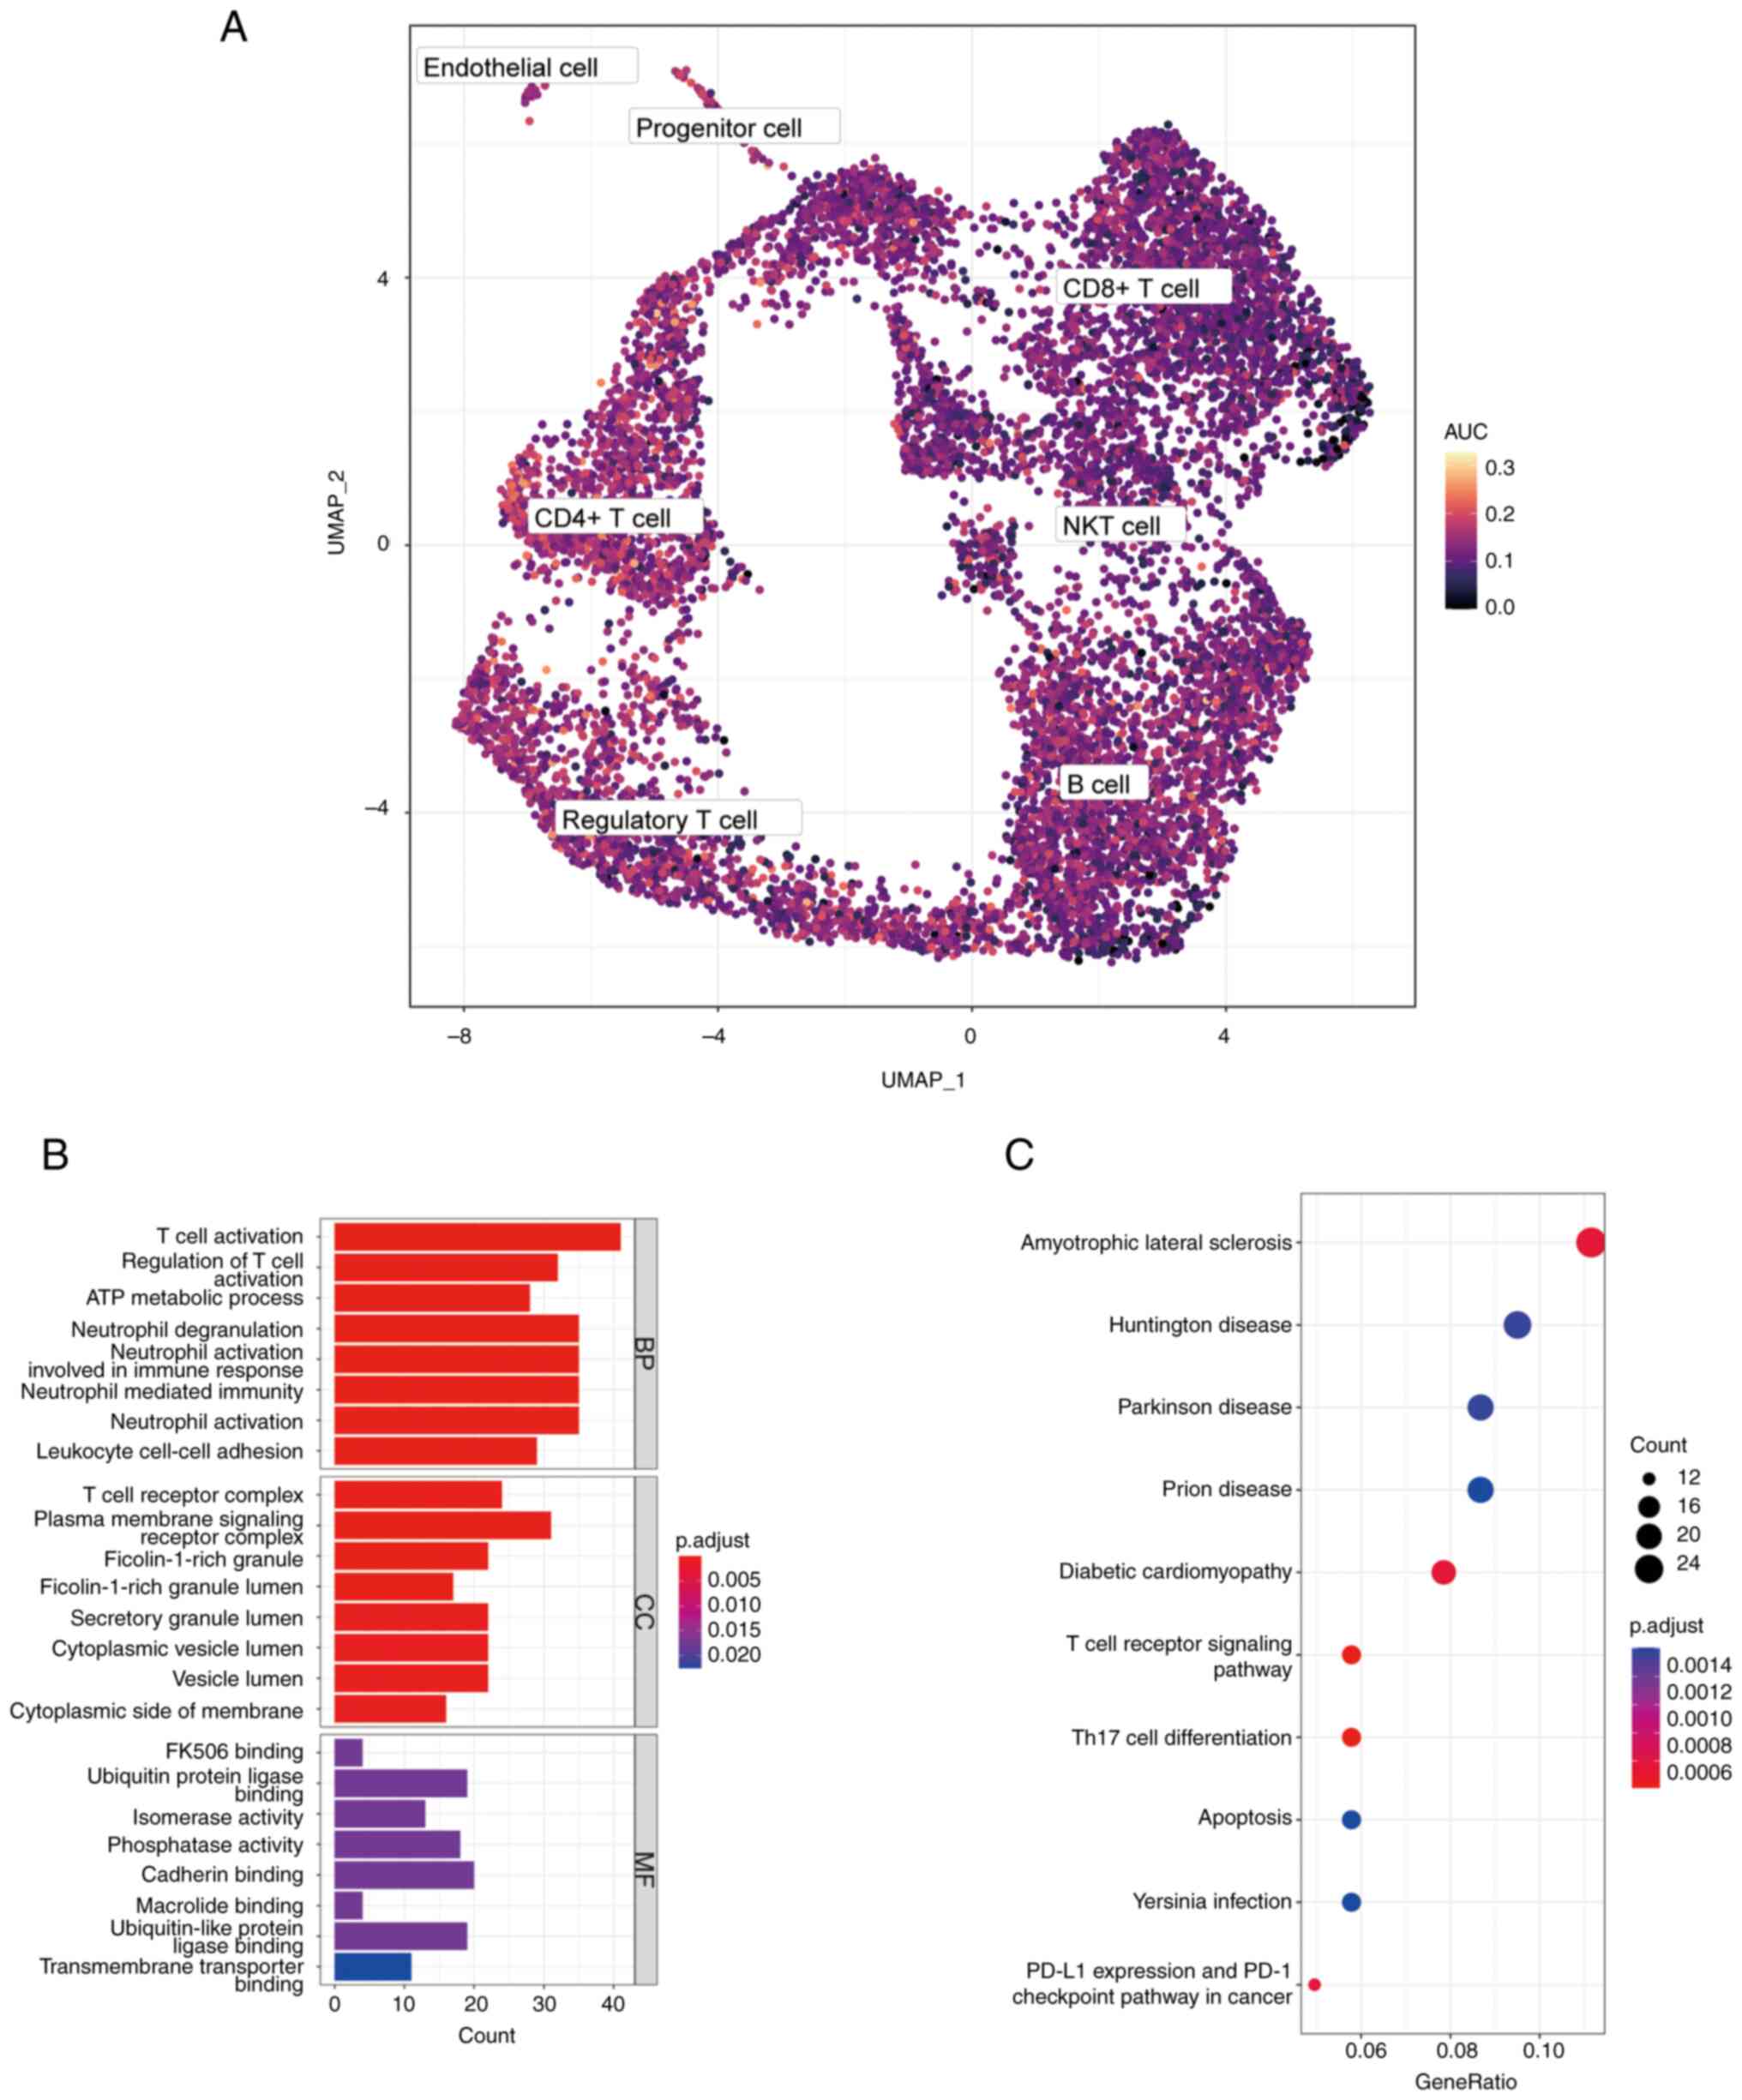
UMAP maps (Fig. 4A). Through the
UMAP map, it was found that CD4+ T cells had higher
AUCell scores, therefore CD4+ T cells were defined as
high-scoring cells with NRGs.
In order to explore whether there were significant
differences in genes between high-scoring cell population and other
cell populations, CD4+ T cells were selected as a
reference, using the function ‘FindAllMarkers’, and 499 DEGs were
screened for GO and KEGG enrichment according to the standard of
|log2FC|>0.5 and P<0.01. GO analysis revealed that DEGs were
mainly related to T cell activation and regulation of T cell
activation (Fig. 4B). KEGG
analysis demonstrated that DEGs were related to T cell receptor
signaling pathway, Th17 cell differentiation and PD-L1 expression
and PD-1 checkpoint pathways in cancer (Fig. 4C). These results suggested that
NRGs were highly active in CD4+ T cells and might be
involved in the activation of CD4+ T cells.
Analysis of new subtypes of
CD4+ T cell cluster
In order to explore new subtypes of CD4+
T cells, CD4+ T cell clusters were clustered and four
CD4+ T cell subtypes were obtained, which were then
annotated with significantly upregulated DEGs, resulting in ANXA1
CD4+ T, CCL4 CD4+ T, FASBP5 CD4+ T
and TCF7 CD4+ T cells (Fig.
5A). For these four CD4+ T cell subtypes, the
function ‘FindAllMarkers’ was used to calculate the marker genes
between them, and a violin map was employed to show the expression
of marker genes in each subtype (Fig.
5B). To verify whether there was a difference in the expression
of key genes among subsets of CD4+ T cells, a heat was
used map to demonstrate the results. It was found that there was no
difference in the expression of the majority of key genes' subsets;
only the expression of BAX2 was lower in CCL4 CD4+ T
cells (Fig. 5C). Subsequently,
pseudotime analysis was used to show the developmental trajectory
of CD4+ T cells, and the results revealed that the
developmental trajectories among the subtypes were CCL4
CD4+ T, ANXA1 CD4+ T, TCF7 CD4+ T
and FASBP5 CD4+ T cells (Fig. 5D and E). To analyze the changes in the
expression of NRGs in the developmental trajectory, the expression
of key genes was illustrated by heat maps (Fig. 5F). The expression of PYCARD, IFNG,
CHMP5, BAX, HMGB1, VDAC3, EIF2AK2 and other genes was found to be
downregulated during the development of CD4+ T cell
subtypes, while the expression of BCL2, PPIA, PARP1, VDAC1, AIFM1,
BIR3 and other genes was upregulated. This suggested that NRGs
could regulate the development of CD4+ T cell
subtypes.
Identification of BC molecular
subtypes based on key genes
The aforementioned 15 key genes were employed as
feature genes to carry out consistent clustering analysis of the
samples in the TCGA-BC dataset. The process of selecting the
k-value of the cluster is shown in Fig. 6A, and k=3 was selected as the
result of clustering (Fig. 6B).
The BC samples were divided into three disease subtypes: Subtype 1,
2 and 3. The clustering results were demonstrated by heat maps
(Fig. 6C). PCA could distinguish
different subtypes to a certain extent, indicating that there was a
certain heterogeneity between different subtypes (Fig. 6D).
Single-sample Gene Set Enrichment Analysis was used
to evaluate the differences in immune cells between BC molecular
subtypes (Fig. 6E). The results
revealed that the degree of immune cell infiltration in BC subtypes
from high to low was subtypes 3, 1 and 2. Survival differences were
then compared among the three molecular subtypes and illustrated
with a KM survival curve (Fig.
6F). It was found that the survival rate of subtypes 1 and 3
was higher than that of subtype 2 (P<0.0001), which was
consistent with a higher degree of immune cell infiltration and
improved prognosis in these subtypes.
Differential expression of key genes
in BC subtypes
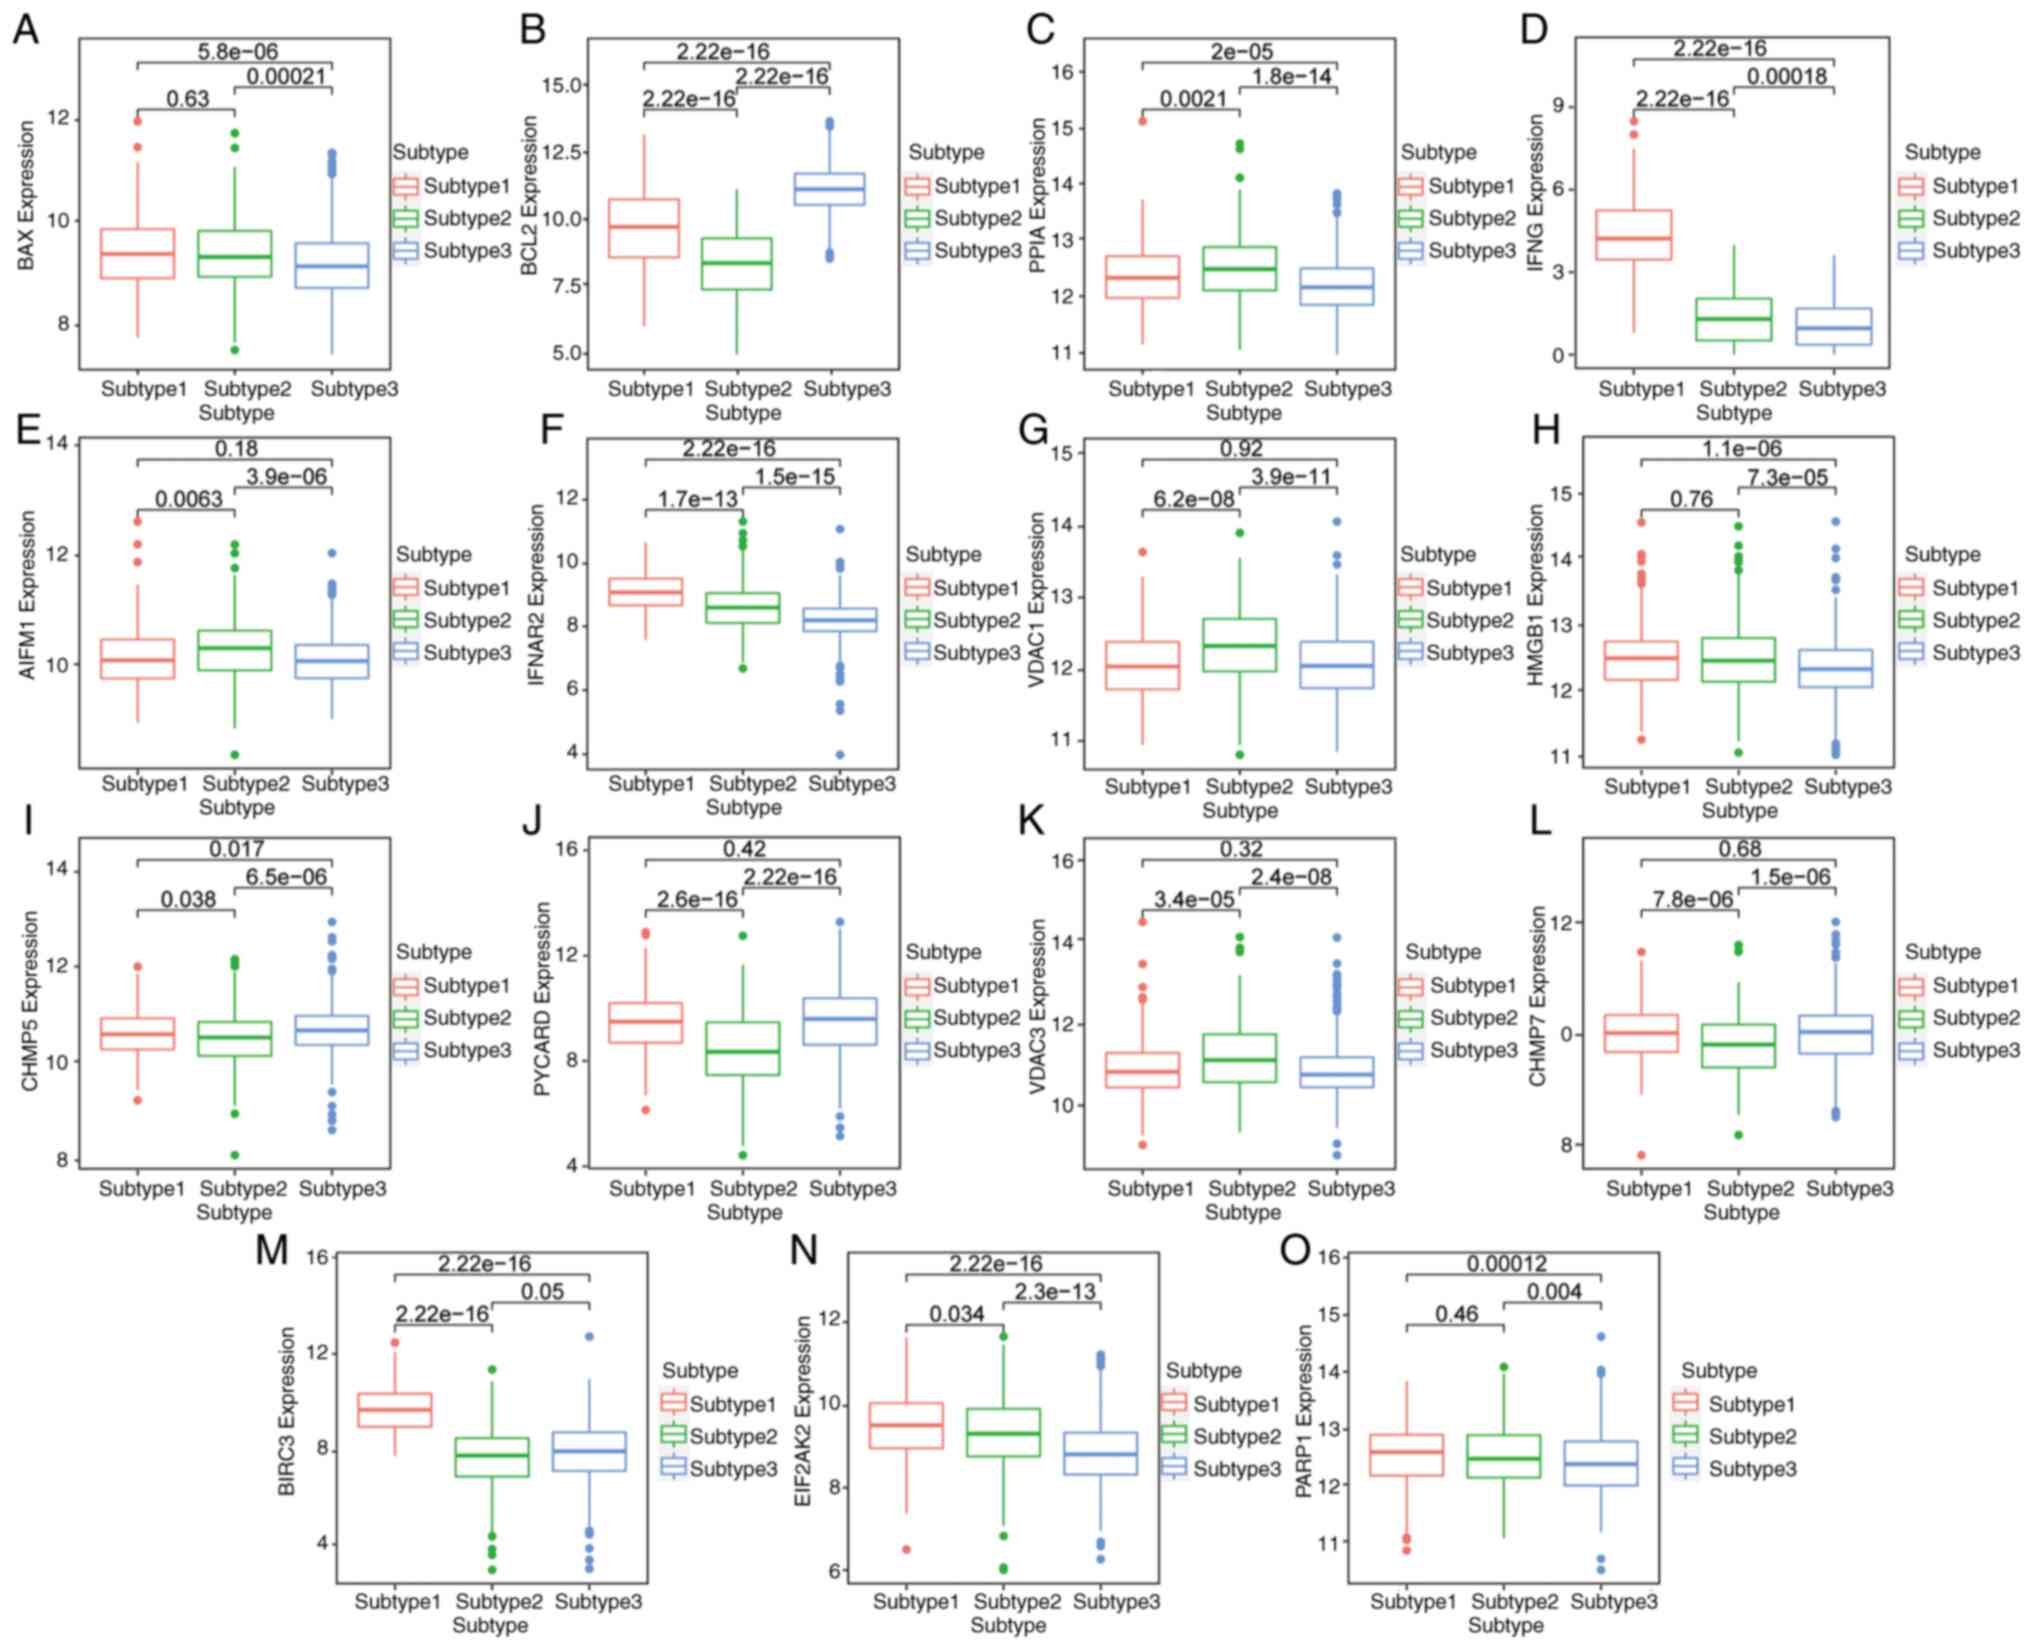
The expression of key genes among different subtypes
is shown with a box chart. The results identified that BAX, IFNG,
IFNAR2, HMGB1, CHMP7, BIRC3, EIF2AK2 and PARP1 were most highly
expressed in subtype 1 (Fig. 7A,
D, F, H,
L, M, N and
O, respectively). The expression
of PPIA, AIFM1, VDAC1 and VDAC3 was the highest in subtype 2
(Fig. 7C, E, G and
K). BCL2, CHMP5 and PYCARD were
most highly expressed in subtype 3 (Fig. 7B, I and J).
This suggested that different subtypes could be distinguished by
the expression level of key genes, and the prognosis of patients
could be predicted.
Construction of a prognostic risk
model based on key genes
To determine the prognostic genes of BC and analyze
their diagnostic ability for diseases, based on 15 key genes (BAX,
BCL2, PPIA, IFNG, AIFM1, IFNAR2, VDAC1, HMGB1, CHMP5, PYCARD,
VDAC3, CHMP7, BIRC3, EIF2AK2 and PARP1), in the TCGA-BC datasets,
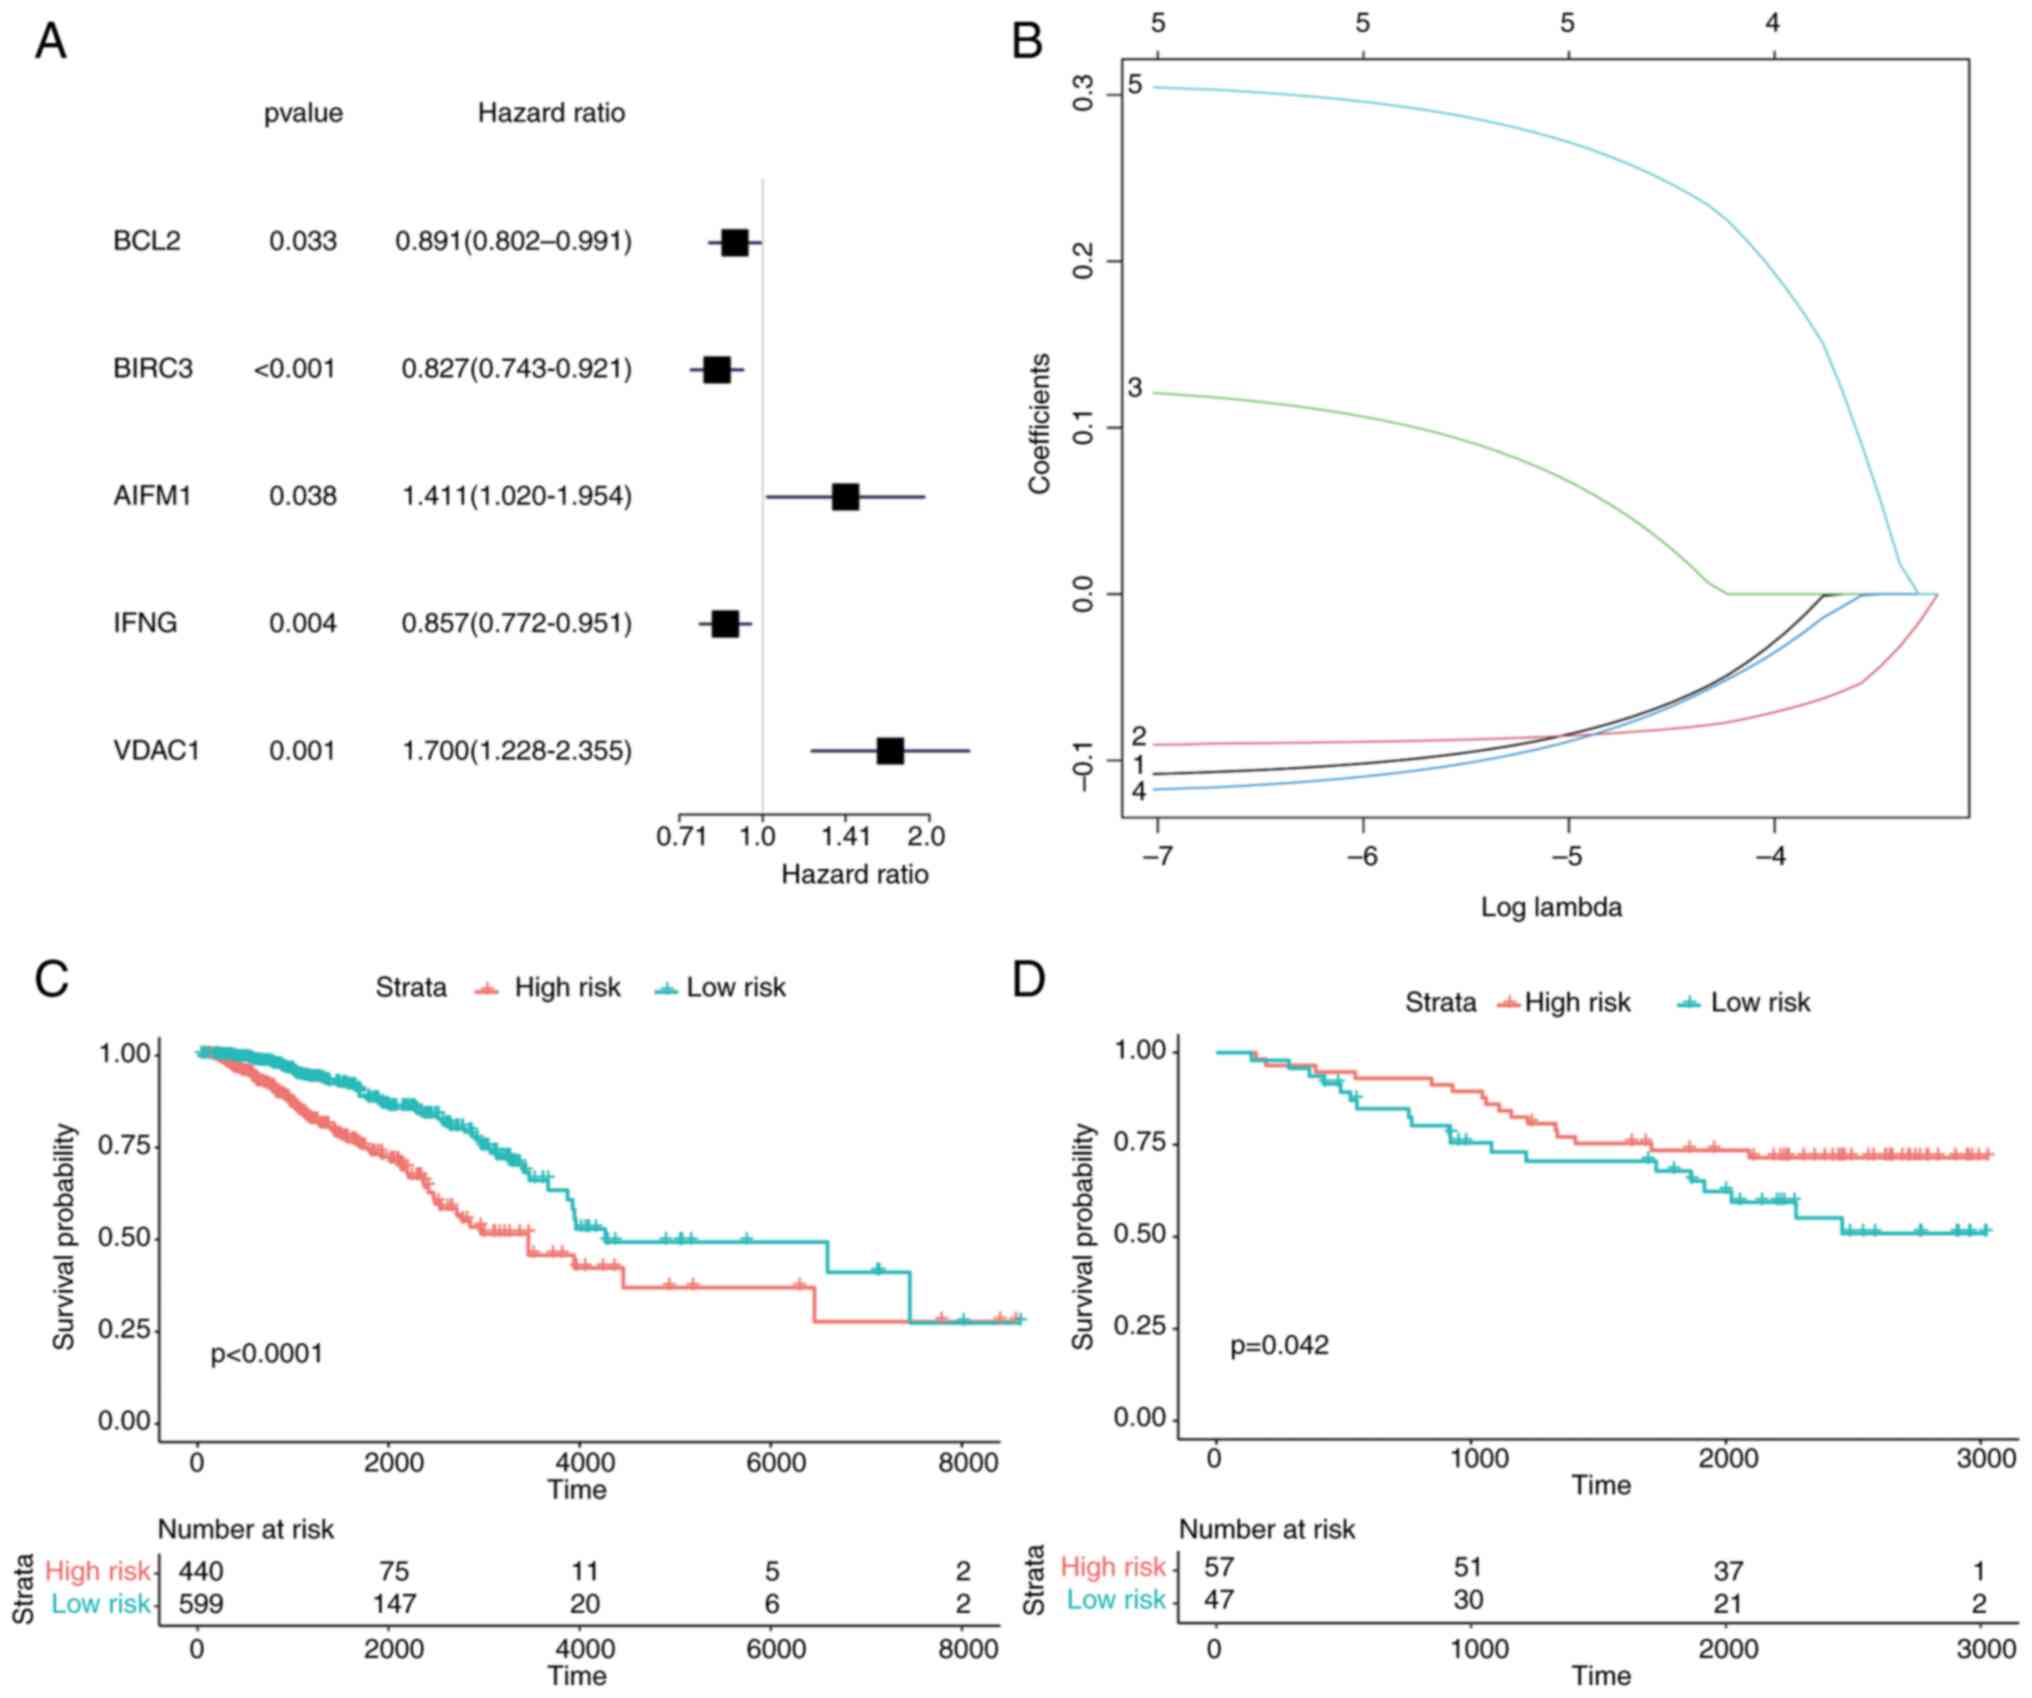
univariate Cox regression analysis was first used to screen
prognostic genes, and 5 genes were screened according to the
criterion of P<0.05 (Fig. 8A).
These 5 genes (BCL2, BIRC3, AIFM1, IFNG and VDAC1) in the model
were identified as potential prognostic genes of BC by LASSO
regression (Fig. 8B). According to
the Cox risk regression coefficient of the 5 genes, the riskScores
of each sample were calculated. The samples were divided into two
groups by the cut-off provided by the R package ‘maxstat’,
including 440 samples in the high-risk group and 599 samples in the
low-risk group. According to the aforementioned grouping, survival
analysis was conducted and a survival curve was drawn. In the LASSO
prognostic model, the survival rate of the high-risk group was
lower than that of the low-risk group (P<0.0001) (Fig. 8C).
Next, the prognosis model was validated with GEO
datasets and a survival curve was generated through survival
analysis. In contrast to the aforementioned results, the survival
rate in the high-risk group was higher than that in the low-risk
group (P<0.042) (Fig. 8D). This
contradictory result may be caused by the heterogeneity between
datasets and the differences in sample characteristics. Finally,
the Receiver Operating Characteristic (ROC) curve was drawn and the
AUC was calculated to verify the model. The results revealed that
the AUC of TCGA-BC dataset was 0.595 (Fig. S1A), which had a certain prediction
effect, while the AUC of GEO datasets was 0.457 (Fig. S1B), indicating that its prediction
effect was poor.
Construction of a nomogram for
patients with BC based on riskScores
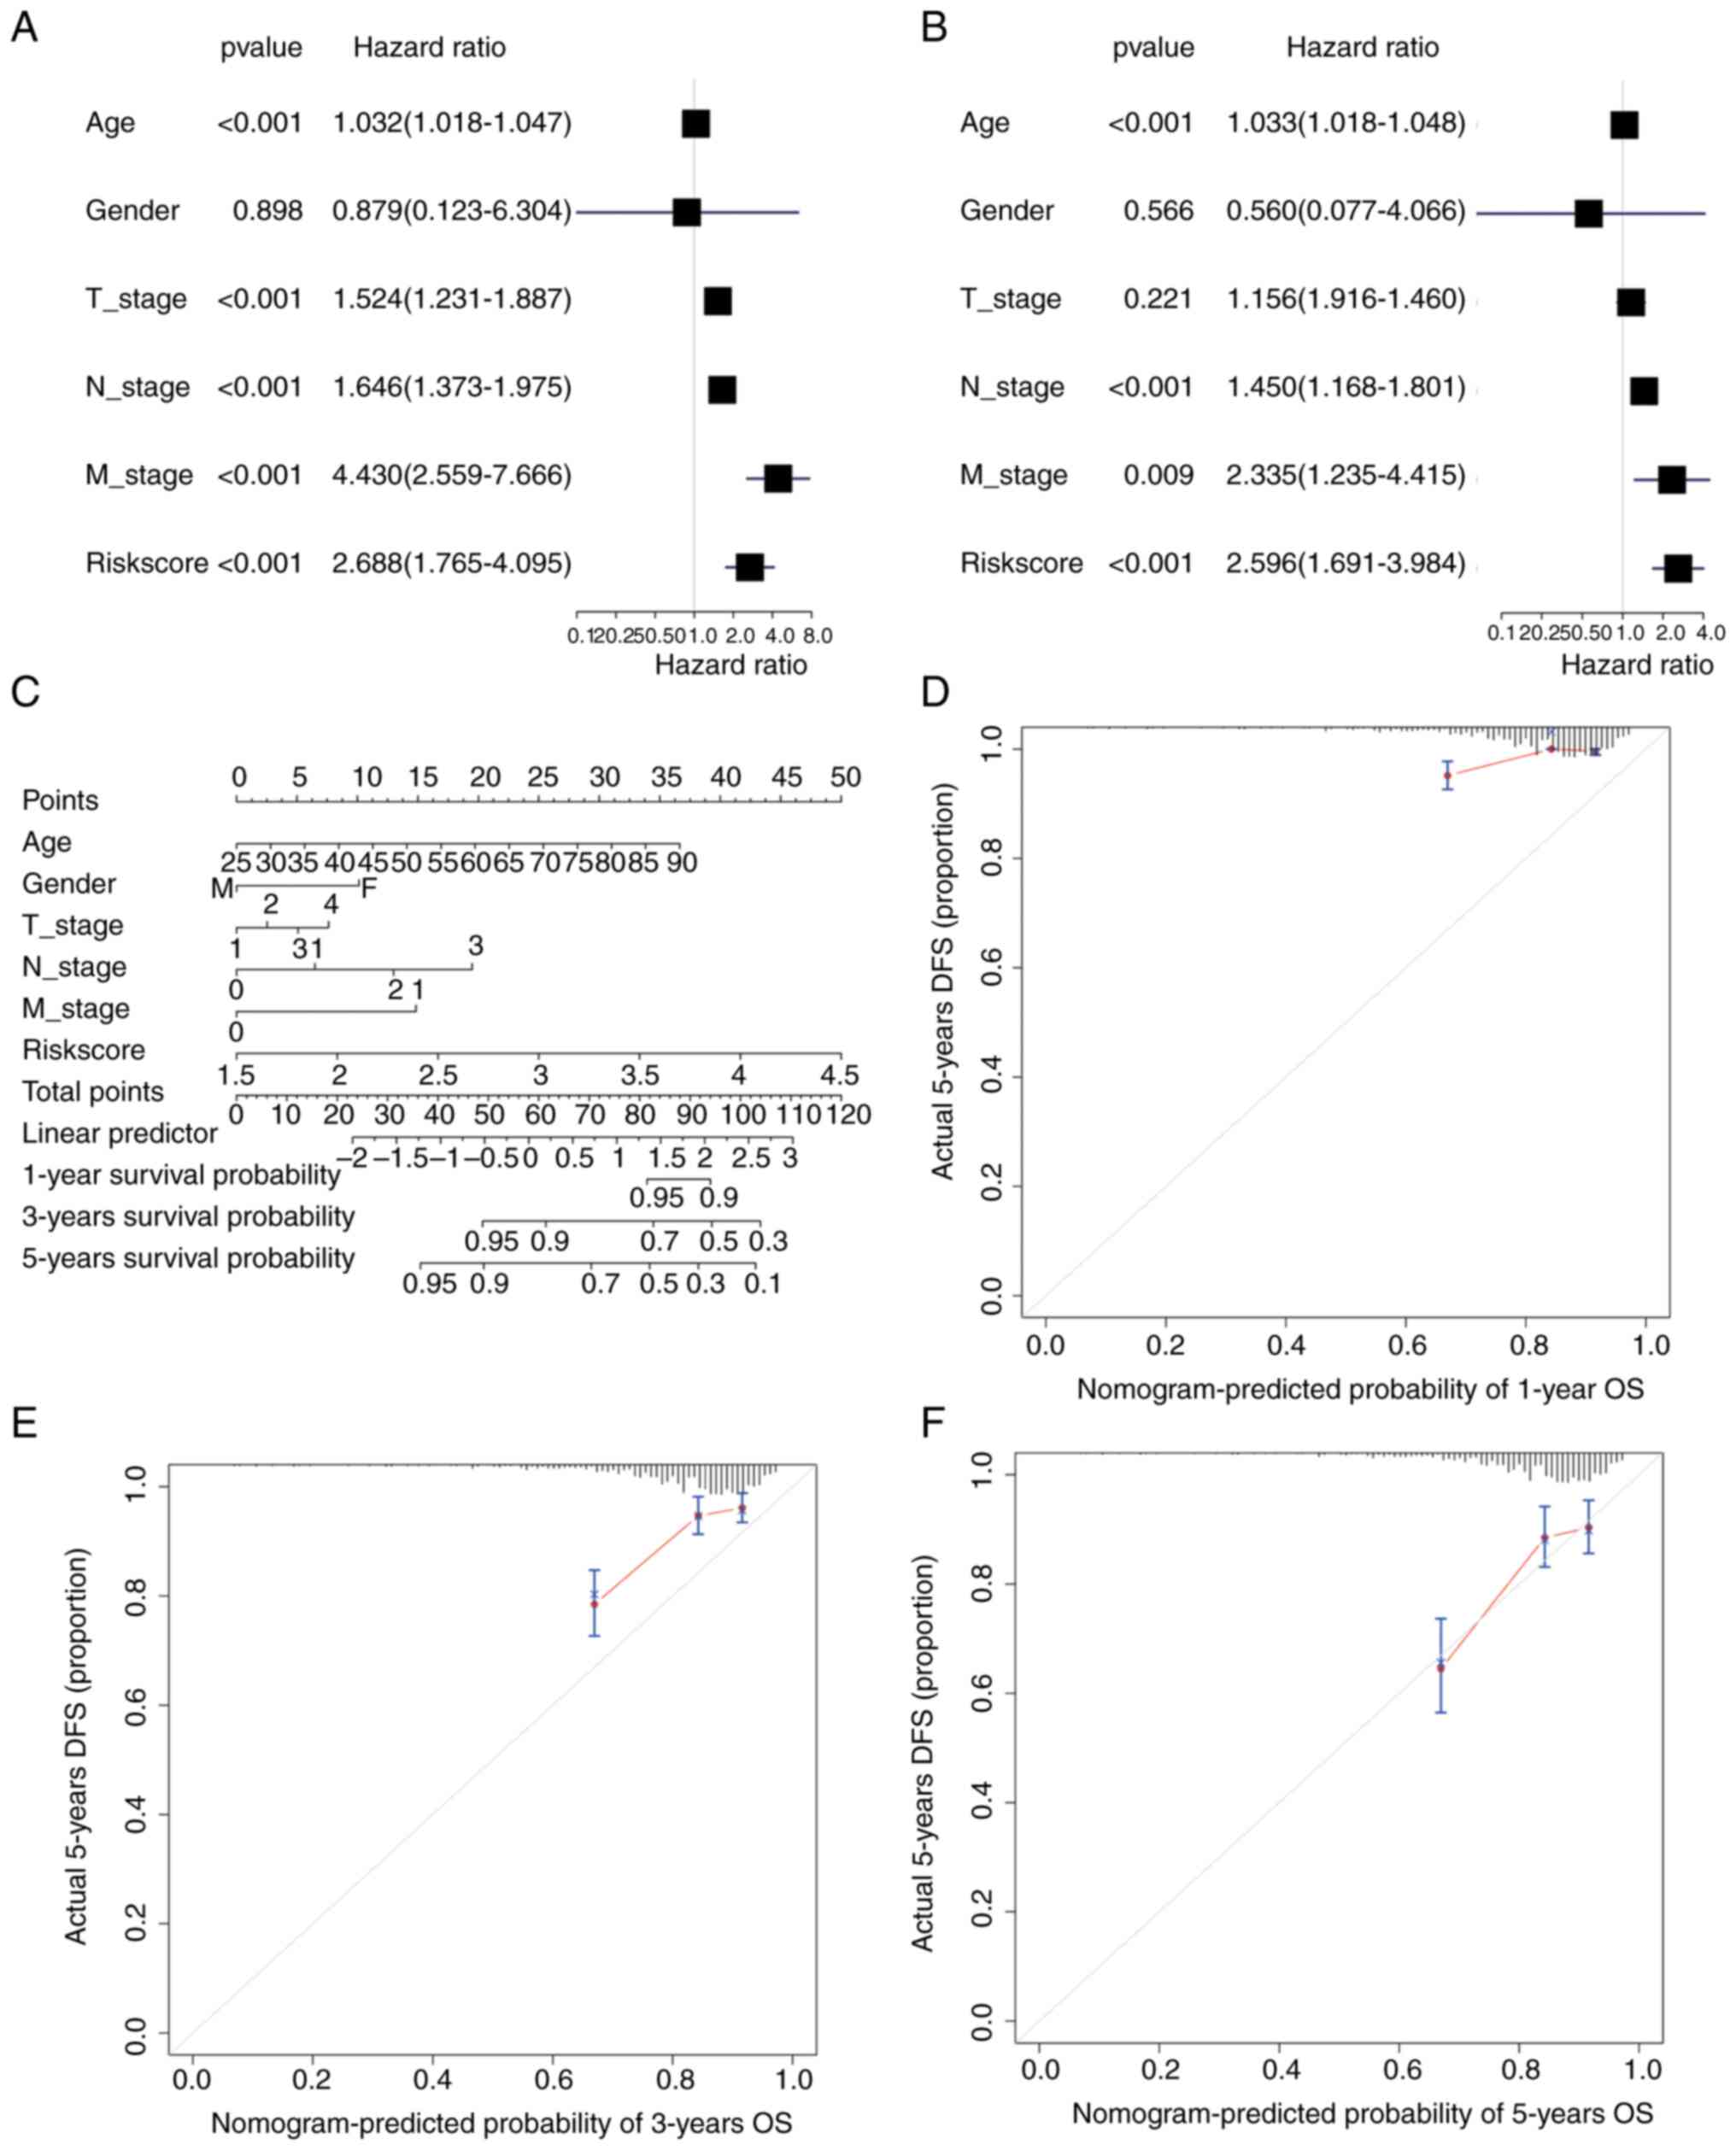
Univariate and multivariate Cox regression analysis
was performed based on the TCGA-BC dataset according to the
patients' TNM stage, sex, age and riskScore. In univariate Cox
regression, age, T-stage, N-stage, M-stage and riskScore had a
significant influence on OS (P<0.001) (Fig. 9A), while only age, N-stage and
riskScore had a significant effect in multivariate Cox regression
(P<0.001) (Fig. 9B). A nomogram
was also drawn using the ‘rms’ package (Fig. 9C). The 1-, 3- and 5-year survival
probabilities of patients with BC were predicted by drawing 1-
(Fig. 9D), 3- (Fig. 9E) and 5-year calibration curves
(Fig. 9F). The results
demonstrated that the 5-year nomogram model was the most consistent
with the ideal model, and other nomogram models were essentially
equal to the ideal model, indicating that the present model was
relatively accurate.
Immune infiltration analysis
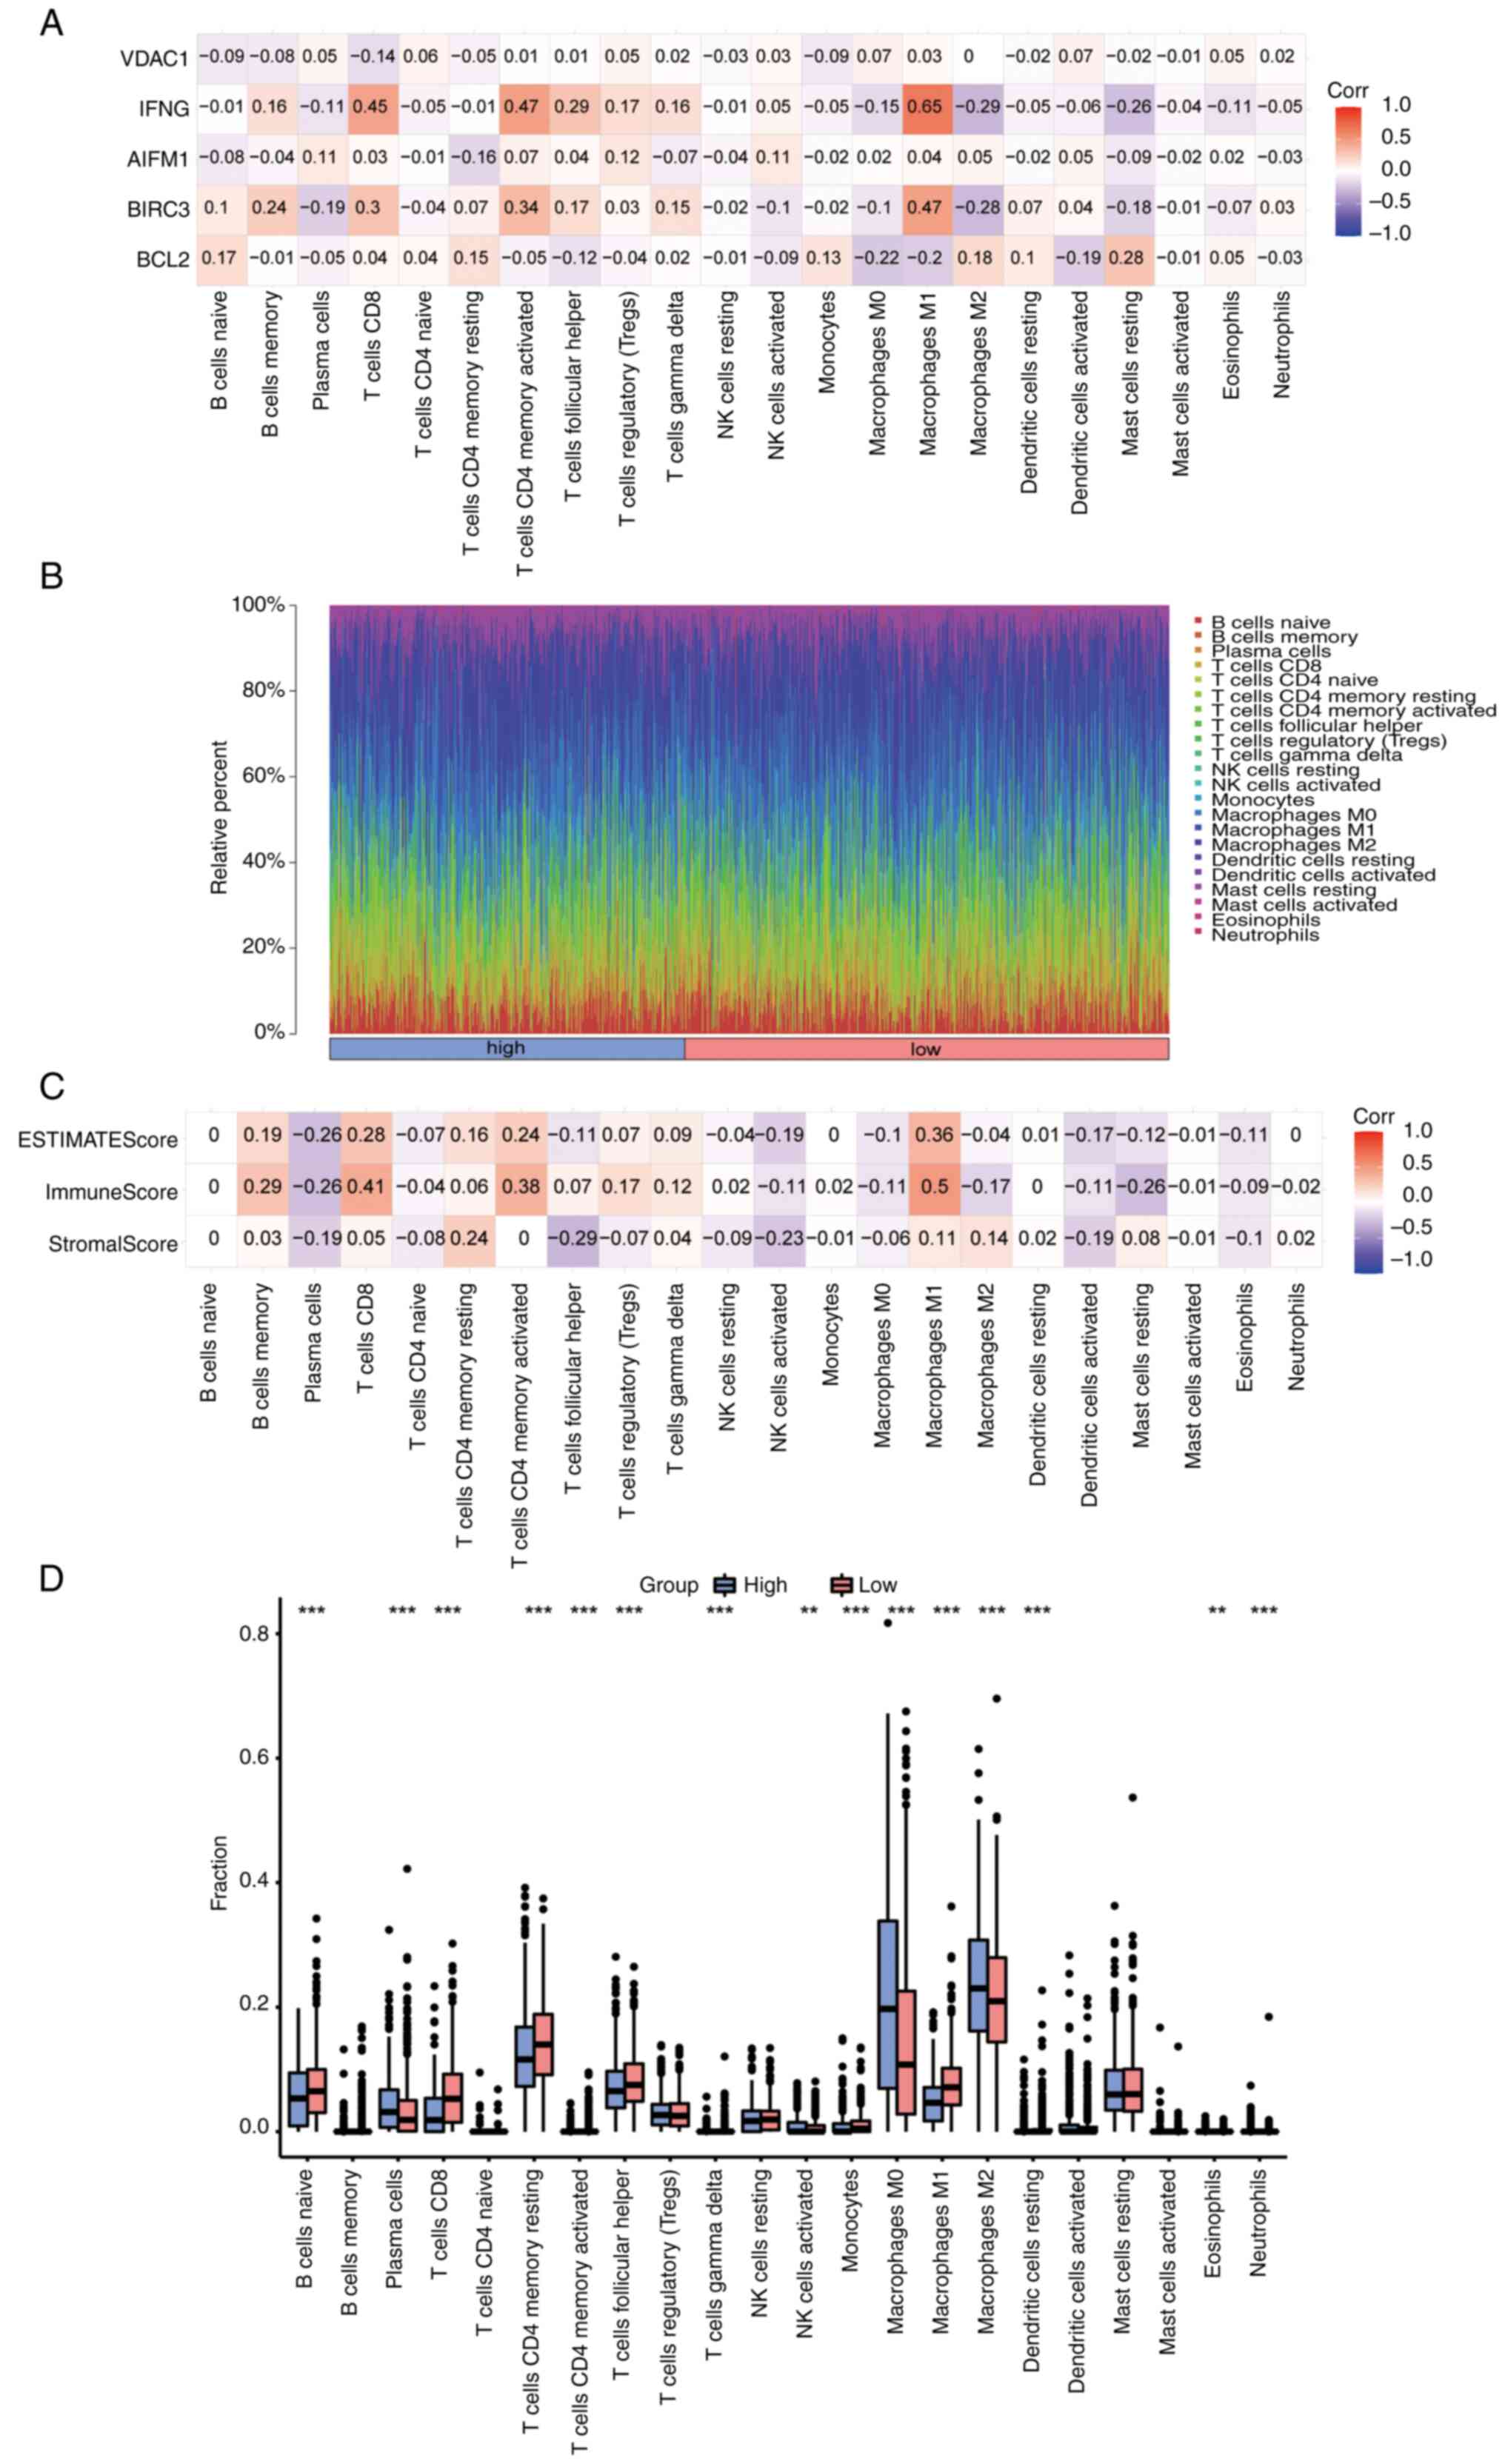
First, the correlation between 5 prognostic genes
(BCL2, BIRC3, AIFM1, IFNG and VDAC1) and 22 types of immune cells
was analyzed and visualized using CIBERSORT in the BC dataset
(Fig. 10A). The positive
correlation between IFNG and M1 macrophages was the highest
(r=0.65, P=1.6x10-125), while the negative correlation
between IFNG and M2 macrophages was the highest (r=-0.29,
P=5.1x10⁻²²). The infiltration panorama of 22 types of
immune cells in each sample was next mapped (Fig. 10B). Finally, the ImmuneScore,
StromalScore and EstimateScore in each sample were calculated by
the ESTIMATE algorithm, and the correlation between each score and
22 types of immune cells was analyzed and visualized (Fig. 10C). The highest positive
correlation was between ImmuneScore and M1 macrophages (r=0.5,
P=7.7x10-66). Finally, the differences in immune
infiltration between high- and low-risk groups were shown as box
plots (Fig. 10D). The results
revealed that the infiltration of plasma cells, activated NK cells,
M0 and M2 macrophages and eosinophils in the high-risk group was
significantly higher than that in the low-risk group. However,
compared with the high-risk group, the low-risk group had a higher
degree of infiltration of naive B, CD8+ T cells, memory
resting CD4+ T cells, memory activated CD4+ T
cells and follicular helper T cells, as well as M1 macrophages and
other immune cells.
Somatic mutation analysis and
differential expression analysis of HLA family genes
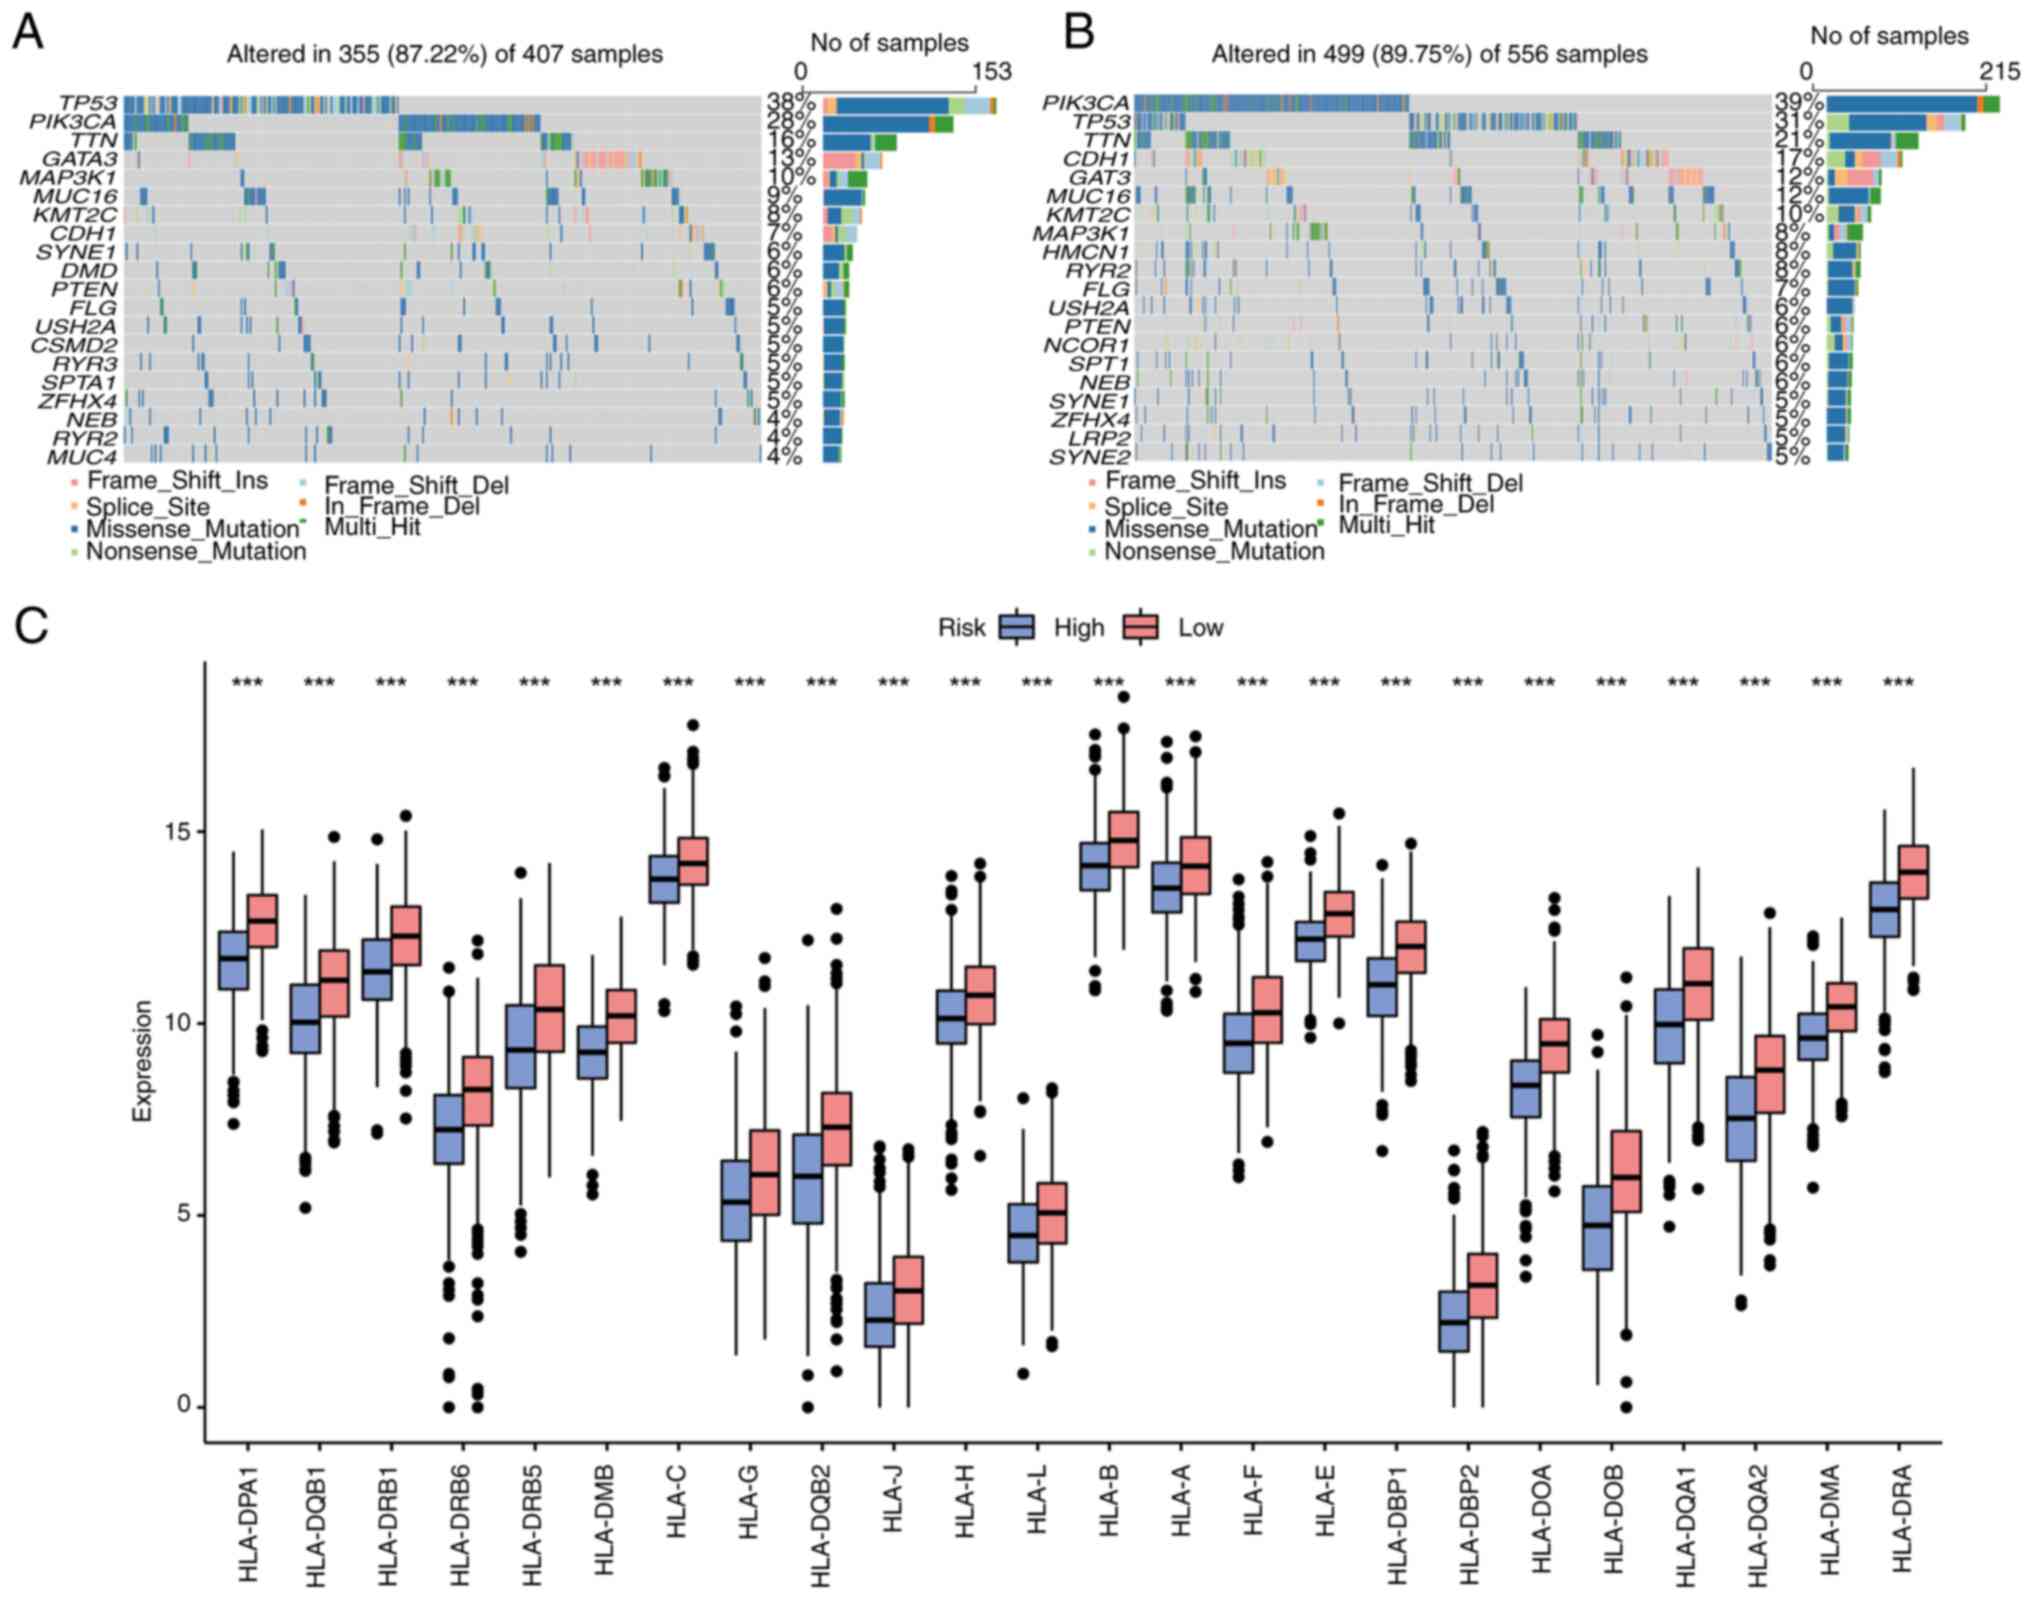
According to the risk score of the aforementioned
model, the total BC samples in the somatic mutation dataset were
divided into high- and low-risk group, and the characteristics of
various mutations in different groups were analyzed. The top 20
mutated genes in the high- and low-risk groups were analyzed
(Fig. 11A and B), and it was found that there were
differences in gene mutations in the two groups. The gene with the
highest mutation frequency in the high-risk group was TP53, while
in the low-risk group it was PIK3CA. The differential expression of
HLA family genes in the high- and low-risk groups of TCGA-BC
dataset was also analyzed. As revealed in Fig. 11C, various HLA molecules were
upregulated in the low-risk group.
Correlation analysis of prognostic
genes and immune checkpoints
The constructed LASSO model produced 5 BC prognostic
genes (BCL2, BIRC3, AIFM1, IFNG and VDAC1), and 47 ICGs were
obtained by consulting the literature (19). By calculating the Pearson
correlation coefficient between the two, correlations of prognostic
genes with immune checkpoints were obtained (Fig. 12). Among them, IFNG had the
highest positive correlation with IDO1 and ICOS (r=0.79 and
P=2.4x10-232; r=0.79 and P=4.9x10-237,
respectively), while BCL2 had the highest negative correlation with
TNFSF9 (r=0.34, P=1.3x10⁻³⁰).
Validation of the expression
validation of prognostic genes
The mRNA expression of 5 prognostic genes (BCL2,
BIRC3, AIFM1, IFNG and VDAC1) in the human BC cell lines MDA-MB-231
and MCF-7 and the human breast epithelial cell MCF-10A was detected
by RT-qPCR. The results showed that, compared with MCF-10A, BCL2,
BIRC3, AIFM1, IFNG and VDAC1 were significantly higher in the
aforementioned BC cell lines (Fig.
13A-E) (P<0.05). Although the expression of BCL2 and BIRC3
in MCF-7 cells was higher than that in MCF-10A, there was no
statistical significance (P>0.05). This suggested that the
expression of BCL2 and BIRC3 genes may be related to BC types.
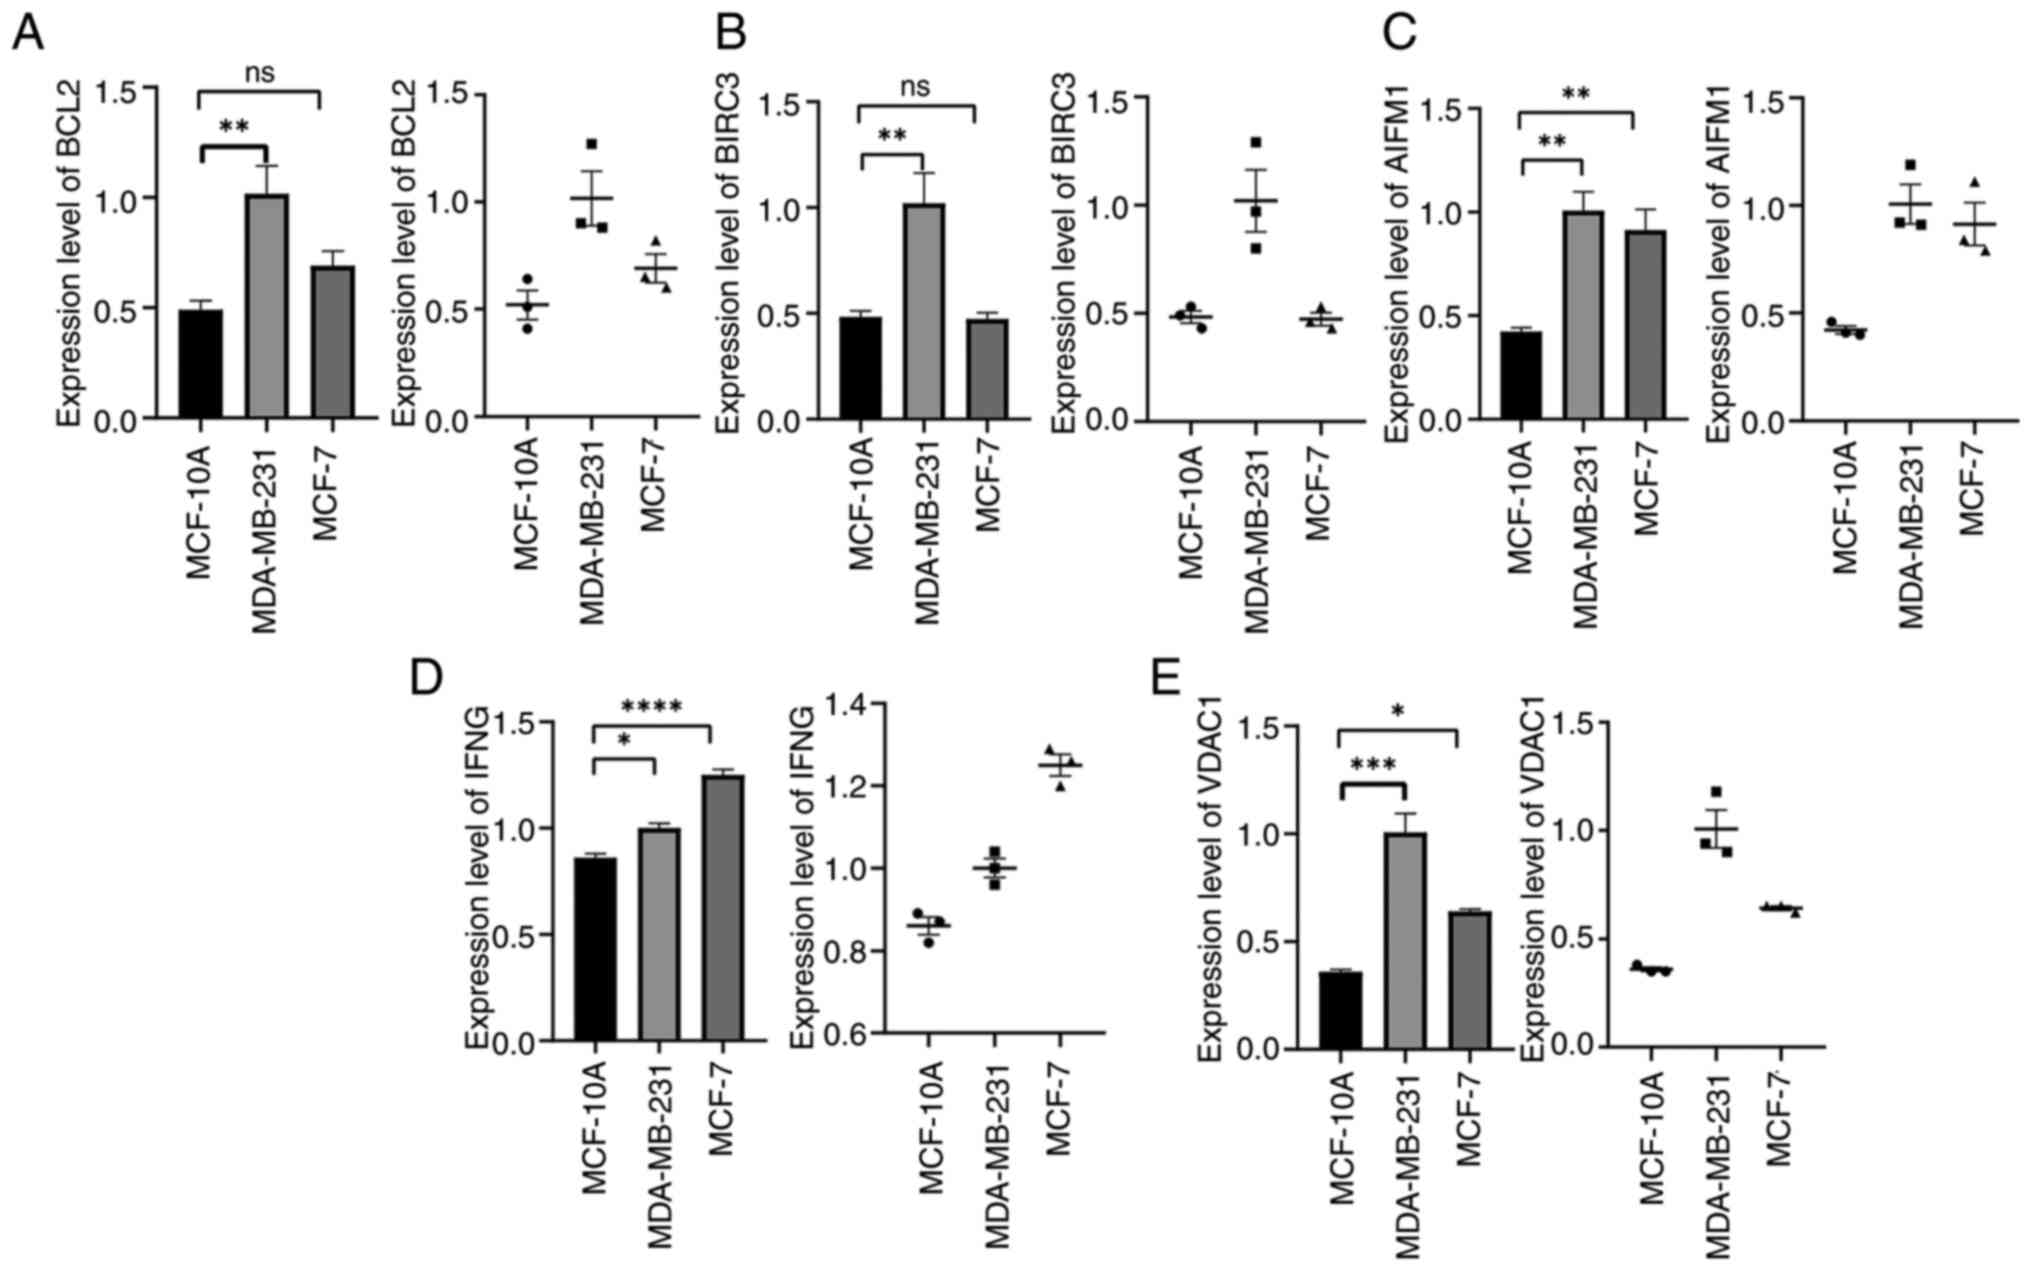 | Figure 13Verification of BCL2, BIRC3, AIFM1,
IFNG, VDAC1 expression in MDA-MB-231, MCF-7 and MCF-10A cells.
(A-E) mRNA expression level of (A) BCL2, (B) BIRC3, (C) AIFM1, (D)
IFNG and (E) VDAC1 in MDA-MB-231, MCF-7 and MCF-10A cells.
*P<0.05, **P<0.01,
***P<0.001 and ****P<0.0001. ns, not
significant. |
Discussion
It is well known that BC is a highly heterogeneous
class of cancer, and the prognosis and treatment response of
patients with different molecular characteristics vary greatly
(25). Single-cell RNA-seq is an
advanced method for studying the cellular heterogeneity of the TME
in various cancer types (26).
Necroptosis is involved in the immune response and TME, and the
benefits of activation of necroptosis pathways combined with immune
checkpoint blockade have been demonstrated in a recent study
(27). At present, the risk model
of NRGs in BC and the potential ability to predict prognosis has
not been elucidated at the single-cell level.
The present study identified a prognostic model
containing 5 NRGs (BCL2, BIRC3, AIFM1, IFNG and VDAC1) at the
single-cell level. Univariate Cox regression analysis showed that
BCL2, BIRC3 and IFNG were protective factors, while AIFM1 and VDAC1
were risk factors. Among them, the BCL2 protein family could induce
apoptosis and necroptosis (28).
BCL2 is overexpressed in BC, and is an independent and powerful
protein marker for favorable prognosis of early BC, which is not
associated with time or adjuvant therapy (29). Therefore, BCL2 is the most
potential therapeutic target. Currently, the mimic compound ABT-199
for BCL2, in combination with tamoxifen, showed a clinical benefit
rate of 75% in a phase Ib/II clinical trial in ER+ BC
(30,31). BC is one of the tumor types where
BIRC3 has not yet been fully characterized. In the majority of
cases, BIRC3 is regarded as an oncogene with antiapoptotic
functions; however, in BC, BIRC3 does not regulate any pathway of
apoptosis (32). A recent study by
Zhou et al (33) showed
that BIRC3 was highly expressed in BC, and its high expression was
associated with favorable prognosis. The dual function of BIRC3 may
depend on the type of cancer and/or the molecular subtype of BC.
Thus, this gene needs to be further studied to clarify its role in
BC. IFNG is the only type II IFN cytokine that can induce
necroptosis by activating RIP1 serine-threonine kinase to exert
antitumor effects (34). Previous
studies have revealed that high expression of IFNG has a survival
advantage over low expression in patients with BC and cervical
cancer (35,36), which shows that IFNG is a
protective factor, which is consistent with the results of the
present study. AIFM1 is not only a risk gene for the prognosis of
BC, but also promotes the occurrence of cervical cancer (37,38).
This suggests that inhibiting the expression of AIFM1 is beneficial
to the prognosis of patients with BC. Fang et al (39) reported that overexpressed VDAC1 in
BC could be used as a new biomarker for diagnosis. VDAC1 is an
independent factor for predicting poor prognosis. VDAC1 may inhibit
tumor immunity and may be a new therapeutic target for BC. Compared
with the prediction ability of a single gene, the comprehensive
prediction efficiency of 5 genes for BC is higher. As a result, the
combination of these genes may have an unexpected effect in
optimizing the prognostic assessment strategy of BC.
Necroptosis participates in the immune response in
two ways: On one hand, tumor cells release damage-associated
molecular patterns to dendritic cells after necroptosis to trigger
antigen presentation and activate CD8+ T cells (27). On the other hand, it has been
reported that RIPK1 and RIPK3 can directly regulate the function of
NK cells independently of the necroptosis pathway, and play a role
in promoting antitumor immune responses (40). The present study showed that NRGs
were highly active in CD4+ T cells and differentially
expressed in the developmental trajectory of the four subtypes of
cells. This suggests that NRGs may be involved in the
differentiation and development of CD4+ T cells, thus
affecting the function of CD4+ T cells. Kwok et
al (41) identified that
necroptosis was involved in CD4+ T cell-mediated
microvascular endothelial cell death and chronic cardiac allograft
rejection. In cancer, there is a lack of research on necroptosis
and CD4+ T cells. Furthermore, in addition to M1
macrophages, activated CD4+ T cells had the highest
immuneScore. This indicated that CD4+ T cells have more
immune components and can play an important role in immunotherapy.
The present results suggested that NRGs may become an effective
molecule to improve the antitumor immune function of
CD4+ T cells; however, further research is still needed
to confirm.
Immune infiltration in the TME has an important
influence on the clinical features and prognosis of BC (42). The current study was divided into
high- and low-risk groups according to the median risk score, and
the results suggested that immune cell infiltration in the low-risk
group was higher than that in the high-risk group. Patients in the
low-risk group had a higher OS than those in the high-risk group.
In BC, high immune infiltration has been associated with improved
clinical outcome (43), which is
consistent with the present findings. Groups with high immune
infiltration may benefit to a greater extent from immunotherapy
(44). This suggests that patients
in the low-risk group are more sensitive to immunotherapy. In
addition, 5 prognostic genes were correlated with multiple immune
checkpoints such as IDO1 which may lead to new targets for BC
immunotherapy.
The present study has several limitations,
including: i) The differentiation role of NRGs in CD4+ T
cells requires further experimental research, which will be the
authors' next research plan; ii) it lacks mechanism and animal
experiments to verify the regulatory mechanism of necrotizing
apoptosis-related genes in BC, which will be further explored in
the future; iii) there is insufficient number of patients in the
external clinical cohort, and large-scale clinical trials are
therefore required to verify the accuracy of the results; and iv)
there are multiple datasets, which may cause inter-batch
differences that cannot be avoided and removed during analysis.
In conclusion, the present study successfully
established an NRG signature based on BCL2, BIRC3, AIFM1, IFNG and
VDAC1 at the single-cell level, and explored the association
between risk model and immune infiltration. Secondly, the current
study found that NRGs were involved in the differentiation and
development of CD4+ T cells. These findings pointed
novel ways of BC prognosis estimation and potential immunotherapy
strategies.
Supplementary Material
Receiver Operating Characteristic
(ROC) curves of TCGA-BC dataset and GEO datasets. (A) The ROC curve
and AUC value of the TCGA-BC dataset. (B) The ROC curve and AUC
value of the GEO datasets.
List of necroptosis-related
genes.
List of immune checkpoint genes.
Acknowledgements
Not applicable.
Funding
Funding: The present study was supported by the National Natural
Science Foundation of China (grant no. 82060479) and the Key
Research and Development Project of Ningxia Hui Autonomous Region
(grant no. 2021BEG03062).
Availability of data and materials
The data generated in the present study may be found
in The Cancer Genome Atlas (https://portal.gdc.cancer.gov/projects/TCGA-BRCA)
and Gene Expression Omnibus databases under accession numbers
GSE114724 and GSE42568 or at the following URL: https://www.ncbi.nlm.nih.gov/gds/?term=GSE114724
and https://www.ncbi.nlm.nih.gov/gds/?term=GSE114724.
Authors' contributions
JL designed the study. JL and LG confirm the
authenticity of all the raw data. LG and XM performed data analysis
and drafted the manuscript. HL and SY performed verification
experiments and improved the language of the manuscript. KZ
downloaded the raw data and modified the manuscript with JL. All
authors read and approved the final manuscript.
Ethics approval and consent to
participate
Not applicable.
Patient consent for publication
Not applicable.
Competing interests
The authors declare that they have no competing
interests.
References
|
1
|
Loibl S, Poortmans P, Morrow M, Denkert C
and Curigliano G: Breast cancer. Lancet. 397:1750–1769.
2021.PubMed/NCBI View Article : Google Scholar
|
|
2
|
Zhou J, Su CM, Chen HA, Du S, Li CW, Wu H,
Tsai SH and Yeh YT: Cryptanshinone inhibits the glycolysis and
inhibits cell migration through PKM2/β-catenin axis in breast
cancer. Onco Targets Ther. 13:8629–8639. 2020.PubMed/NCBI View Article : Google Scholar
|
|
3
|
Mao YJ, Lim HJ, Ni M, Yan WH, Wong DW and
Cheung JC: Breast tumour classification using ultrasound
elastography with machine learning: A systematic scoping review.
Cancers (Basel). 14(367)2022.PubMed/NCBI View Article : Google Scholar
|
|
4
|
Yankaskas CL, Thompson KN, Paul CD, Vitolo
MI, Mistriotis P, Mahendra A, Bajpai VK, Shea DJ, Manto KM, Chai
AC, et al: A microfluidic assay for the quantification of the
metastatic propensity of breast cancer specimens. Nat Biomed Eng.
3:452–465. 2019.PubMed/NCBI View Article : Google Scholar
|
|
5
|
Roychowdhury S, McCullough RL, Sanz-Garcia
C, Saikia P, Alkhouri N, Matloob A, Pollard KA, McMullen MR,
Croniger CM and Nagy LE: Receptor interacting protein 3 protects
mice from high-fat diet-induced liver injury. Hepatology.
64:1518–1533. 2016.PubMed/NCBI View Article : Google Scholar
|
|
6
|
Kaczmarek A, Vandenabeele P and Krysko DV:
Necroptosis: The release of damage-associated molecular patterns
and its physiological relevance. Immunity. 38:209–223.
2013.PubMed/NCBI View Article : Google Scholar
|
|
7
|
Gong Y, Fan Z, Luo G, Yang C, Huang Q, Fan
K, Cheng H, Jin K, Ni Q, Yu X and Liu C: The role of necroptosis in
cancer biology and therapy. Mol Cancer. 18(100)2019.PubMed/NCBI View Article : Google Scholar
|
|
8
|
Daniels BP, Kofman SB, Smith JR, Norris
GT, Snyder AG, Kolb JP, Gao X, Locasale JW, Martinez J, Gale M Jr,
et al: The nucleotide sensor ZBP1 and kinase RIPK3 induce the
enzyme iRG1 to promote an antiviral metabolic state in neurons.
Immunity. 50:64–76.e4. 2019.PubMed/NCBI View Article : Google Scholar
|
|
9
|
Park JE, Lee JH, Lee SY, Hong MJ, Choi JE,
Park S, Jeong JY, Lee EB, Choi SH, Lee YH, et al: Expression of key
regulatory genes in necroptosis and its effect on the prognosis in
non-small cell lung cancer. J Cancer. 11:5503–5510. 2020.PubMed/NCBI View Article : Google Scholar
|
|
10
|
Li X, Guo J, Ding AP, Qi WW, Zhang PH, Lv
J, Qiu WS and Sun ZQ: Association of mixed lineage kinase
domain-like protein expression with prognosis in patients with
colon cancer. Technol Cancer Res Treat. 16:428–434. 2017.PubMed/NCBI View Article : Google Scholar
|
|
11
|
Höckendorf U, Yabal M, Herold T,
Munkhbaatar E, Rott S, Jilg S, Kauschinger J, Magnani G, Reisinger
F, Heuser M, et al: RIPK3 restricts myeloid leukemogenesis by
promoting cell death and differentiation of leukemia initiating
cells. Cancer Cell. 30:75–91. 2016.PubMed/NCBI View Article : Google Scholar
|
|
12
|
Jiao D, Cai Z, Choksi S, Ma D, Choe M,
Kwon HJ, Baik JY, Rowan BG, Liu C and Liu ZG: Necroptosis of tumor
cells leads to tumor necrosis and promotes tumor metastasis. Cell
Res. 28:868–870. 2018.PubMed/NCBI View Article : Google Scholar
|
|
13
|
He X, Feng Z, Ma J, Ling S, Cao Y, Gurung
B, Wu Y, Katona BW, O'Dwyer KP, Siegel DL, et al: Bispecific and
split CAR T cells targeting CD13 and TIM3 eradicate acute myeloid
leukemia. Blood. 135:713–723. 2020.PubMed/NCBI View Article : Google Scholar
|
|
14
|
Wu Y, Kyle-Cezar F, Woolf RT,
Naceur-Lombardelli C, Owen J, Biswas D, Lorenc A, Vantourout P,
Gazinska P, Grigoriadis A, et al: An innate-like Vδ1+ γδ
T cell compartment in the human breast is associated with remission
in triple-negative breast cancer. Sci Transl Med.
11(eaax9364)2019.PubMed/NCBI View Article : Google Scholar
|
|
15
|
Snyder AG, Hubbard NW, Messmer MN, Kofman
SB, Hagan CE, Orozco SL, Chiang K, Daniels BP, Baker D and Oberst
A: Intratumoral activation of the necroptotic pathway components
RIPK1 and RIPK3 potentiates antitumor immunity. Sci Immunol.
4(eaaw2004)2019.PubMed/NCBI View Article : Google Scholar
|
|
16
|
Chung W, Eum HH, Lee HO, Lee KM, Lee HB,
Kim KT, Ryu HS, Kim S, Lee JE, Park YH, et al: Single-cell RNA-seq
enables comprehensive tumour and immune cell profiling in primary
breast cancer. Nat Commun. 8(15081)2017.PubMed/NCBI View Article : Google Scholar
|
|
17
|
Zou Y, Ye F, Kong Y, Hu X, Deng X, Xie J,
Song C, Ou X, Wu S and Wu L: The single-cell landscape of
intratumoral heterogeneity and the immunosuppressive
microenvironment in liver and brain metastases of breast cancer.
Adv Sci (Weinh). 10(e2203699)2023.PubMed/NCBI View Article : Google Scholar
|
|
18
|
Fu X, Wu X, Djekidel MN and Zhang Y: Myc
and Dnmt1 impede the pluripotent to totipotent state transition in
embryonic stem cells. Nat Cell Biol. 21:835–844. 2019.PubMed/NCBI View Article : Google Scholar
|
|
19
|
Shigemizu D, Iwase T, Yoshimoto M, Suzuki
Y, Miya F, Boroevich KA, Katagiri T, Zembutsu H and Tsunoda T: The
prediction models for postoperative overall survival and
disease-free survival in patients with breast cancer. Cancer Med.
6:1627–1638. 2017.PubMed/NCBI View Article : Google Scholar
|
|
20
|
Feng H, Zhong L, Yang X, Wan Q, Pei X and
Wang J: Development and validation of prognostic index based on
autophagy-related genes in patient with head and neck squamous cell
carcinoma. Cell Death Discov. 6(59)2020.PubMed/NCBI View Article : Google Scholar
|
|
21
|
Xu D, Liu X, Wang Y, Zhou K, Wu J, Chen
JC, Chen C, Chen L and Zheng J: Identification of immune subtypes
and prognosis of hepatocellular carcinoma based on immune
checkpoint gene expression profile. Biomed Pharmacother.
126(109903)2020.PubMed/NCBI View Article : Google Scholar
|
|
22
|
Liu D, Schilling B, Liu D, Sucker A,
Livingstone E, Jerby-Arnon L, Zimmer L, Gutzmer R, Satzger I,
Loquai C, et al: Integrative molecular and clinical modeling of
clinical outcomes to PD1 blockade in patients with metastatic
melanoma. Nat Med. 25:1916–1927. 2019.PubMed/NCBI View Article : Google Scholar
|
|
23
|
Ru B, Wong CN, Tong Y, Zhong JY, Zhong
SSW, Wu WC, Chu KC, Wong CY, Lau CY, Chen I, et al: TISIDB: An
integrated repository portal for tumor-immune system interactions.
Bioinformatics. 35:4200–4202. 2019.PubMed/NCBI View Article : Google Scholar
|
|
24
|
Livak KJ and Schmittgen TD: Analysis of
relative gene expression data using real-time quantitative PCR and
the 2(-Delta Delta C(T)) method. Methods. 25:402–408.
2001.PubMed/NCBI View Article : Google Scholar
|
|
25
|
Nguyen VC, Nguyen TQ, Vu TNH, Phung TH,
Nguyen TPH, Nguyen ND and Le DR: Application of St Gallen
categories in predicting survival for patients with breast cancer
in Vietnam. Cancer Control. 26(1073274819862794)2019.PubMed/NCBI View Article : Google Scholar
|
|
26
|
Xie J, Deng W, Deng X, Liang JY, Tang Y,
Huang J, Tang H, Zou Y, Zhou H and Xie X: Single-cell histone
chaperones patterns guide intercellular communication of tumor
microenvironment that contribute to breast cancer metastases.
Cancer Cell Int. 23(311)2023.PubMed/NCBI View Article : Google Scholar
|
|
27
|
Gao W, Wang X, Zhou Y, Wang X and Yu Y:
Autophagy, ferroptosis, pyroptosis, and necroptosis in tumor
immunotherapy. Signal Transduct Target Ther. 7(196)2022.PubMed/NCBI View Article : Google Scholar
|
|
28
|
Li X, Chen M, Shi Q, Zhang H and Xu S:
Hydrogen sulfide exposure induces apoptosis and necroptosis through
lncRNA3037/miR-15a/BCL2-A20 signaling in broiler trachea. Sci Total
Environ. 699(134296)2020.PubMed/NCBI View Article : Google Scholar
|
|
29
|
Dawson SJ, Makretsov N, Blows FM, Driver
KE, Provenzano E, Le Quesne J, Baglietto L, Severi G, Giles GG,
McLean CA, et al: BCL2 in breast cancer: A favourable prognostic
marker across molecular subtypes and independent of adjuvant
therapy received. Br J Cancer. 103:668–675. 2010.PubMed/NCBI View Article : Google Scholar
|
|
30
|
Zhang L, Lu Z and Zhao X: Targeting Bcl-2
for cancer therapy. Biochim Biophys Acta Rev Cancer.
1876(188569)2021.PubMed/NCBI View Article : Google Scholar
|
|
31
|
Lok SW, Whittle JR, Vaillant F, Teh CE, Lo
LL, Policheni AN, Bergin ART, Desai J, Ftouni S, Gandolfo LC, et
al: A phase Ib dose-escalation and expansion study of the BCL2
inhibitor venetoclax combined with tamoxifen in ER and
BCL2-positive metastatic breast cancer. Cancer Discov. 9:354–369.
2019.PubMed/NCBI View Article : Google Scholar
|
|
32
|
Frazzi R: BIRC3 and BIRC5: Multi-faceted
inhibitors in cancer. Cell Biosci. 11(8)2021.PubMed/NCBI View Article : Google Scholar
|
|
33
|
Zhou Q, Xu Y, Shen L, Yang X and Wang L:
Identification of a novel necroptosis-related classifier to predict
prognosis and guide immunotherapy in breast invasive carcinoma.
Front Oncol. 12(852365)2022.PubMed/NCBI View Article : Google Scholar
|
|
34
|
Zaidi MR: The interferon-gamma paradox in
cancer. J Interferon Cytokine Res. 39:30–38. 2019.PubMed/NCBI View Article : Google Scholar
|
|
35
|
Wu ZH, Tang Y, Yu H and Li HD: The role of
ferroptosis in breast cancer patients: A comprehensive analysis.
Cell Death Discov. 7(93)2021.PubMed/NCBI View Article : Google Scholar
|
|
36
|
Rotman J, den Otter LAS, Bleeker MCG,
Samuels SS, Heeren AM, Roemer MGM, Kenter GG, Zijlmans HJMAA, van
Trommel NE, de Gruijl TD and Jordanova ES: PD-L1 and PD-L2
expression in cervical cancer: Regulation and biomarker potential.
Front Immunol. 11(596825)2020.PubMed/NCBI View Article : Google Scholar
|
|
37
|
Zou R, Zhao W, Xiao S and Lu Y: A
signature of three apoptosis-related genes predicts overall
survival in breast cancer. Front Surg. 9(863035)2022.PubMed/NCBI View Article : Google Scholar
|
|
38
|
Zhang Y, Yang Y, Liu R, Meng Y, Tian G and
Cao Q: Downregulation of microRNA-425-5p suppresses cervical cancer
tumorigenesis by targeting AIFM1. Exp Ther Med. 17:4032–4038.
2019.PubMed/NCBI View Article : Google Scholar
|
|
39
|
Fang Y, Liu J, Zhang Q, She C, Zheng R,
Zhang R, Chen Z, Chen C and Wu J: Overexpressed VDAC1 in breast
cancer as a novel prognostic biomarker and correlates with immune
infiltrates. World J Surg Oncol. 20(211)2022.PubMed/NCBI View Article : Google Scholar
|
|
40
|
Liu Z and Chan FK: Regulatory mechanisms
of RIPK1 in cell death and inflammation. Semin Cell Dev Biol.
109:70–75. 2021.PubMed/NCBI View Article : Google Scholar
|
|
41
|
Kwok C, Pavlosky A, Lian D, Jiang J, Huang
X, Yin Z, Liu W, Haig A, Jevnikar AM and Zhang ZX: Necroptosis is
involved in CD4+ T cell-mediated microvascular endothelial cell
death and chronic cardiac allograft rejection. Transplantation.
101:2026–2037. 2017.PubMed/NCBI View Article : Google Scholar
|
|
42
|
Zhang Z, Li J, He T and Ding J:
Bioinformatics identified 17 immune genes as prognostic biomarkers
for breast cancer: Application study based on artificial
intelligence algorithms. Front Oncol. 10(330)2020.PubMed/NCBI View Article : Google Scholar
|
|
43
|
Tekpli X, Lien T, Røssevold AH, Nebdal D,
Borgen E, Ohnstad HO, Kyte JA, Vallon-Christersson J, Fongaard M,
Due EU, et al: An independent poor-prognosis subtype of breast
cancer defined by a distinct tumor immune microenvironment. Nat
Commun. 10(5499)2019.PubMed/NCBI View Article : Google Scholar
|
|
44
|
Shi W, Chen Z, Liu H, Miao C, Feng R, Wang
G, Chen G, Chen Z, Fan P, Pang W and Li C: COL11A1 as an novel
biomarker for breast cancer with machine learning and
immunohistochemistry validation. Front Immunol.
13(937125)2022.PubMed/NCBI View Article : Google Scholar
|