Introduction
Prostate cancer (Pca) is the second most commonly
diagnosed cancer and the fifth leading cause of cancer-related
deaths among men worldwide (1). In
the United States of America (USA) alone it is estimated that there
were ~288,300 new cases of Pca and 34,700 deaths from the disease
in 2021, and this number increased to 3,523,230 in 2022 (2,3).
Therefore, Pca remains the most frequently diagnosed cancer among
men (2). Early detection and
treatment are crucial for improving prognosis and survival rates in
patients with Pca (4).
Prostate-specific antigen (PSA) is a protein
produced by the prostate gland, and its levels can be measured
through a simple blood test. The PSA test is widely used for Pca
screening (5,6); however, its effectiveness in reducing
mortality from Pca remains controversial (7). Elevated PSA levels can also be caused
by non-cancerous conditions such as prostatitis and benign
prostatic hyperplasia, which can lead to false-positive results and
unnecessary biopsies (6,8-10).
High-density lipoprotein cholesterol (HDL-C) is a
lipoprotein that transports cholesterol from peripheral tissues to
the liver for excretion. HDL-C is commonly referred to as ‘good’
cholesterol because it has been revealed to have protective effects
against cardiovascular disease (11). Previously, several studies have
investigated the association between HDL-C levels and Pca risk.
Several hypotheses have been proposed to explain the potential link
between HDL-C levels and Pca. One theory is that high levels of
HDL-C may be protective against Pca by removing excess cholesterol
from prostate cells and reducing oxidative stress (12). Conversely, another hypothesis
posits low HDL-C levels may be a result of inflammation, which has
been linked to the development and progression of Pca (13).
In addition to its potential role in Pca risk, HDL-C
levels may also be related to PSA levels. An inverse association
between HDL-C levels and PSA levels has been reported, suggesting
that men with higher HDL-C levels may have lower PSA levels
(14). However, the relationship
between HDL-C and PSA levels is not fully understood, and
additional research is needed to clarify this association.
Therefore, the purpose of the present study was to examine the
relationship between HDL-C and PSA in men from USA using the
National Health and Nutrition Examination Survey (NHANES) database
and to discuss the potential implications of this relationship for
Pca screening and diagnosis.
Materials and methods
Data availability
The NHANES, initially established in 1960, is a
survey conducted by the National Center for Disease Control and the
Prevention National Center for Health Statistics. The objective of
this assessment is to evaluate the physical well-being and dietary
condition of both adults and children living in USA. Demographic
and methodological information were searched in the NHANES website
[www.cdc.gov/nchs/nhanes (15)], viewed on October 7, 2022. The
NHANES protocols have been authorized by the National Center for
the Health Statistics Research Ethics Review Board.
Study population
NHANES employs a stratified, multi-stage random
sampling design, serving as a nationally representative nutrition
survey of the broader USA population. For the present study, five
cycles of NHANES data were incorporated covering the period from
2001 to 2010. The dataset utilized for the secondary analysis
encompasses PSA concentrations, socio-demographic data and
laboratory information.
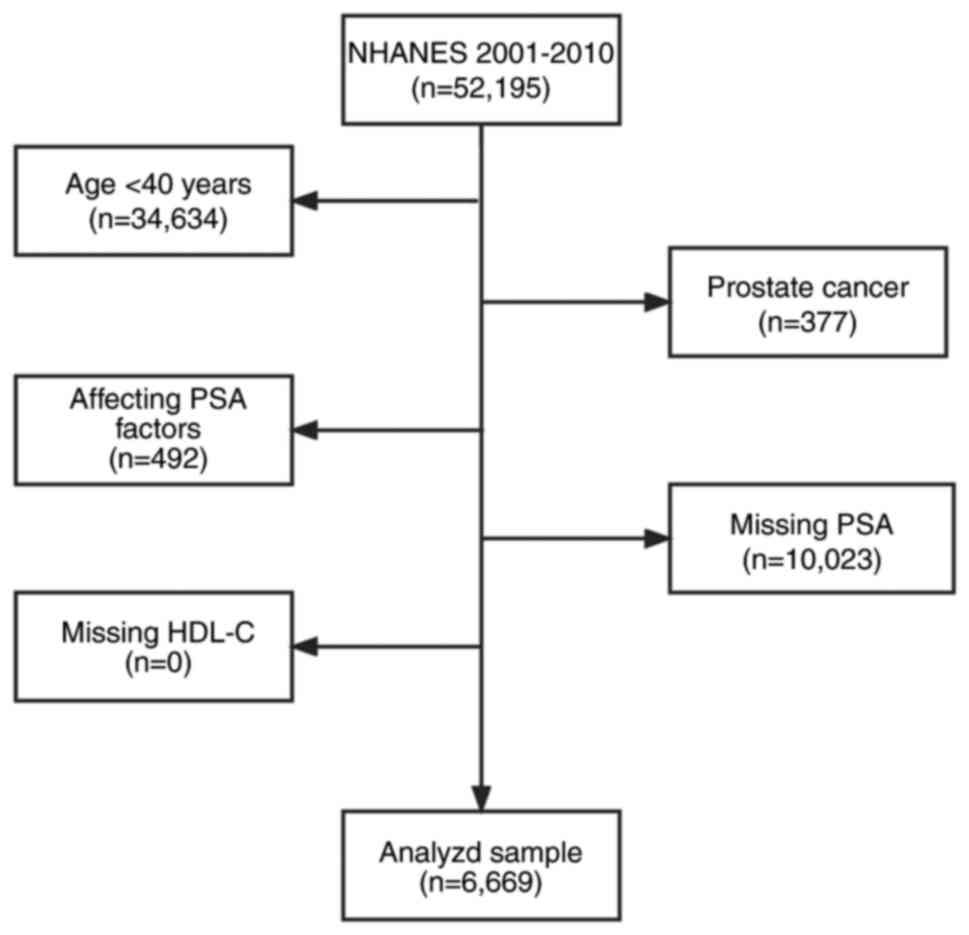
To ensure the accuracy and relevance of the present
study's findings, participants based on specific criteria were
systematically excluded: (i) Age below 40 years (n=34,634); (ii)
individuals diagnosed with Pca (n=377); (iii) individuals with
factors that could impact PSA levels, such as a prostatitis
diagnosis, statin drug usage, a recent prostate biopsy within one
week, or urinary system surgery within one month (n=492); and (iv)
participants with missing PSA data (n=10,023); (v) Notably, there
were no instances of missing HDL-C data (n=0).
After a thorough screening process, 6,669
individuals from the initial 52,195 participants were included in
the present study, as illustrated in Fig. 1. Furthermore, the present study
adheres to the ethical guidelines set by the world medical
association's declaration of Helsinki for research design and
conduct. The data analysis of the present study is based on the
robust and representative NHANES data.
Statistical analysis
All statistical analyses were conducted by using the
R Package and EmpowerStats (http://www.empowerstats.net), utilizing the complex
weighted sampling design from NHANES. Participants were
characterized according to the quartiles of HDL-C: Category 1
(19-40), Category 2 (40-46), Category 3 (46-56) and Category 4
(56-148). For categorical variables, percentages were used, while
the means ± standard deviations were calculated for continuous
variables.
To investigate group differences, weighted
chi-square tests were performed for categorical variables and
linear regression models for continuous variables. The link between
HDL-C and PSA levels was assessed using a weighted multivariate
linear regression model. A total of three models were established:
An unadjusted model (Model 1), a minimally adjusted model (Model 2)
accounting for factors such as poverty-income ratio, ethnicity,
military participation, marriage and education, and a fully
adjusted model (Model 3) with additional adjustments for
triglycerides, low density lipoprotein cholesterol (LDL-C),
monocyte count, neutrophil count, red blood cell count,
haemoglobin, platelet count and C-reactive protein.
Stratified analyses were conducted based on age,
family income, ethnicity, military status, marital status and
education, with interactions examined. Additionally, assuming the
normal reference value range of HDL-C as 1.04 mmol/l, a weighted
multivariate linear regression analysis was performed, excluding
individuals with HDL-C levels <1.04 µg/dl to limit the impact of
very low HDL-C in men from USA. P<0.05 was considered to
indicate a statistically significant deference.
Results
Baseline characteristics of the
selected participant
A statistical analysis was performed on HDL-C,
triglyceride and PSA levels. Grouping HDL-C into four quartiles
(Q1-Q4), there were no significant differences in military
participation or platelet count between the quartile groups.
Participants with higher PSA, older age, higher household income,
higher level of education, married, high in vitamin D, high LDL-C
and high in total cholesterol present high HDL-C levels.
Conversely, individuals with elevated serum HDL-C have lower
triglycerides, lower white blood cell count, lower lymphocyte
number, lower monocyte number, lower neutrophils, lower red blood
cells, lower haemoglobin and lower C-reactive protein. As
demonstrated in Table I,
non-Hispanic whites were the main participants in the present
study.
 | Table IBaseline characteristics of the
selected participants. |
Table I
Baseline characteristics of the
selected participants.
| HDL-cholesterol
(mmol/l) | Q1 | Q2 | Q3 | Q4 | P-value |
|---|
| N | 1,458 | 1,682 | 1,797 | 1,732 | |
| Total prostate
specific antigen (ng/ml) | 1.56±2.97 | 1.64±2.18 | 1.73±2.78 | 1.94±3.67 | 0.002 |
| Age (years) | 57.2±11.76 | 58.43±11.74 | 58.93±12.09 | 59.44±11.73 | <0.001 |
| Family income | 2.62±1.61 | 2.78±1.59 | 2.95±1.64 | 2.91±1.66 | <0.001 |
| Military Status | | | | | 0.285 |
|
Yes | 467 (32.03%) | 583 (34.66%) | 613 (34.13%) | 608 (35.10%) | |
|
No | 991 (67.97%) | 1,099 (65.34%) | 1,183 (65.87%) | 1,124 (64.90%) | |
| Education | | | | | <0.001 |
|
Less than
high school graduate | 505 (34.66%) | 503 (29.90%) | 541 (30.16%) | 500 (28.90%) | |
|
High school
graduate | 353 (24.23%) | 408 (24.26%) | 398 (22.19%) | 389 (22.49%) | |
|
More than
high school graduate | 599 (41.11%) | 771 (45.84%) | 855 (47.66%) | 841 (48.61%) | |
| Marital status | | | | | <0.001 |
|
Married | 1,015 (69.66%) | 1,163 (69.27%) | 1,287 (71.62%) | 1,101 (63.64%) | |
|
Single | 361 (24.78%) | 439 (26.15%) | 429 (23.87%) | 535 (30.92%) | |
| Living with a
partner | 81 (5.56%) | 77 (4.59%) | 81 (4.51%) | 94 (5.43%) | |
| Ethnicity | | | | | <0.001 |
|
Mexican
American | 305 (20.92%) | 332 (19.74%) | 338 (18.81%) | 238 (13.74%) | |
|
Other
Hispanic | 116 (7.96%) | 90 (5.35%) | 111 (6.18%) | 99 (5.72%) | |
|
Non-Hispanic
White | 825 (56.58%) | 942 (56.00%) | 950 (52.87%) | 859 (49.60%) | |
|
Non-Hispanic
Black | 157 (10.77%) | 264 (15.70%) | 341 (18.98%) | 483 (27.89%) | |
|
Other
ethnicity | 55 (3.77%) | 54 (3.21%) | 57 (3.17%) | 53 (3.06%) | |
| Vitamin D
(nmol/l) | 58.73±19.95 | 59.66±20.19 | 61.41±20.90 | 60.87±23.90 | 0.002 |
| Triglyceride
(mmol/l) | 2.96±2.55 | 1.97±2.08 | 1.58±1.50 | 1.15±0.64 | <0.001 |
| Low density
lipoprotein-cholesterol (mmol/l) | 2.87±0.95 | 3.14±0.90 | 3.20±0.90 | 3.12±093 | <0.001 |
| Total cholesterol
(mmol/l) | 5.07±1.23 | 5.34±1.29 | 5.33±1.10 | 5.37±1.01 | <0.001 |
| White blood cell
count (1,000 cells/µl) | 7.78±3.31 | 7.33±3.03 | 6.93±2.03 | 6.69±2.20 | <0.001 |
| Lymphocyte number
(1,000 cells/µl) | 2.25±1.06 | 2.13±2.28 | 1.97±0.76 | 1.92±1.02 | <0.001 |
| Monocyte number
(1,000 cells/µl) | 0.61±0.21 | 0.58±0.21 | 0.55±0.18 | 0.56±0.19 | <0.001 |
| Segmented
neutrophils number (1,000 cells/µl) | 4.62±2.69 | 4.34±1.58 | 4.15±1.62 | 3.96±1.62 | <0.001 |
| Red blood cell
count (million cells/µl) | 4.92±0.48 | 4.91±0.47 | 4.90±0.46 | 4.77±0.48 | <0.001 |
| Haemoglobin
(g/dl) | 15.13±1.38 | 15.08±1.33 | 15.04±1.25 | 14.84±1.32 | <0.001 |
| Platelet count
(1,000 cells/µl) | 242.19±68.64 | 245.41±66.04 | 242.26±60.19 | 239.95±62.17 | 0.182 |
| C-reactive protein
(mg/dl) | 0.55±1.17 | 0.46±0.96 | 0.37±0.86 | 0.33±0.82 | <0.001 |
Link between PSA concentration and
serum HDL-C
Univariate and multivariate analyses was performed
using weighted linear models, resulting in three weighted
univariate and multivariate linear regression models. First, in the
unadjusted model, for each unit increase in the HDL-C ratio, PSA
concentration increased by 0.470 ng/ml (0.281, 0.659) (P<0.001).
In a minimum adjustment model, which accounted for factors such as
poverty-income ratio, ethnicity, military enlistment, marriage and
education, PSA concentrations increased by 0.408 ng/ml (0.227,
0.589) (P<0.001), for each unit increase in serum HDL-C.
Further adjustments were made in the fully adjusted
model, which included additional factors including poverty income
ratios (PIRs), ethnicity, military enlistment, marriage, education,
triglycerides, LDL-C, number of monocytes, number of neutrophils;
number of red blood cells, haemoglobin, number of platelets and
C-reactive protein. In this model, PSA concentrations rose by 0.400
ng/ml (0.099,0.701) (P<0.009) for each additional unit of serum
HDL-C. The results of linear relationship analyses are presented in
Table II.
| Table IIUnivariate and multivariate analyses
by the weighted linear model. |
Table II
Univariate and multivariate analyses
by the weighted linear model.
| Exposure | Non-adjusted
model | Minimally adjusted
model | Fully adjusted
model |
|---|
|
HDL-cholesterol | 0.470 (0.281,0.659)
<0.001 | 0.408 (0.227,0.589)
<0.001 | 0.400 (0.099,0.701)
0.009 |
|
HDL-cholesterol | | | |
| Q1 | Ref | Ref | Ref |
| Q2 | 0.077
(-0.130,0.284) 0.467 | 0.108
(-0.086,0.303) 0.275 | -0.001
(-0.312.0.310) 0.995 |
| Q3 | 0.166
(-0.038,0.370) 0.109 | 0.196 (0.004,0.389)
0.045 | 0.064
(-0.249,0.377) 0.689 |
| Q4 | 0.377 (0.172,0.583)
0.001 | 0.351 (0.156,0.546)
0.001 | 0.228
(-0.112.0.568) 0.189 |
| P for trend | <0.001 | <0.001 | 0.026 |
Sensitivity analysis
Sensitivity analyses was performed to confirm the
accuracy and robustness of the results of the present study. First,
serum HDL-C was converted as a continuous variable to a categorical
variable based on quartile values and then the P-value of the trend
was calculated (Table II).
Surprisingly, the results of the categorical variable were
consistent with the effect of serum HDL-C as a continuous
variable.
To further investigate the potential linear
relationship between serum HDL-C and PSA concentration, a smoothed
curve based on a fully adjusted model was constructed. As
demonstrated in Fig. 2A, most of
the samples clustered at HDL-C concentration to the left of the 2.5
mmol/l vertical line, and the trend of sample distribution was not
very clear. The final adjusted smoothed curve fit is shown in
fig. 2B. The curve fit
demonstrated a positive linear correlation between HDL-C and PSA;
for every 1 mmol/l increase in serum HDL-C, the PSA concentration
increased by 0.400 ng/ml. These results suggested a positive
correlation between serum HDL-C and PSA concentration.
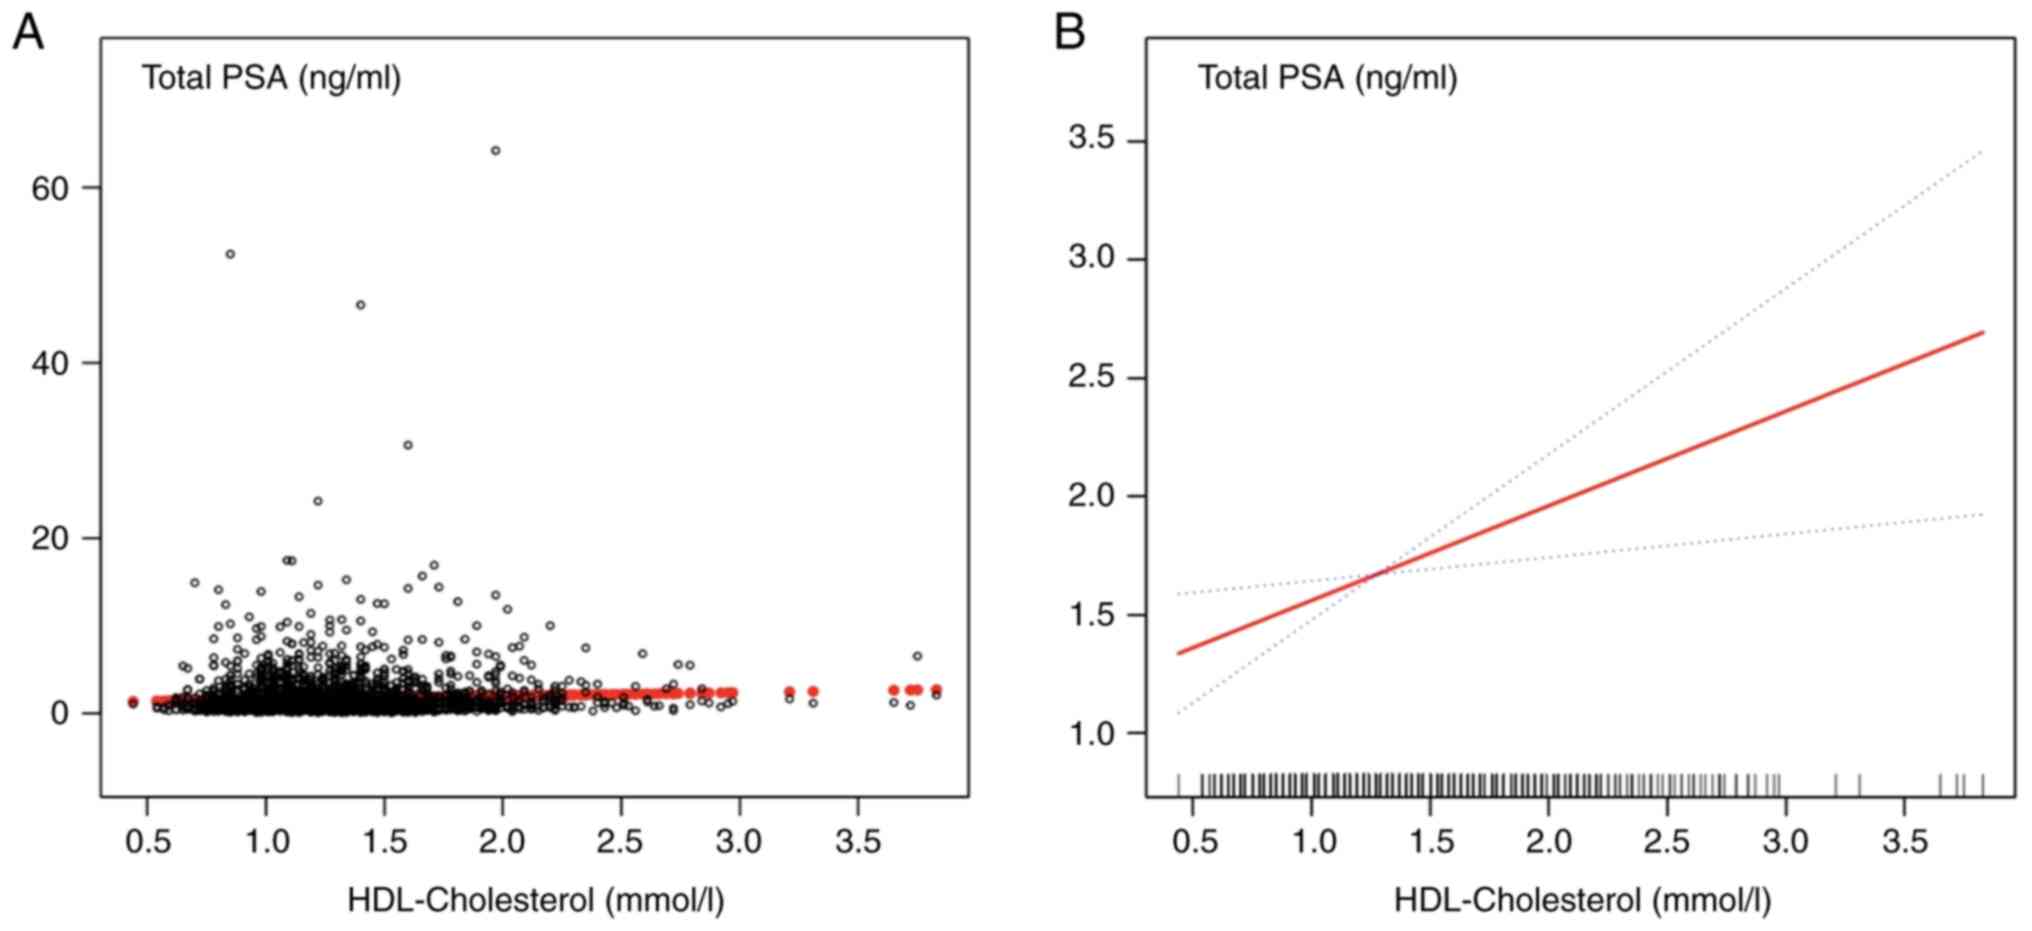 | Figure 2Representation of the fully adjusted
smooth curve fitting model. (A) Each black dot represents a sample.
(B) The red line represents the smooth curve fit between the
variables. The blue line represents the 95% confidence interval for
the fit, adjusted for poverty-income ratio, ethnicity, military
service, marriage, education, triglycerides, low-density
lipoprotein cholesterol, monocyte count, neutrophil count, red
blood cell count and haemoglobin. HDL, high-density lipoprotein
cholesterol. |
Stratified association between HDL-C
and PSA
An analysis was performed to determine the
hierarchical relationship between PSA and HDL-C. The findings of
the present study revealed a 25.2% reduction in PSA concentrations
among individuals with low HDL-C and low household income [hazard
ratio (HR=0.748), P<0.001]. Among those with higher household
incomes, PSA concentrations were reduced by 58.0% in individuals
with low HDL-C (HR=0.420, P=0.011). Additionally, PSA
concentrations were reduced by 6.8% among those with lower than
secondary education (HR=0.932, P<0.001). The interaction test
showed that the effect of household income on PSA concentration was
significantly affected by HDL-C levels (P=0.037). These findings
suggested a link between low HDL-C levels and lower PSA
concentrations, with this association being stronger in individuals
with lower household income (Table
III).
| Table IIIEffect size of HDL-cholesterol on
prostate-specific antigen in the prespecified and exploratory
subgroup. |
Table III
Effect size of HDL-cholesterol on
prostate-specific antigen in the prespecified and exploratory
subgroup.
|
HDL-cholesterol | N | Β | 95% CI low | 95% CI high | P-value | P for
interaction |
|---|
| Stratified by age,
years | | | | | | 0.190 |
|
<60 | 3,630 | 0.266 | 0.020 | 0.511 | 0.034 | |
|
60-80 | 2,796 | 0.618 | 0.329 | 0.907 | <0.001 | |
|
>80 | 243 | 0.399 | -0.626 | 1.424 | 0.446 | |
| Stratified by ratio
of family income | | | | | | 0.037 |
|
Low
group | 2,075 | 0.748 | 0.453 | 1.043 | <0.001 | |
|
Median
group | 2,082 | 0.194 | -0.116 | 0.504 | 0.220 | |
|
High
group | 2,079 | 0.420 | 0.094 | 0.746 | 0.011 | |
| Stratified by
ethnicity | | | | | | 0.663 |
|
Mexican
American | 1,213 | 0.268 | -0.217 | 0.753 | 0.278 | |
|
Other
Hispanic | 416 | 0.429 | -0.411 | 1.268 | 0.317 | |
|
Non-Hispanic
White | 3,576 | 0.314 | 0.038 | 0.590 | 0.025 | |
|
Non-Hispanic
Black | 1,245 | 0.646 | 0.279 | 1.013 | 0.001 | |
|
Other
ethnicity | 219 | 0.447 | -0.663 | 1.557 | 0.430 | |
| Stratified by
military status | | | | | | 0.249 |
|
Yes | 2,271 | 0.305 | -0.026 | 0.635 | 0.071 | |
|
No | 4,397 | 0.541 | 0.311 | 0.771 | <0.001 | |
| Stratified by
marital status | | | | | | 0.310 |
|
Married | 4,566 | 0.345 | 0.100 | 0.590 | 0.005 | |
|
Single | 1,764 | 0.662 | 0.333 | 0.991 | <0.001 | |
|
Living with
a partner | 333 | 0.380 | -0.348 | 1.108 | 0.306 | |
| Stratified by
education | | | | | | 0.006 |
|
Less than
9th grade | 2,049 | 0.932 | 0.599 | 1.264 | <0.001 | |
|
High school
graduate | 1,548 | 0.264 | -0.117 | 0.645 | 0.174 | |
|
More than
9th grade | 3,066 | 0.279 | -0.009 | 0.567 | 0.057 | |
Results of weighted linear regression
modelling of the association between serum HDL-C and PSA after
excluding individuals with HDL-C abnormalities (<1.04
mmol/l)
First, in the unadjusted model, for every 1 mmol/l
increase in HDL-C concentration, PSA concentration increased by
0.53 ng/ml (P<0.001). Second, in the minimum adjustment model
which accounted for factors such as PIR, ethnicity, military
enlistment, marital status and education, PSA concentration
increased by 0.42 ng/ml for every 1 mmol/l increase in HDL-C
concentration (P=0.01).
Third, after completely adjusting the poverty-income
ratio, ethnicity, joining the army, marital status, education,
triglycerides, LDL-C, monocyte count, neutrophil count, red blood
cell count, haemoglobin, platelet count and C-reactive protein, PSA
concentration increased by 0.50 ng/ml for every 1 mmol/l increase
in HDL-C concentration (P=0.009). Even after excluding participants
with HDL-C levels <1.04 mmol/l, this positive association
remained evident in adult men in USA. These findings suggested that
HDL-C is positively correlated with PSA in adult men, even at a
reference concentration of >1.04 mmol/l (Table IV).
| Table IVResults of weighted linear regression
modelling for associations of the HDL-cholesterol with
prostate-specific antigen after excluding individual blood
HDL-cholesterol concentrations <1.04 mmol/l. |
Table IV
Results of weighted linear regression
modelling for associations of the HDL-cholesterol with
prostate-specific antigen after excluding individual blood
HDL-cholesterol concentrations <1.04 mmol/l.
| Exposure | Non-adjusted
model | Minimally adjusted
model | Fully adjusted
model |
|---|
|
HDL-cholesterol | 0.53 (0.27,0.79)
<0.001 | 0.42 (0.16,0.67)
0.001 | 0.50 (0.12,0.87)
0.009 |
|
HDL-cholesterol | | | |
| Q1 | Ref | Ref | Ref |
| Q2 | 0.00 (-0.25,0.26)
0.9777 | 0.04 (-0.21,0.28)
0.7748 | -0.06 (-0.39,0.28)
0.7381 |
| Q3 | 0.21 (-0.05,0.47)
0.1078 | 0.22 (-0.03,0.47)
0.0910 | 0.20 (-0.15,0.54)
0.2601 |
| Q4 | 0.39 (0.14,0.65)
0.0027 | 0.31 (0.06,0.56)
0.0163 | 0.35 (-0.01,0.72)
0.0568 |
| P for trend | 0.003 | 0.010 | 0.046 |
Discussion
The present study represents one of the most
comprehensive cross-sectional studies to determine the association
between HDL-C and PSA. It is also the first, to the best of our
knowledge, to examine this relationship in men from USA without a
history of Pca using the NHANES database. The first analysis relied
on checking the stratified connection between HDL-C and PSA. In
this analysis, participants were classified based on various
factors, such as family income (low group, median group, and high
group), education, ethnicity (Mexican American, Other Hispanic,
Non-Hispanic White, Non-Hispanic Black and other ethnicity),
military and marital status (married, single, or living with a
partner).
Other researchers suggested a decreased risk of Pca
associated with higher HDL-C levels; the weighted median approach
indicated the possibility of a different correlation, and the
mechanism behind this association remains unclear (16).
However, the positive association between serum
HDL-C and PSA concentrations observed in the present study was
consistent with the results of previous studies. It was found that
men with higher serum lipid show increased aggressiveness of Pca
(17,18). Additionally, it has been reported
that high HDL-C levels were associated with an increased risk of
several diseases (19). Moreover,
the univariable randomization analysis revealed that the genetic
prediction of Lp(a) had a negligible correlation with the overall
incidence of Pca (20). One
hypothesis suggests that high HDL-C levels may increase androgen
hormone production, which can promote Pca cell proliferation, while
a recent study proposed that HDL-C might serve as a biomarker for
chronic inflammation, which promotes the progression of Pca
(21).
The stratified analysis of the present revealed a
stronger inverse correlation between lower HDL-C levels and reduced
PSA concentrations, particularly among individuals with higher
family incomes. This suggests socioeconomic factors, such as
lifestyle habits and healthcare access, may contribute to this
observed relationship. Another study identified a significant
association between obesity and high-grade Pca on biopsy, and
highlighted the role of metabolic health factors, including HDL-C
and obesity, influencing Pca risk and progression (22). Aligned with the findings of the
present study, previous research by Jamnagerwalla et al
(23) reported that low HDL-C
levels were associated with increased Pca risk in men with lower
educational attainment.
The findings of the present study contrast with a
previous study on HDL-C and PSA, which report varying associations
between lipids and Pca risk, with some indicating a favourable link
and others suggesting a negative relationship between the two
factors (24). The aforementioned
study was used to select 13 relevant publications for an
epidemiological investigation exploring the association between
HDL-C and Pca. Out of these, three publications established a
direct connection between HDL-C levels and the occurrence of
cancer, whereas five articles indicated a marginal correlation
between HDL-C and cancer (25).
While these studies are consistent with the findings of the present
study, it is important to not dismiss those that suggest a negative
or no correlation between HDL-C and PSA. Hence, it is necessary to
conduct more data analysis to verify this association and to
determine if other risk factors are closely related to the
occurrence and development of Pca.
Overall, the present study supports the conception
that HDL positively correlates with PSA (26), indicating that higher HDL-C levels
lead to increased PSA concentrations, thereby raising the
probability of diagnosing Pca. These findings suggest that this
relationship could be employed as a viable cancer screening
approach, potentially improving PSA test specificity in men with
high triglycerides. Therefore, implementation of this Pca detection
mechanism, could help early treatment and prevent cancer from
spreading. In most cases, identifying cancer earlier means there
will be a reduced need for aggressive treatment which can help the
patients save their lives (27).
Furthermore, the benefits of the present study
outweigh those of earlier research on the same topic. First, the
present study comprises 6,669 male participants, resulting in more
accurate and convincing results than other small sample studies, as
well as more objective research findings. Second, the present study
is the first large-scale cross-sectional study, which found a poor
relationship between serum HDL-C and PSA in men from USA with no
history of Pca. This establishes a basis for further extensive
research on this topic to achieve more definitive results. Third,
the sample in the present study is a multi-level random sample,
representing the general population in USA, and has highly reliable
and standardized data. Simultaneously, multi-layer random sampling
technology provides researchers with more freedom and flexibility
in selecting samples, which is also conducive to the data
collection of geographically dispersed populations. Fourth, the
present study has made certain contributions to the existing
knowledge base. Researchers have established a connection between
elevated levels of HDL and an increased risk of Pca. Using this
detection method can improve early cancer detection, allowing
patients to start treatment sooner and prevent the cancer from
spreading. Finally, the relationship between serum HDL-C and PSA
using both linear and non-linear methods was analyzed, considering
other factors that might affect the results. By applying
generalized estimation equation analysis, reliable findings were
able to be obtained that support these hypotheses. However, the
present study had certain limitations including the cross-sectional
design, which limits the ability to establish causality, and the
use of a single PSA measurement, which may not accurately reflect
long-term PSA levels. Thus, prospective cohort studies are needed
to confirm the causality. Moreover, the study population is mostly
non-Hispanic white, which may limit how well the findings of the
present study apply to other ethnic groups. Additionally, the
present study was based on the NHANES database, which is restricted
to the population of USA. Thus, generalizability is geographically
restricted. To address these issues, further research is needed in
the future.
While the present study provided valuable insights,
further research is needed to clarify and extend these results,
particularly in relation to patients with Pca. Future studies
should aim to include a cohort of patients with Pca to determine
whether the observed effects are consistent across different cancer
types. In conclusion, the present study found a positive
association between serum HDL-C and PSA concentrations in adult men
in USA without a Pca diagnosis.
Acknowledgements
Not applicable.
Funding
Funding: The present study was supported by the National Natural
Science Foundation of China (grant nos. 82072809 and 82173221) and
the Joint Funds of the Zhejiang Provincial Natural Science
Foundation of China (grant no. LHDMZ23H160004).
Availability of data and materials
The data generated in the present study may be
requested from the corresponding author.
Authors' contributions
MMA conceptualized the study and wrote the original
draft. BH, SMH and MMA acquired and analysed the data. YD, MY and
MMA interpreted the data. MMA and SMH confirm the authenticity of
all the raw data. GL and SMH reviewed and edited the manuscript.
YD, GL and BH reviewed, edited and critically analysed the results.
GL and YD supervised the present study. All authors read and
approved the final version of the manuscript.
Ethics approval and consent to
participate
Not applicable.
Patient consent for publication
Not applicable.
Competing interests
The authors declare that they have no competing
interests.
References
|
1
|
Wang L, Lu B, He M, Wang Y, Wang Z and Du
L: Prostate cancer incidence and mortality: Global status and
temporal trends in 89 countries from 2000 to 2019. Front Public
Health. 10(811044)2022.PubMed/NCBI View Article : Google Scholar
|
|
2
|
Sung H, Ferlay J, Siegel RL, Laversanne M,
Soerjomataram I, Jemal A and Bray F: Global cancer statistics 2020:
GLOBOCAN estimates of incidence and mortality worldwide for 36
cancers in 185 countries. CA Cancer J Clin. 71:209–249.
2021.PubMed/NCBI View Article : Google Scholar
|
|
3
|
Siegel RL, Miller KD, Fuchs HE and Jemal
A: Cancer statistics, 2022. CA Cancer J Clin. 72:7–33.
2022.PubMed/NCBI View Article : Google Scholar
|
|
4
|
Grubb RL III: Prostate cancer: Update on
early detection and new biomarkers. Mo Med. 115:132–134.
2018.PubMed/NCBI
|
|
5
|
Narain TA and Sooriakumaran P: Beyond
prostate specific antigen: New prostate cancer screening options.
World J Mens Health. 40:66–73. 2022.PubMed/NCBI View Article : Google Scholar
|
|
6
|
Schröder FH, Hugosson J, Roobol MJ,
Tammela TL, Zappa M, Nelen V, Kwiatkowski M, Lujan M, Määttänen L,
Lilja H, et al: Screening and prostate cancer mortality: Results of
the European Randomised Study of Screening for Prostate Cancer
(ERSPC) at 13 years of follow-up. Lancet. 384:2027–2035.
2014.PubMed/NCBI View Article : Google Scholar
|
|
7
|
Carlsson SV and Vickers AJ: Screening for
prostate cancer. Med Clin North Am. 104:1051–1062. 2020.PubMed/NCBI View Article : Google Scholar
|
|
8
|
Parekh DJ, Punnen S, Sjoberg DD, Asroff
SW, Bailen JL, Cochran JS, Concepcion R, David RD, Deck KB,
Dumbadze I, et al: A multi-institutional prospective trial in the
USA Confirms that the 4Kscore accurately identifies men with
high-grade prostate cancer. Eur Urol. 68:464–470. 2015.PubMed/NCBI View Article : Google Scholar
|
|
9
|
Buddingh KT, Maatje MGF, Putter H, Kropman
RF and Pelger RCM: Do antibiotics decrease prostate-specific
antigen levels and reduce the need for prostate biopsy in type IV
prostatitis? A systematic literature review. Can Urol Assoc J.
12:E25–E30. 2018.PubMed/NCBI View Article : Google Scholar
|
|
10
|
Stattin P, Carlsson S, Holmstrom B,
Vickers A, Hugosson J, Lilja H and Jonsson H: Prostate cancer
mortality in areas with high and low prostate cancer incidence. J
Natl Cancer Inst. 106(dju007)2014.PubMed/NCBI View Article : Google Scholar
|
|
11
|
Tall AR: Cholesterol efflux pathways and
other potential mechanisms involved in the athero-protective effect
of high density lipoproteins. J Intern Med. 263:256–273.
2008.PubMed/NCBI View Article : Google Scholar
|
|
12
|
Murtola TJ, Syvälä H, Pennanen P, Bläuer
M, Solakivi T, Ylikomi T and Tammela TL: The importance of LDL and
Cholesterol metabolism for prostate epithelial cell growth. PLoS
One. 7(e39445)2012.PubMed/NCBI View Article : Google Scholar
|
|
13
|
Platz EA, Clinton SK and Giovannucci E:
Association between plasma cholesterol and prostate cancer in the
PSA era. Int J Cancer. 123:1693–1698. 2008.PubMed/NCBI View Article : Google Scholar
|
|
14
|
Mondul AM, Clipp SL, Helzlsouer KJ and
Platz EA: Association between plasma total cholesterol
concentration and incident prostate cancer in the CLUE II cohort.
Cancer Causes Control. 21:61–68. 2010.PubMed/NCBI View Article : Google Scholar
|
|
15
|
https://www.cdc.gov/nchs/nhanes/index.htm.
|
|
16
|
Mondul AM, Weinstein SJ, Virtamo J and
Albanes D: Serum total and HDL cholesterol and risk of prostate
cancer. Cancer Causes Control. 22:1545–1552. 2011.PubMed/NCBI View Article : Google Scholar
|
|
17
|
Zhao R, Cheng G, Wang B, Qin C, Liu Y, Pan
Y, Wang J, Hua L, Zhu W and Wang Z: BMI and serum lipid parameters
predict increasing risk and aggressive prostate cancer in Chinese
people. Oncotarget. 8:66051–66060. 2017.PubMed/NCBI View Article : Google Scholar
|
|
18
|
Platz EA, Leitzmann MF, Visvanathan K,
Rimm EB, Stampfer MJ, Willett WC and Giovannucci E: Statin drugs
and risk of advanced prostate cancer. J Natl Cancer Inst.
98:1819–1825. 2006.PubMed/NCBI View Article : Google Scholar
|
|
19
|
Mørland JG, Magnus P, Vollset SE, Leon DA,
Selmer R and Tverdal A: Associations between serum high-density
lipoprotein cholesterol levels and cause-specific mortality in a
general population of 345 000 men and women aged 20-79 years. Int J
Epidemiol. 52:1257–1267. 2023.PubMed/NCBI View Article : Google Scholar
|
|
20
|
Ioannidou A, Watts EL, Perez-Cornago A,
Platz EA, Mills IG, Key TJ and Travis RC: PRACTICAL consortium,
CRUK BPC3, et al. The relationship between lipoprotein A and
other lipids with prostate cancer risk: A multivariable Mendelian
randomisation study. PLoS Med. 19(e1003859)2022.PubMed/NCBI View Article : Google Scholar
|
|
21
|
Senapati D, Sharma V, Rath SK, Rai U and
Panigrahi N: Functional implications and therapeutic targeting of
androgen response elements in prostate cancer. Biochimie. 214(Pt
B):188–198. 2023.PubMed/NCBI View Article : Google Scholar
|
|
22
|
Baio R, Napodano G, Caruana C, Molisso G,
Di Mauro U, Intilla O, Pane U, D'Angelo C, Francavilla AB,
Guarnaccia C, et al: Association between obesity and frequency of
high-grade prostate cancer on biopsy in men: A single-center
retrospective study. Mol Clin Oncol. 17(127)2022.PubMed/NCBI View Article : Google Scholar
|
|
23
|
Jamnagerwalla J, Howard LE, Allott EH,
Vidal AC, Moreira DM, Castro-Santamaria R, Andriole GL, Freeman MR
and Freedland SJ: Serum cholesterol and risk of high-grade prostate
cancer: Results from the REDUCE study. Prostate Cancer Prostatic
Dis. 21:252–259. 2018.PubMed/NCBI View Article : Google Scholar
|
|
24
|
Van Hemelrijck M, Garmo H, Holmberg L,
Walldius G, Jungner I, Hammar N and Lambe M: Prostate cancer risk
in the Swedish AMORIS study The interplay among triglycerides,
total cholesterol, and glucose. Cancer. 117:2086–2095.
2011.PubMed/NCBI View Article : Google Scholar
|
|
25
|
Kotani K, Sekine Y, Ishikawa S, Ikpot IZ,
Suzuki K and Remaley AT: High-density lipoprotein and prostate
cancer: An overview. J Epidemiol. 23:313–319. 2013.PubMed/NCBI View Article : Google Scholar
|
|
26
|
Van Hemelrijck M, Walldius G, Jungner I,
Hammar N, Garmo H, Binda E, Hayday A, Lambe M and Holmberg L: Low
levels of apolipoprotein A-I and HDL are associated with risk of
prostate cancer in the Swedish AMORIS study. Cancer Causes Control.
22:1011–1019. 2011.PubMed/NCBI View Article : Google Scholar
|
|
27
|
Albertsen PC: Prostate cancer screening
and treatment: Where have we come from and where are we going? BJU
Int. 126:218–224. 2020.PubMed/NCBI View Article : Google Scholar
|