Introduction
There are >1,000 species of bacteria in the
intestinal tract, known as intestinal microbiota. The genomes of
these species encode >100-fold unique genes compared to the
human genome (1). The intestinal
microbiota is dominated by five bacterial phyla (Firmicutes,
Bacteroidetes, Actinobacteria, Proteobacteria and Verrucomicrobia)
and one Archaea (Euryarchaeota) (2). These complex communities of
microorganisms play an important role in metabolic, nutritional,
physiological and immunological processes in the human body
(3). Molecular characterization of
the intestinal microbiota by phylogenetic approaches has received
considerable attention in recent years and revealed a remarkable
compositional stability and resilience in adult life, even after
pervasive treatments with antibiotics (4). Species of the genera
Bifidobacterium and Lactobacillus are particularly
present in the colon of healthy individuals, and they are generally
regarded as desirable, owing to the reduction of the neutral pH to
a more acidic pH that they cause (5). Changes in microbial community
composition are closely associated with various diseases, such as
allergic disease (6), colorectal
cancer (7) and intestinal
inflammatory disease (8).
Our understanding of intestinal microbiota and their
importance for the human physiology has increased, owing to
international research initiatives such as the MetaHIT project
(1) and the Human Microbiome
Project (9). However, the
development of simple protocols for the manipulation of intestinal
microbiota in experimental animal models is still needed. Recently,
a study focusing on the effects of intestinal microbiota depletion
on the gut mucosa and epithelial gene expression was performed;
depletion of the intestinal microbiota was achieved in mice by
administering broad-spectrum antibiotics in drinking water
(10). The study reported that
antibiotic treatment significantly reduced the expression of
antimicrobial factors to a level similar to that of germ-free mice,
and altered the expression of a total of 517 genes in the colonic
epithelium. The expression of genes involved in the cell cycle was
significantly altered, concomitant with reduced epithelial
proliferative activity in situ, as assessed by Ki-67
expression, which suggested that commensal microbiota drives
cellular proliferation in the colonic epithelium (10). Metabolites produced by the gut
microbiota community from processes such as oxidation reduction and
lipid metabolism have been reported to considerably affect
intestinal functions (1).
The present study used a previously released
microarray dataset (10) to assess
the effects of intestinal microbiota depletion in mice, by focusing
on the gene expression profiles of colonic intestinal epithelial
cells in the presence and absence of intestinal microbiota. These
profiles were analyzed using a series of bioinformatic methods,
including protein-protein interaction (PPI) network construction,
module functional annotation and pathway enrichment analyses.
Further research on the mechanisms identified here as affected by
the intestinal microbiota depletion is planned for a future
study.
Materials and methods
Affymetrix microarray analysis
The raw data and the probe annotation files from the
gene expression profiling dataset GSE22648 (10; accession no.
GDS3921) were downloaded from the Gene Expression Omnibus database
(the National Center of Biotechnology Information; http://www.ncbi.nlm.nih.gov/geo/query/acc.cgi?acc=GSE22648).
These data were obtained on a GPL6887 platform using MouseWG-6 v2.0
expression beadchips (Illumina, Inc., San Diego, CA, USA). Data
from a total of 11 chips were analyzed, corresponding to colonic
intestinal epithelial cell gene expression profiles of 5 replicates
from mice with depleted intestinal microbiota and 6 replicates from
control mice that were not treated with antibiotics
(germ-free).
Identification and clustering analysis of
differentially expressed genes (DEGs)
The raw data were preprocessed using the Affy
package in R (11). Differential
expression analysis between the 5 intestinal microbiota-depleted
and the 6 control samples was performed using limma, a linear
regression model software package available in R (12), and multiple testing correction was
performed using a Bayesian method (13). The DEGs between intestinal
microbiota-depleted and control samples were defined as these genes
showing a |log fold change (FC)| >1 and a false discovery rate
(FDR) <0.05. To visualize the expression profiles of DEGs and
all genes, unsupervised hierarchical clustering analysis was
performed (14).
PPI network construction
The search tool for the retrieval of interacting
genes (STRING) (15) database was
used to retrieve the predicted interactions for the identified
DEGs; the version 9.0 of STRING covers >1,100 completely
sequenced species. All associations available in STRING are
provided with a probabilistic confidence score, which was derived
by separately benchmarking groups of associations against the a
manually curated functional classification scheme (15). Each score represents a rough
estimate of how likely a given association describes a functional
linkage between two gene products. The DEGs with a confidence score
>0.8 were selected to construct the PPI network, using the
open-source Cytoscape software (16). Cytoscape (http://cytoscape.org/) allows visualizing complex
networks and integrating these networks to any type of attribute
data.
Functional analysis of modules from the
PPI network
The MCODE (17)
plugin in Cytoscape was used to further divide the PPI into
modules, using a cutoff value for the connectivity degree of nodes
(proteins in the network) >2. Gene Ontology (GO) functional
annotation and enrichment analysis of genes in the resulting
modules was performed using the PiNGO plugin in Cytoscape (18) with a threshold P<0.05 based on a
hypergeometric test.
Pathway analysis
Information on the biological pathways in which the
module-related DEGs are involved was retrieved from the Kyoto
Encyclopedia of Genes and Genomes pathways database (http://www.genome.jp/kegg/pathway.html)
(19,20). Visualization of these pathways and
enrichment analysis was performed using the GenMAPP software
(19). GenMAPP is a powerful tool
for graphically viewing microarray data in the context of pathway
analysis in an intuitive manner for biologists, and it was
previously used in the analysis of microarray data related to
allergic disease (21). P<0.05
was set as the threshold used for enrichment analysis of KEGG
pathways.
Results
Identification of DEGs
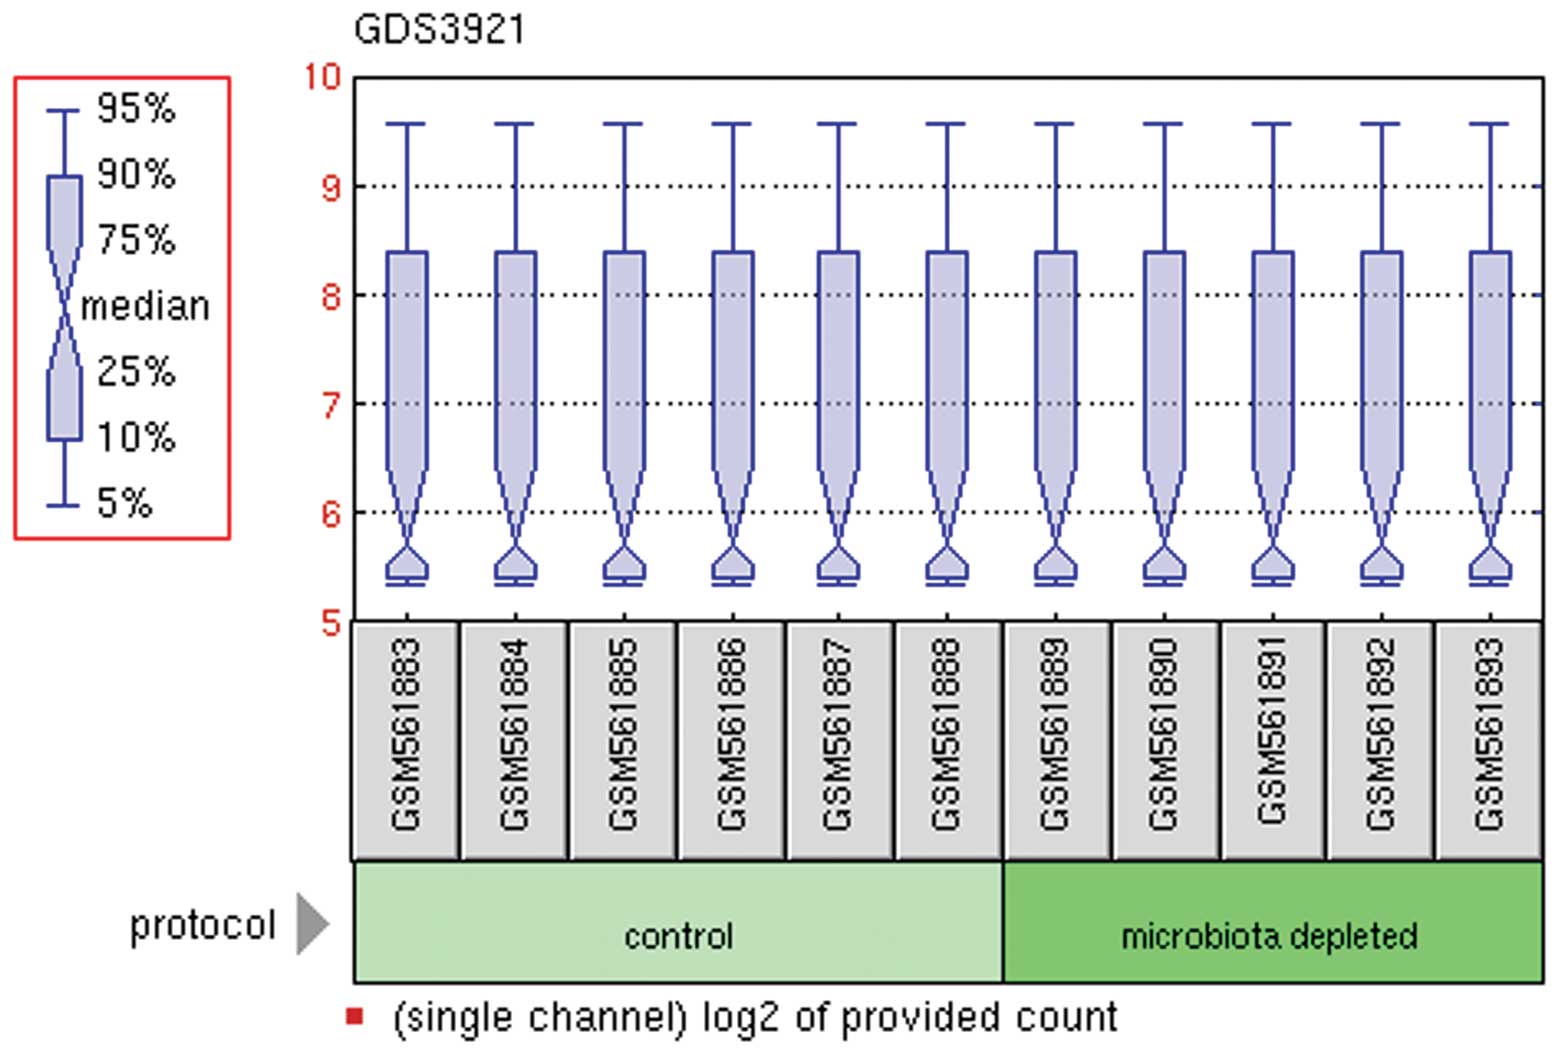
The normalized expression values following
preprocessing of the raw data are shown in Fig. 1. Differential expression analysis
on these values using FDR<0.05 and |log FC|>1 as cutoff
criteria identified a total of 53 genes differentially expressed
between depleted intestinal microbiota and control mice. Among
these DEGs, 26 were upregulated and 27 were downregulated upon
microbiota depletion.
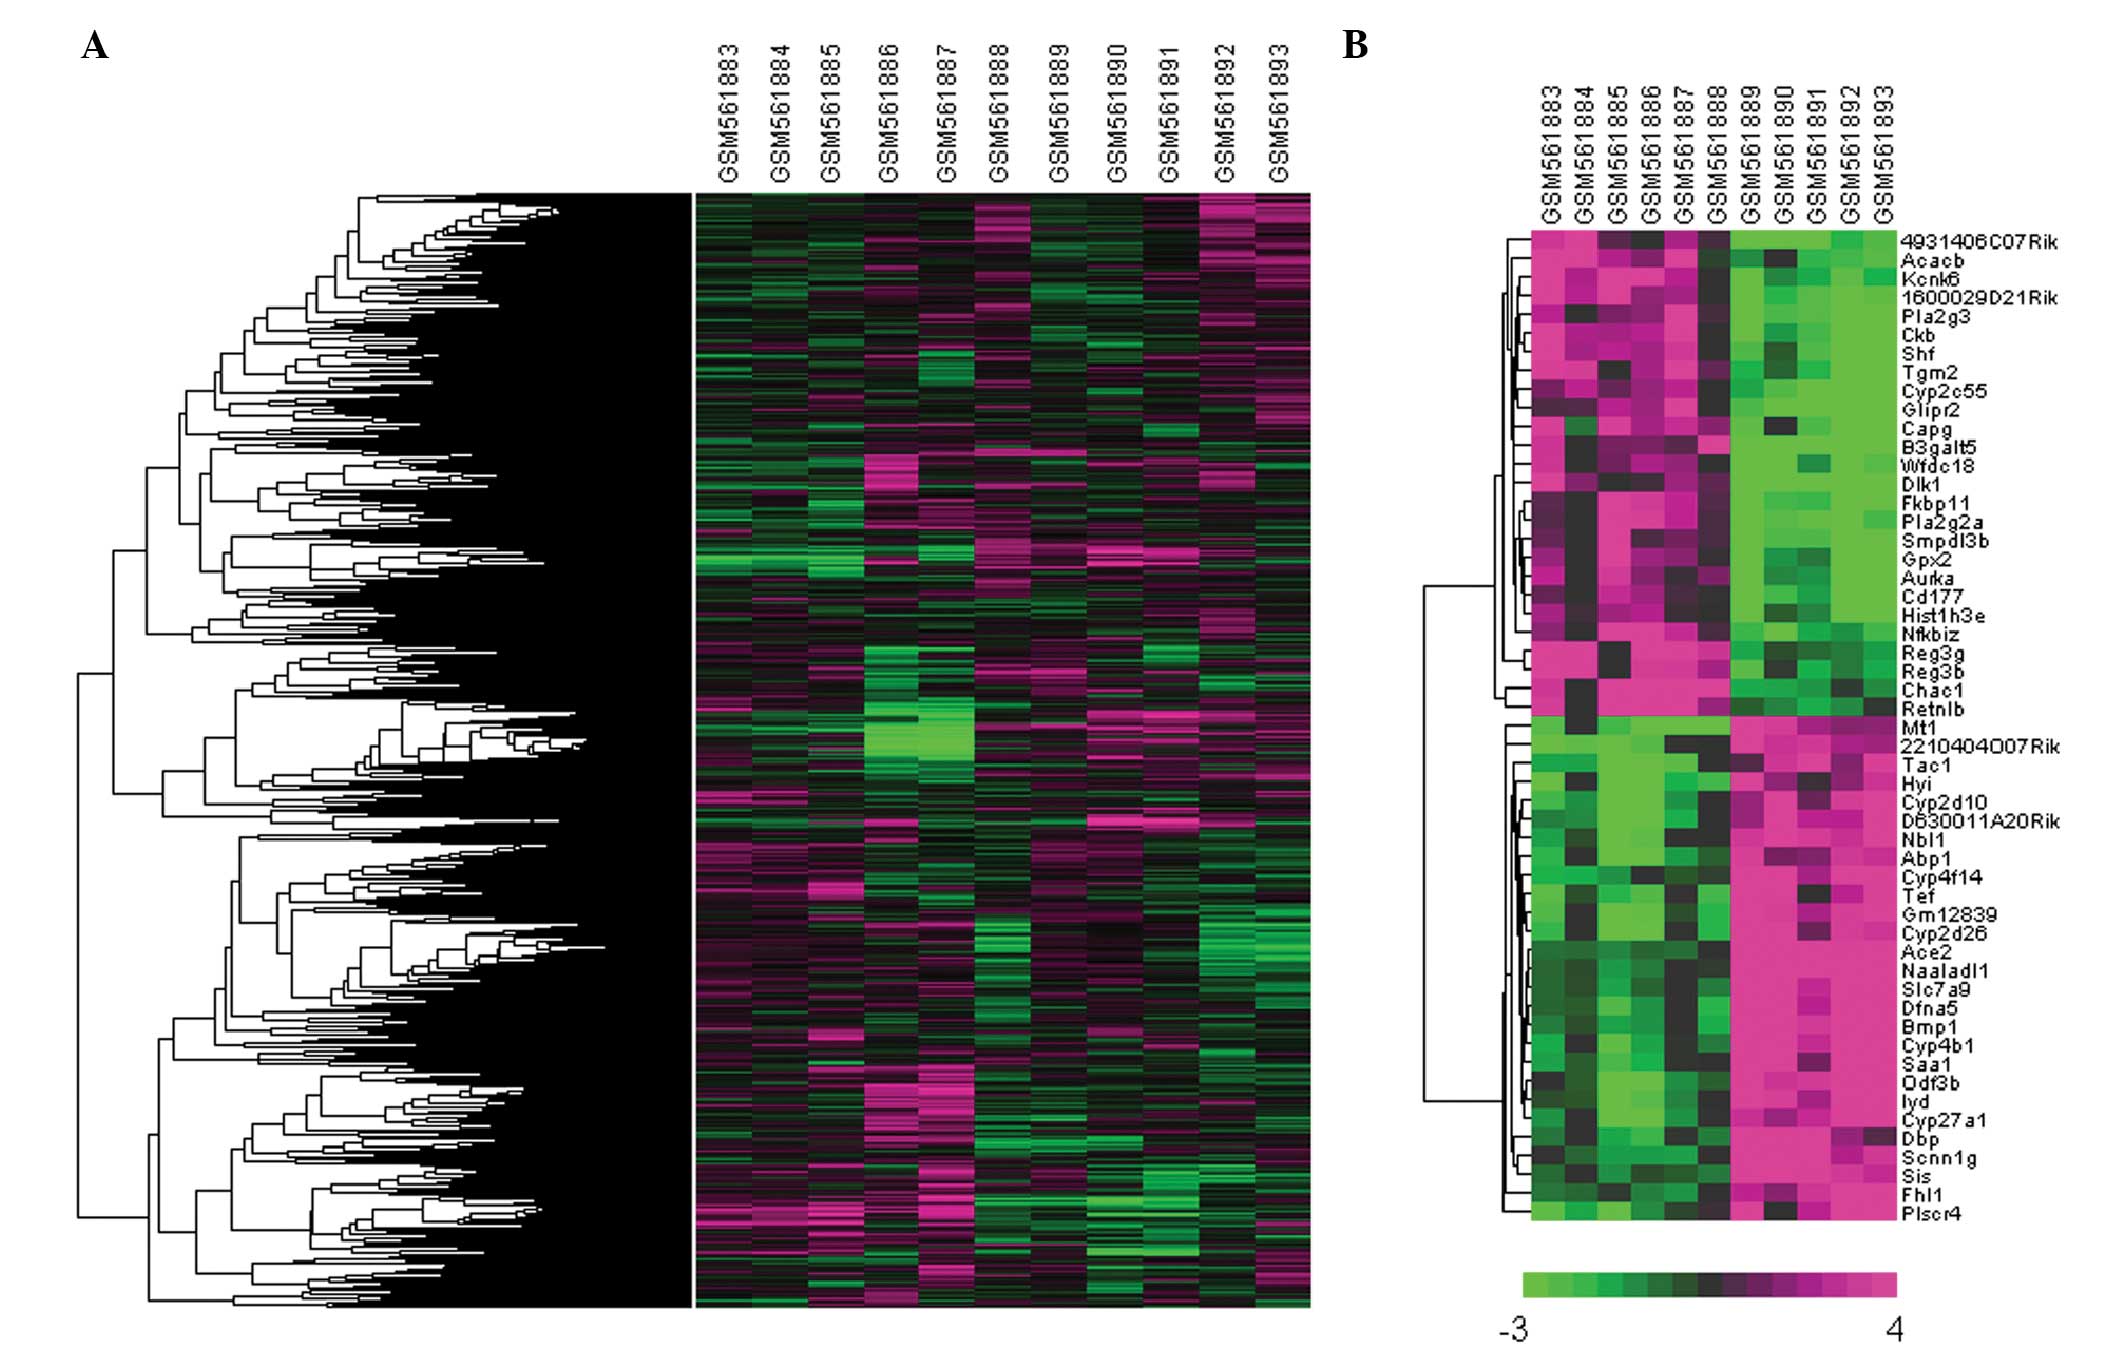
Clustering analysis of DEGs
Hierarchical clustering analysis was performed on
the expression values of all genes and of the 53 DEGs. Clearly
distinct expression patterns were observed between the
microbiota-depleted and the control mice in both the total gene and
DEG clustering analysis (Fig.
2).
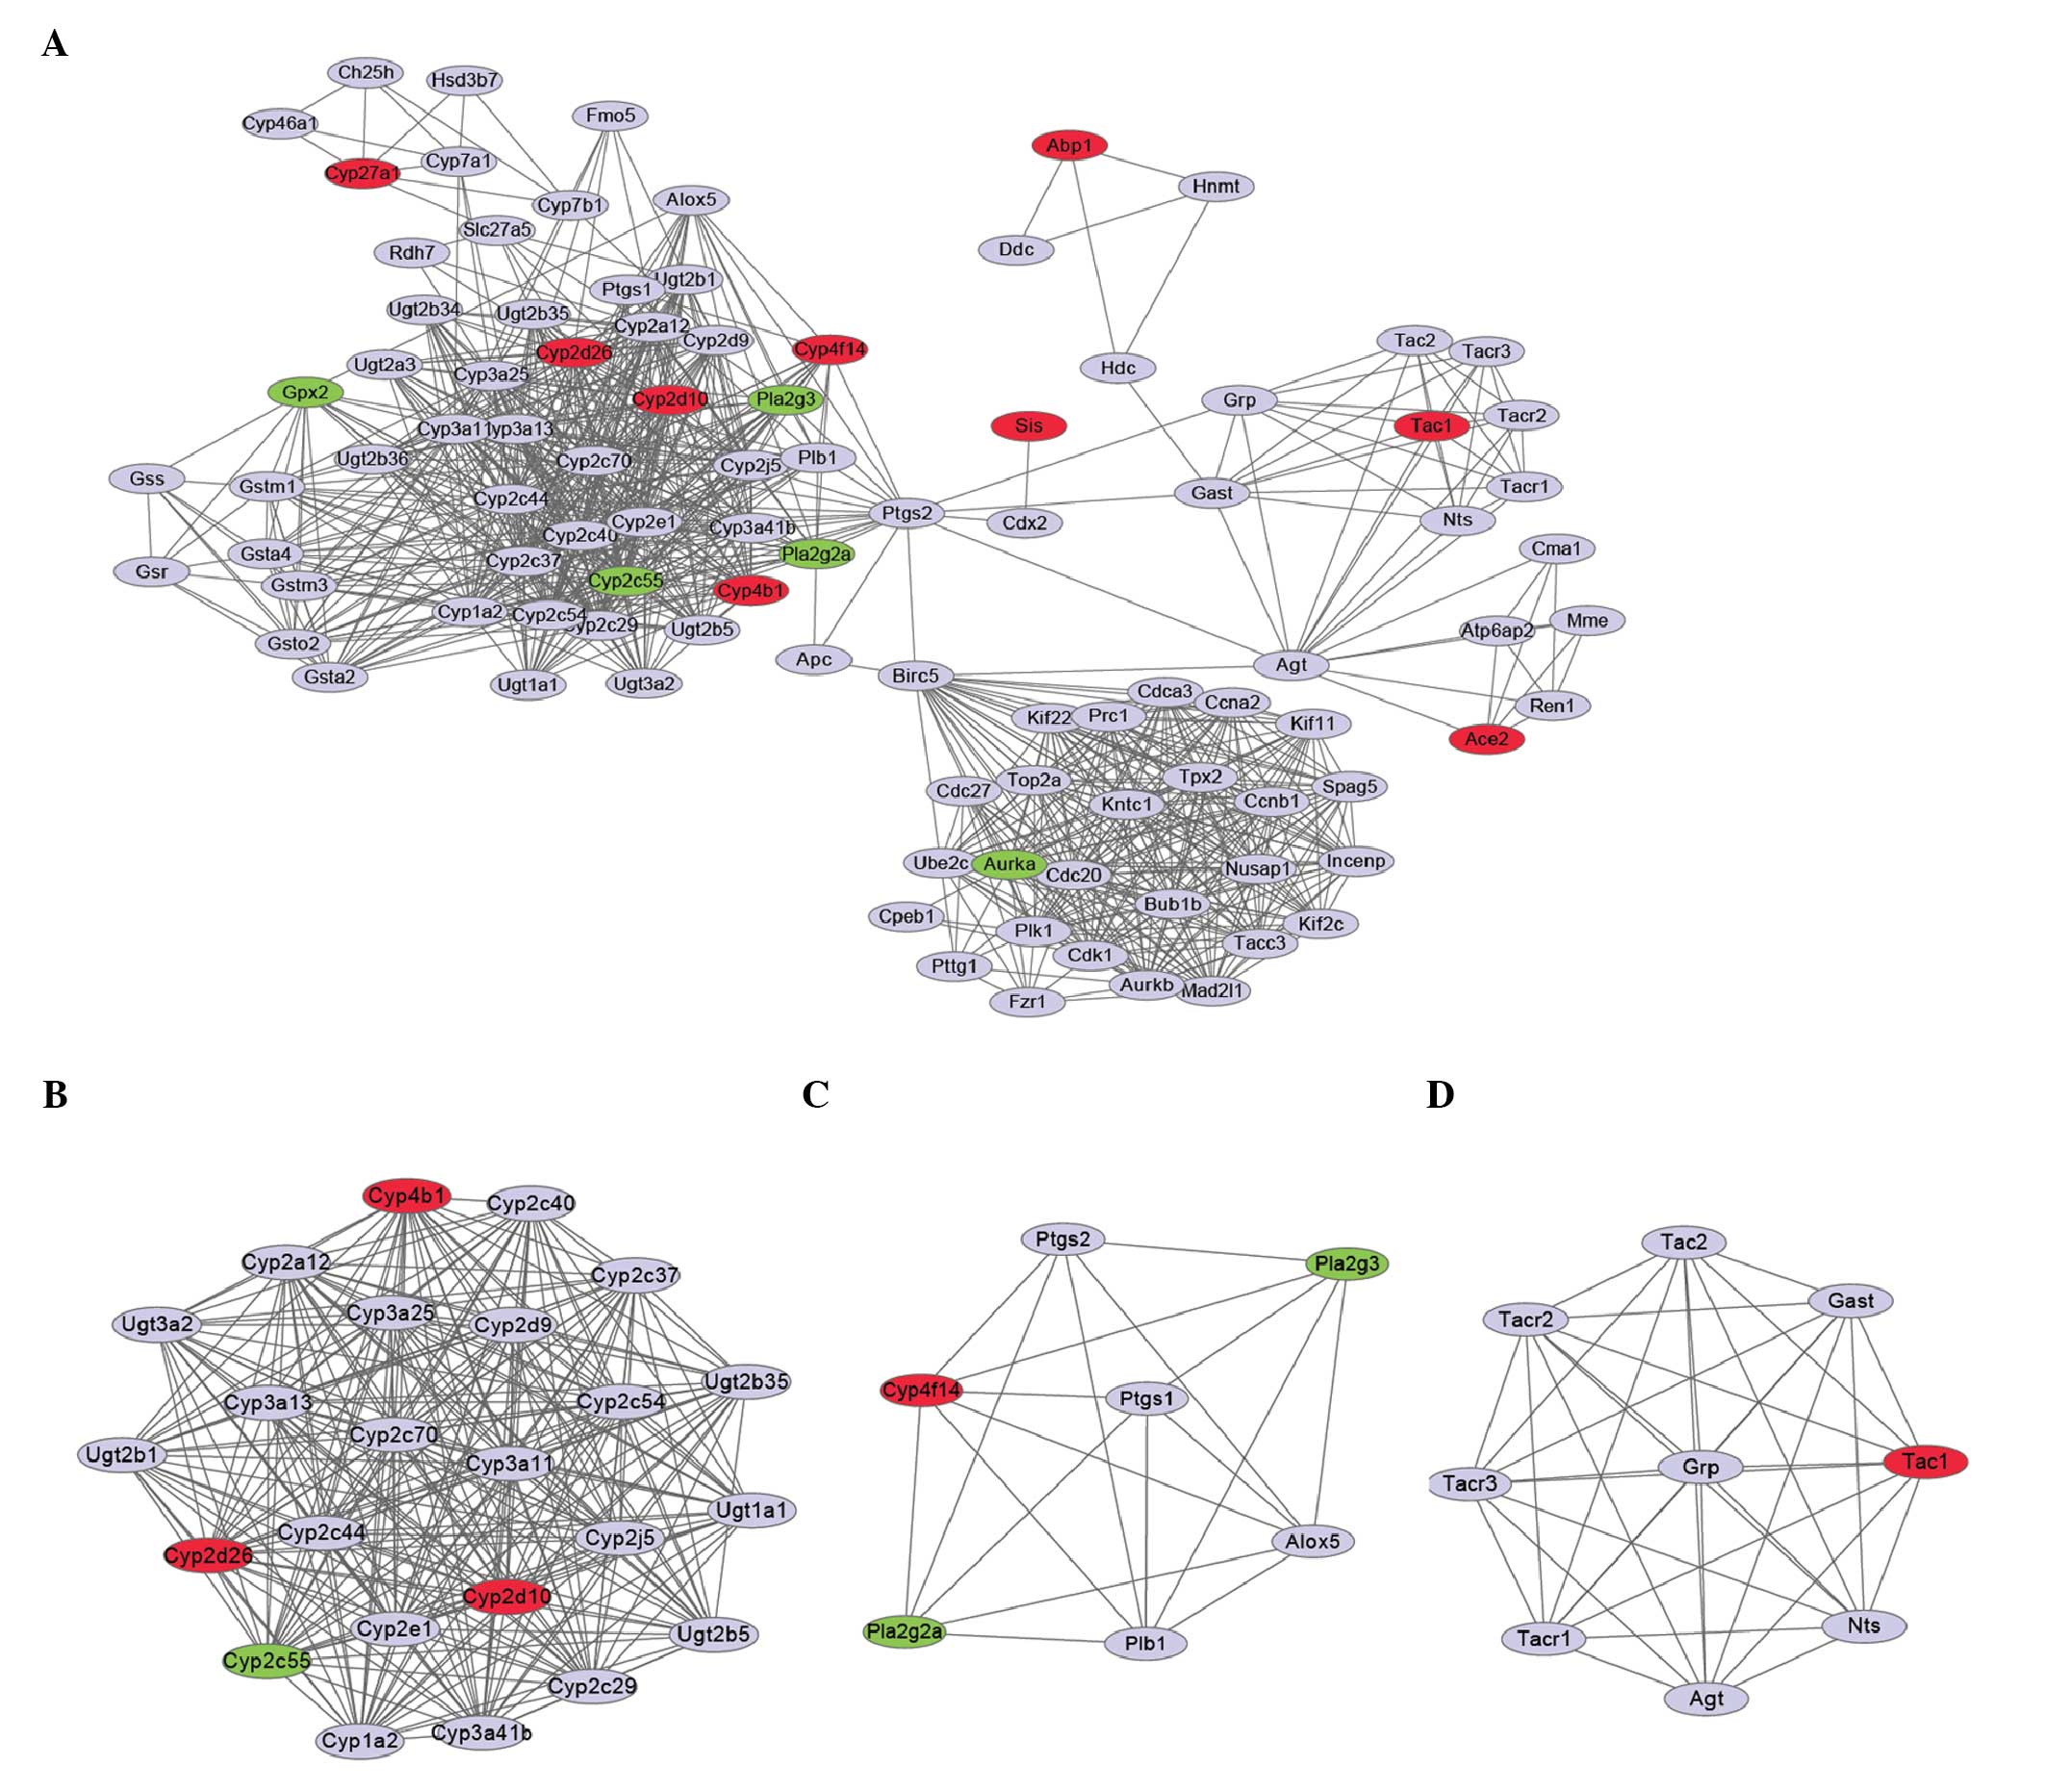
PPI analysis and module functional
annotation
The PPI network was constructed (Fig. 3A) based on the predicted
interactions of 14 DEGs showing a confidence score >0.8. Using
the MCODE plugin in Cytoscape, the PPI network was divided into
three modules (Fig. 3B–D). Modules
1, 2 and 3 were found to be significantly enriched (P<0.05) for
12, 14 and 14 Gene Ontology (GO) terms, respectively (Table I). The two most significant GO
terms in module 1 were oxidation reduction (P=1.9321E-21) and
metabolic process (P=1.1226E-12). The DEGs in module 1 (Fig. 3B), i.e., the cytochrome P450 (CYP)
4B1 isozyme gene (CYP4B1), CYP2D10 and
CYP2D26, which were upregulated (Table II), and CYP2C55, which was
downregulated, were all involved in these two processes (Table I). In addition, CYP4B1 was
found to be involved in all enriched GO term functions of module 1.
The terms unsaturated fatty acid, lipid, cellular lipid and fatty
acid metabolic process were the most significantly enriched
functions in module 2, and the upregulated gene CYP4F14
(Fig. 3C, Table II) was predicted to be involved in
all these functions (Table I).
Notably, the neuropeptide signaling pathway was the most
significantly enriched function (P=2.5213E-11) in module 3, and the
upregulated gene tachykinin precursor 1 (TAC1) (Fig. 3D, Table II) was predicted to be involved in
this function (Table I). The top 5
DEGs in terms of significance (Table
II) were all upregulated upon microbiota depletion.
 | Table IFunctional annotation of the genes in
the three modules using Gene Ontology (GO) terms. |
Table I
Functional annotation of the genes in
the three modules using Gene Ontology (GO) terms.
| A, Significantly
enriched GO terms (n=12) and associated DEGs in module 1 |
|---|
|
|---|
| GO id | Corr. P | Genes in test
set | Functional
description |
|---|
| 55114 | 1.9321E-21 | CYP2J5, CYP2C70,
CYP2D9, CYP2D10, CYP2C37, CYP2C55, CYP3A25, CYP2C54, CYP3A13,
CYP2C44, CYP3A11, CYP2C29, CYP2C40, CYP2E1, CYP1A2, CYP4B1,
CYP2D26 | Oxidation
reduction |
| 8152 | 1.1226E-12 | CYP2J5, CYP2C70,
CYP2D9, CYP2D10, CYP2C37, CYP2C55, CYP3A25, CYP2C54, CYP3A13,
CYP2C44, CYP3A11, CYP2C29, UGT2B1, CYP2C40, CYP2E1, CYP1A2, UGT1A1,
UGT3A2, CYP4B1, CYP2A12, UGT2B35, UGT2B5, CYP2D26 | Metabolic
process |
| 42537 | 9.6276E-10 | UGT2B1, CYP1A2,
UGT1A1, CYP4B1 | Benzene and
derivative metabolic process |
| 6805 | 2.6493E-08 | UGT2B1, CYP1A2,
UGT1A1, CYP4B1 | Xenobiotic metabolic
process |
| 71466 | 2.6493E-08 | UGT2B1, CYP1A2,
UGT1A1, CYP4B1 | Cellular response to
xenobiotic stimulus |
| 6725 | 2.6493E-08 | CYP2A12, UGT2B35,
UGT2B1, CYP1A2, UGT1A1, CYP4B1 | Cellular aromatic
compound metabolic process |
| 9410 | 3.7437E-08 | UGT2B1, CYP1A2,
UGT1A1, CYP4B1 | Response to
xenobiotic stimulus |
| 70887 | 4.26E-04 | UGT2B1, CYP1A2,
UGT1A1, CYP4B1 | Cellular response
to chemical stimulus |
| 44248 | 1.01E-03 | UGT2B35, UGT2B1,
CYP1A2, UGT1A1, CYP4B1 | Cellular catabolic
process |
| 9056 | 3.27E-03 | UGT2B35, UGT2B1,
CYP1A2, UGT1A1, CYP4B1 | Catabolic
process |
| 42221 | 7.25E-03 | UGT2B1, CYP2D26,
CYP1A2, UGT1A1, CYP4B1 | Response to
chemical stimulus |
| 51716 | 9.66E-03 | UGT2B1, CYP1A2,
UGT1A1, CYP4B1 | Cellular response
to stimulus |
|
| B, Significantly
enriched GO terms (n=14) and associated genes in module 2 |
|
| GO id | Corr. P | Genes in test
set | Functional
description |
|
| 33559 | 2.0285E-08 | PTGS2, PTGS1,
CYP4F14, ALOX5 | Unsaturated fatty
acid metabolic process |
| 6629 | 1.1496E-07 | PTGS2, PLB1,
PTGS1, PLA2G2A, CYP4F14, ALOX5 | Lipid metabolic
process |
| 44255 | 1.2555E-06 | PTGS2, PTGS1,
PLA2G2A, CYP4F14, ALOX5 | Cellular lipid
metabolic process |
| 6631 | 2.1203E-06 | PTGS2, PTGS1,
CYP4F14, ALOX5 | Fatty acid
metabolic process |
| 32787 | 9.1722E-06 | PTGS2, PTGS1,
CYP4F14, ALOX5 | Monocarboxylic acid
metabolic process |
| 43436 | 5.05E-05 | PTGS2, PTGS1,
CYP4F14, ALOX5 | Oxoacid metabolic
process |
| 19752 | 5.05E-05 | PTGS2, PTGS1,
CYP4F14, ALOX5 | Carboxylic acid
metabolic process |
| 6082 | 5.05E-05 | PTGS2, PTGS1,
CYP4F14, ALOX5 | Organic acid
metabolic process |
| 42180 | 5.26E-05 | PTGS2, PTGS1,
CYP4F14, ALOX5 | Cellular ketone
metabolic process |
| 55114 | 8.20E-05 | PTGS2, PTGS1,
CYP4F14, ALOX5 | Oxidation
reduction |
| 44281 | 1.02E-03 | PTGS2, PTGS1,
CYP4F14, ALOX5 | Small molecule
metabolic process |
| 44238 | 1.89E-03 | PTGS2, PLB1,
PTGS1, PLA2G2A, CYP4F14, ALOX5 | Primary metabolic
process |
| 8152 | 3.03E-03 | PTGS2, PLB1,
PTGS1, PLA2G2A, CYP4F14, ALOX5 | Metabolic
process |
| 44237 | 9.30E-03 | PTGS2, PTGS1,
PLA2G2A, CYP4F14, ALOX5 | Cellular metabolic
process |
|
| C, Significantly
enriched GO terms (n=14) and associated genes in module 3 |
|
| GO id | Corr. P | Genes in test
set | Functional
description |
|
| 7218 | 2.5213E-11 | GRP, TACR3,
TACR2, TACR1, TAC1, TAC2 | Neuropeptide
signaling pathway |
| 8015 | 1.8064E-10 | NTS, TACR3,
TACR1, AGT, TAC1, TAC2 | Blood
circulation |
| 3013 | 1.8064E-10 | NTS, TACR3,
TACR1, AGT, TAC1, TAC2 | Circulatory system
process |
| 7186 | 1.1712E-07 | GRP, TACR3,
TACR2, TACR1, AGT, TAC1, GAST, TAC2 | G-protein coupled
receptor protein signaling pathway |
| 7166 | 8.8661E-07 | GRP, TACR3,
TACR2, TACR1, AGT, TAC1, GAST, TAC2 | Cell surface
receptor linked signaling pathway |
| 23033 | 4.6021E-06 | GRP, TACR3,
TACR2, TACR1, AGT, TAC1, GAST, TAC2 | Signaling
pathway |
| 51239 | 4.8121E-06 | GRP, TACR3,
TACR2, TACR1, AGT, TAC1 | Regulation of
multicellular organismal process |
| 3008 | 4.9678E-06 | NTS, TACR3,
TACR2, TACR1, AGT, TAC1, TAC2 | System process |
| 65008 | 1.24E-05 | NTS, TACR3,
TACR1, AGT, TAC1, TAC2 | Regulation of
biological quality |
| 23052 | 1.33E-05 | GRP, TACR3,
TACR2, TACR1, AGT, TAC1, GAST, TAC2 | Signaling |
| 65007 | 4.55E-05 | GRP, NTS, TACR3,
TACR2, TACR1, AGT, TAC1, GAST, TAC2 | Biological
regulation |
| 32501 | 4.32E-04 | NTS, TACR3,
TACR2, TACR1, AGT, TAC1, TAC2 | Multicellular
organismal process |
| 50794 | 2.08E-03 | GRP, TACR3,
TACR2, TACR1, AGT, TAC1, GAST | Regulation of
cellular process |
| 50789 | 2.69E-03 | GRP, TACR3,
TACR2, TACR1, AGT, TAC1, GAST | Regulation of
biological process |
| Table IICharacteristics of the most
significant differentially expressed genes in the 3 modules. |
Table II
Characteristics of the most
significant differentially expressed genes in the 3 modules.
| Id | Gene symbol | FDR | |log FC| | GO termsa | Regulation |
|---|
| ILMN_2790496 | CYP4B1 | 0.0023580 | 2.64 | All in Table IA | Up |
| ILMN_1229535 | CYP2D10 | 0.0234023 | 1.42 | 55114, 8152 | Up |
| ILMN_2704777 | CYP2D26 | 0.0190232 | 1.92 | 55114, 8152,
42221 | Up |
| ILMN_1231625 | CYP4F14 | 0.0055720 | 1.31 | All in Table IB | Up |
| ILMN_1251000 | TAC1 | 0.0257095 | 1.09 | All in Table IC | Up |
Pathway analysis
Pathway enrichment analysis using the GenMAPP
software was performed on the list of DEGs the products of which
are parts of the three PPI modules. Module 1 was found to be
significantly enriched for a total of 12 pathways, module 2 for 5
and module 3 for 2 (Table III).
The most significant pathways in module 1 included metabolism of
xenobiotics by P450s (P=2.20E-26), linoleic acid metabolism
(P=6.54E-24) and arachidonic acid metabolism (P=1.49E-10).
Significant pathways in module 2 also included arachidonic acid
metabolism (P=5.61E-10) and linoleic acid metabolism (P=3.95E-02).
Two pathways were significantly enriched in module 3, the calcium
signaling pathway (P=3.23E-03) and neuroactive ligand-receptor
interaction (P=5.95E-03).
| Table IIIPathway enrichment analysis of
differentially expressed genes in the three modules based on
information from the Kyoto Encyclopedia of Genes and Genomes (KEGG)
pathways database for Mus musculus (mmu). |
Table III
Pathway enrichment analysis of
differentially expressed genes in the three modules based on
information from the Kyoto Encyclopedia of Genes and Genomes (KEGG)
pathways database for Mus musculus (mmu).
| Module | KEGG id | P |
|---|
| 1 | mmu00980:
Metabolism of xenobiotics by cytochrome P450 | 2.20E-26 |
| mmu00830: Retinol
metabolism | 3.63E-26 |
| mmu00591: Linoleic
acid metabolism | 6.54E-24 |
| mmu00983: Drug
metabolism | 1.30E-10 |
| mmu00590:
Arachidonic acid metabolism | 1.49E-10 |
| mmu00140: Steroid
hormone biosynthesis | 5.88E-09 |
| mmu00053: Ascorbate
and aldarate metabolism | 1.18E-03 |
| mmu00040: Pentose
and glucuronate interconversions | 1.52E-03 |
| mmu00860: Porphyrin
and chlorophyll metabolism | 4.74E-03 |
| mmu00150: Androgen
and estrogen metabolism | 4.74E-03 |
| mmu00500: Starch
and sucrose metabolism | 6.77E-03 |
| mmu00232: Caffeine
metabolism | 3.10E-02 |
| 2 | mmu00590:
Arachidonic acid metabolism | 5.61E-10 |
| mmu04370: Vascular
endothelial growth factor signaling pathway | 1.69E-03 |
| mmu00592:
α-linolenic acid metabolism | 1.56E-02 |
| mmu00565: Ether
lipid metabolism | 3.01E-02 |
| mmu00591: Linoleic
acid metabolism | 3.95E-02 |
| 3 | mmu04020: Calcium
signaling pathway | 3.23E-03 |
| mmu04080:
Neuroactive ligand-receptor interaction | 5.95E-03 |
Discussion
The collective genome of the human intestinal
microbiota was estimated to contain 3.3 million microbial genes,
which is ~150 times more genes than the human genome. Intestinal
microbiota mostly use fermentation to generate energy, converting
sugars, in part, to short-chain fatty acids, which are used by the
host as an energy source (1). To
understand the impact of intestinal microbiota on human health, it
is crucial to assess their potential function. The present study
identified a total of 53 DEGs, comprising 26 upregulated and 27
downregulated genes upon depletion of the intestinal microbiota in
mice. Important differences in gene expression were observed
between intestinal microbiota-depleted and control mice in
hierarchical clustering analysis. The PPI network of DEGs was
constructed and divided into 3 modules, with the most significant
module-related DEGs being CYP4B1 in module 1, CYP4F14
in module 2 and TAC1 in module 3. The majority of enriched
pathways of module 1 and 2 were oxidation reduction (metabolism of
xenobiotics by CYPs) and lipid (e.g., linoleic and arachidonic
acid) metabolism pathways. In addition, the neuropeptide signaling
pathway was the most significantly enriched pathway in module
3.
Two types of functions of intestinal microbiota have
been identified in a previous study, those required in all bacteria
and those potentially specific to the gut (1). Functions of the first category relate
to central metabolic pathways (for example, carbon metabolism and
amino acid synthesis) and to important protein complexes (RNA and
DNA polymerase, ATP synthase, general secretory apparatus)
(1). The putative gut-specific
functions include those involved in adhesion to host proteins
(collagen, fibrinogen, fibronectin), or in harvesting sugars of the
globo-series glycolipids, which are carried on blood and epithelial
cells (1). In the present study,
most of module 1-related DEGs were involved in oxidation reduction
and metabolic processes such as metabolism of xenobiotics by CYPs,
and the majority of module 2-related DEGs were involved in lipid
metabolic processes, such as lipid metabolic process and
arachidonic acid metabolism. These results suggest that the
intestinal microbiota is involved in numerous metabolic and
biosynthetic processes, but has particularly important roles in the
regulation of lipid biosynthesis and in oxidation-reduction
processes, as also indicated by previous studies (22–24).
Further analysis of the most significant DEGs
CYP4B1, CYP2D10, CYP2D26 (module 1) and
CYP4F14 (module 2) revealed that CYP4B1 and
CYP4F14 are involved in almost all of the functions of each
PPI module. In rats and rabbits, the CYP4B1 protein was shown to
play an important role in mutagenic activation of procarcinogens in
the organs (25). Most of organic
xenobiotics require metabolic activation to electrophilic
intermediates to produce adverse carcinogenic effects. Specific
enzymes of the CYP superfamily are involved in the formation of
reactive metabolites from certain substrates that are predicted or
known occupational and environmental carcinogens (26). A new prodrug-activating enzyme
system for pharmacogenic therapy of experimental brain tumors based
on the rabbit CYP4B1 protein was previously described (27). CYP4Fs are a subfamily of enzymes
involved in arachidonic acid metabolism and showing the highest
catalytic activity towards leukotriene (LT)B4, a potent
chemoattractant involved in inflammation. CYP4F-mediated metabolism
of LTB4 leads to inactive ω-hydroxy products, incapable of
initiating chemotaxis and the inflammatory stimuli that result in
the influx of inflammatory cells (28). The CYP4B1 and CYP4F14
genes were identified as significantly upregulated in the present
study, which, in combination with previous reports, suggests that
intestinal microbiota depletion may lead to inflammation and cancer
in the body.
It is notable that modules 1 and 2 were both
enriched for the processes of arachidonic and linoleic acid
metabolism. Arachidonic acid is a polyunsaturated ω-6 fatty acid
that is released in response to tissue injury. Arachidonic acid is
a pivotal signaling molecule, involved in the initiation and
propagation of diverse signaling cascades regulating inflammation,
pain and homeostatic functions (29). It is metabolized by three enzymatic
pathways: the cyclooxygenase pathway produces prostanoid, the
lipoxygenase pathway yields monohydroxy compounds and LTs, while
the CYP epoxygenase pathway generates hydroxy and epoxyeicosanoids.
There is increasing evidence that some of these metabolic products
play critical roles in cardiovascular disease (29). Linoleic acid is predominant in
dairy products and plant oils such as flax seed, and animal studies
have reported a reduction in intra-abdominal fat and an enhanced
gain in fat-free mass upon linoleic acid supplementation; another
study reported linoleic acid-mediated whole-body fat loss in
overweight men and women; there have also been some concerns that
linoleic acid can promote oxidative stress and induce hepatic lipid
accumulation (30–32). Based on these studies and the
present findings on arachidonic and linoleic acid metabolism, the
two processes appear to play a key role in human health and to be
closely linked to the balance of intestinal microbiota.
In contrast to the reported effects of intestinal
microbiota on oxidation reduction and lipid metabolism (30–32),
an association between intestinal microbiota and the neuropeptide
signaling pathway has not been previously reported. In our study,
it is notable that the neuropeptide signaling pathway was the most
significantly enriched pathway in module 3. Among the
here-identified DEGs, TAC1 is predicted to be involved in
this pathway. This gene encodes a neurotransmitter of the central
and peripheral nervous system (33), and the protein has additionally
been associated with immunologic and inflammatory processes
(34). The gut and the brain are
closely connected organs, and their interaction plays an important
role not only in gastrointestinal function, but also in certain
feeling states and in intuitive decision making (35); alterations in this interaction have
been associated with a wide range of disorders, including
functional, inflammatory gastrointestinal, and eating disorders. It
has been reported that healthy humans and rats produce
autoantibodies directed against appetite-regulating peptide
hormones and neuropeptides, suggesting that these autoantibodies
may play physiological roles in hunger- and satiety-related
pathways (36). Gut-related
antigens including those produced by the intestinal microflora, may
affect the production of these autoantibodies, which might
represent a new link between the gut and the regulation of
appetite. We thus argue that the depletion of the intestinal
microflora in mice may lead to impaired neuropeptide signaling.
In conclusion, our findings strongly suggest that
intestinal microbiota depletion affects metabolism, oxidation
reduction and neuropeptide signaling pathways in mice, involving a
number of genes and interactions. Numerous diseases, as well as
aging, can be induced by depletion of the intestinal microflora,
and therefore, the dynamic equilibrium of the intestinal microflora
plays a key role in human health. The neuropeptide signaling
pathway was first reported in the present study to be affected by
the depletion of the intestinal microflora, a result which reveals
a potential link between the intestinal bacteria and the nervous
system. However, further experimentation and additional studies are
needed to confirm this link; such studies are expected to enhance
our understanding of the interactions between the bacteria of the
intestinal microflora and their host environment.
References
|
1
|
Qin J, Li R, Raes J, et al: A human gut
microbial gene catalogue established by metagenomic sequencing.
Nature. 464:59–65. 2010. View Article : Google Scholar : PubMed/NCBI
|
|
2
|
Tremaroli V and Backhed F: Functional
interactions between the gut microbiota and host metabolism.
Nature. 489:242–249. 2012. View Article : Google Scholar : PubMed/NCBI
|
|
3
|
Gerritsen J, Smidt H, Rijkers GT and de
Vos WM: Intestinal microbiota in human health and disease: the
impact of probiotics. Genes Nutr. 6:209–240. 2011. View Article : Google Scholar : PubMed/NCBI
|
|
4
|
Jernberg C, Lofmark S, Edlund C and
Jansson JK: Long-term impacts of antibiotic exposure on the human
intestinal microbiota. Microbiology. 156:3216–3223. 2010.
View Article : Google Scholar : PubMed/NCBI
|
|
5
|
Arroyo G, Penas E, Pedrazuela A and
Prestamo G: Intestinal microbiota in rats fed with tofu (soy curd)
treated under high pressure. Eur Food Res Technol. 220:395–400.
2005. View Article : Google Scholar
|
|
6
|
Bjorksten B, Sepp E, Julge K, Voor T and
Mikelsaar M: Allergy development and the intestinal microflora
during the first year of life. J Allergy Clin Immunol. 108:516–520.
2001.PubMed/NCBI
|
|
7
|
Ohigashi S, Sudo K, Kobayashi D, et al:
Changes of the intestinal microbiota, short chain fatty acids, and
fecal pH in patients with colorectal cancer. Dig Dis Sci.
58:1717–1726. 2013. View Article : Google Scholar : PubMed/NCBI
|
|
8
|
Rawls JF: Enteric infection and
inflammation alter gut microbial ecology. Cell Host Microbe.
16:73–74. 2007. View Article : Google Scholar : PubMed/NCBI
|
|
9
|
Human Microbiome Jumpstart Reference
Strains Consortium. Nelson KE, Weinstock GM, Highlander SK, et al:
A catalog of reference genomes from the human microbiome. Science.
328:994–999. 2010. View Article : Google Scholar : PubMed/NCBI
|
|
10
|
Reikvam DH, Erofeev A, Sandvik A, et al:
Depletion of murine intestinal microbiota: effects on gut mucosa
and epithelial gene expression. PLoS One. 6:e179962011. View Article : Google Scholar : PubMed/NCBI
|
|
11
|
Irizarry R, Gautier L and Cope L: An R
package for analyses of Affymetrix oligonucleotide arrays. The
Analysis of Gene Expression Data: Methods and Software. Parmigiani
G, Garrett ES, Irizarry RA and Zeger SL: Springer-Verlag; Berlin:
pp. 102–119. 2003, View Article : Google Scholar
|
|
12
|
Smyth GK: limma: linear models for
microarray data. Bioinformatics and Computational Biology Solutions
Using R and Bioconductor. Gentleman R, Carey VJ, Huber W, Irizarry
RA and Dudoit S: Springer; New York, NY: pp. 397–420. 2005,
View Article : Google Scholar
|
|
13
|
Shao X, Huang B, Lee JM, Xu F and Espejo
A: Bayesian method for multirate data synthesis and model
calibration. AIChE J. 57:1514–1525. 2011. View Article : Google Scholar
|
|
14
|
Hur AB, Elisseeff A and Guyon I:
Identification of co-regulation patterns by unsupervised cluster
analysis of gene expression data. US Patent 8,489,531. Filed
February 2, 2011; issued July 16, 2013.
|
|
15
|
Szklarczyk D, Franceschini A, Kuhn M, et
al: The STRING database in 2011: functional interaction networks of
proteins, globally integrated and scored. Nucleic Acids Res.
39:D561–D568. 2011. View Article : Google Scholar : PubMed/NCBI
|
|
16
|
Shannon P, Markiel A, Ozier O, et al:
Cytoscape: a software environment for integrated models of
biomolecular interaction networks. Genome Res. 13:2498–2504. 2003.
View Article : Google Scholar : PubMed/NCBI
|
|
17
|
Bader GD and Hogue CW: An automated method
for finding molecular complexes in large protein interaction
networks. BMC Bioinformatics. 4:22003. View Article : Google Scholar : PubMed/NCBI
|
|
18
|
Smoot M, Ono K, Ideker T and Maere S:
PiNGO: a Cytoscape plugin to find candidate genes in biological
networks. Bioinformatics. 27:1030–1031. 2011. View Article : Google Scholar : PubMed/NCBI
|
|
19
|
Kanehisa M and Goto S: KEGG: kyoto
encyclopedia of genes and genomes. Nucleic Acids Res. 28:27–30.
2000. View Article : Google Scholar : PubMed/NCBI
|
|
20
|
Xue J, Zhao C and Liang A: Pathway
analysis of the differential expression genes of oligonucleotide
microarray of airway allergic diseases using GenMAPP. Lin Chung Er
Bi Yan Hou Tou Jing Wai Ke Za Zhi. 25:371–373. 2011.(In
Chinese).
|
|
21
|
Dahlquist KD, Salomonis N, Vranizan K,
Lawlor SC and Conklin BR: GenMAPP, a new tool for viewing and
analyzing microarray data on biological pathways. Nat Genet.
31:19–20. 2002. View Article : Google Scholar : PubMed/NCBI
|
|
22
|
Velagapudi VR, Hezaveh R, Reigstad CS, et
al: The gut microbiota modulates host energy and lipid metabolism
in mice. J Lipid Res. 51:1101–1112. 2010. View Article : Google Scholar : PubMed/NCBI
|
|
23
|
Bäckhed F: Programming of host metabolism
by the gut microbiota. Ann Nutr Metab. 58:44–52. 2011.
|
|
24
|
Espey MG: Role of oxygen gradients in
shaping redox relationships between the human intestine and its
microbiota. Free Radic Biol Med. 55:130–140. 2013. View Article : Google Scholar : PubMed/NCBI
|
|
25
|
Tamaki Y, Arai T, Sugimura H, et al:
Association between cancer risk and drug-metabolizing enzyme gene
(CYP2A6, CYP2A13, CYP4B1, SULT1A1, GSTM1, and GSTT1) polymorphisms
in cases of lung cancer in Japan. Drug Metab Pharmacokinet.
26:516–522. 2011. View Article : Google Scholar : PubMed/NCBI
|
|
26
|
Roos PH, Belik R, Follmann W, et al:
Expression of cytochrome P450 enzymes CYP1A1, CYP1B1, CYP2E1 and
CYP4B1 in cultured transitional cells from specimens of the human
urinary tract and from urinary sediments. Arch Toxicol. 80:45–52.
2006. View Article : Google Scholar : PubMed/NCBI
|
|
27
|
Jang SJ, Kang JH, Lee TS, et al:
Prodrug-activating gene therapy with rabbit cytochrome P450
4B1/4-ipomeanol or 2-aminoanthracene system in glioma cells. Nucl
Med Mol Imaging. 44:193–198. 2010. View Article : Google Scholar : PubMed/NCBI
|
|
28
|
Antonovic L: A physiological role of
cytochromes P450 4Fs: mouse model (unpublished dissertation). The
University of Texas. AAI3218710. 2006
|
|
29
|
Li N, Liu JY, Qiu H, et al: Use of
metabolomic profiling in the study of arachidonic acid metabolism
in cardiovascular disease. Congest Heart Fail. 17:42–46. 2011.
View Article : Google Scholar : PubMed/NCBI
|
|
30
|
Gaullier JM, Halse J, Hoye K, et al:
Supplementation with conjugated linoleic acid for 24 months is well
tolerated by and reduces body fat mass in healthy, overweight
humans. J Nutr. 135:778–784. 2005.PubMed/NCBI
|
|
31
|
Gaullier JM, Halse J, Hoye K, et al:
Conjugated linoleic acid supplementation for 1 y reduces body fat
mass in healthy overweight humans. Am J Clin Nutr. 79:1118–1125.
2004.PubMed/NCBI
|
|
32
|
Kreider RB, Ferreira MP, Greenwood M,
Wilson M and Almada AL: Effects of conjugated linoleic acid
supplementation during resistance training on body composition,
bone density, strength, and selected hematological markers. J
Strength Cond Res. 16:325–334. 2002.PubMed/NCBI
|
|
33
|
Graham GJ, Stevens JM, Page NM, et al:
Tachykinins regulate the function of platelets. Blood.
104:1058–1065. 2004. View Article : Google Scholar : PubMed/NCBI
|
|
34
|
Brain SD: Sensory neuropeptides: their
role in inflammation and wound healing. Immunopharmacology.
37:133–152. 1997. View Article : Google Scholar : PubMed/NCBI
|
|
35
|
Mayer EA: Gut feelings: the emerging
biology of gut-brain communication. Nat Rev Neurosci. 12:453–466.
2011. View
Article : Google Scholar : PubMed/NCBI
|
|
36
|
Vijay-Kumar M, Aitken JD, Carvalho FA, et
al: Metabolic syndrome and altered gut microbiota in mice lacking
Toll-like receptor 5. Science. 328:228–231. 2010. View Article : Google Scholar : PubMed/NCBI
|