Introduction
Leptin, an adipocytokine, is a 16-kDa plasma protein
primarily secreted by adipocytes (1,2). It
is also produced by oesteoblasts, placental syncytiotrophoblasts
and gastric epithelium (3–6). A previous study demonstrated that
leptin contributes to body weight homeostasis as a signal to affect
food intake and energy expenditure (7). In addition to its physiological
actions on lipid metabolism, angiogenesis, fertility and
hematopoiesis, leptin has a pathological role in certain bone
diseases, including osteoporosis, osteoarthritis, rheumatic
arthritis, bone tumors and fractures (8–11).
It is well known that leptin is an important
regulator of bone metabolism through peripheral and central
signaling pathways. It has been suggested that the peripheral
pathway is direct and involved in a stimulatory effect on bone
formation, whereas the central pathway is indirect and exerts an
inhibitory effect on bone growth, which is supported by
observations of bone loss resulting from the intracerebrovesicular
administration of leptin (12). By
contrast, a previous study showed that the intracerebrovesicular
injection of leptin enhances bone formation (13). Osteoblasts are major cells in the
bone, and are responsible for mineralization during bone formation
and later bone remodeling. As such, osteoblasts are critical in
normal skeletal physiology and are involved in several pathological
conditions, including osteoporosis, osteopetrosis and bone cancer
(14). It has been shown that
leptin can affect bone formation by mediating the activity of
osteoblasts (15). However, the
mechanisms underlying the effect of leptin on osteoblasts remain to
be fully elucidated.
Caveolin-1 is an essential and signature protein of
caveolae, and is found to be expressed at high levels in
osteoblasts and endothelial cells (16). The removal of caveolin-1 has been
demonstrated to prevent the formation of caveolae in these cells
(16). Numerous studies have shown
the importance of caveolae in vesicular trafficking, cell adhesion,
apoptosis and senescence (17,18).
Although the predominant focus of interest has been centered on the
role of caveolin-1 in cancer, there is substantial data providing
evidence that it is also involved in bone metabolism (19,20).
It has also been demonstrated that caveolin-1 appears to be a key
regulator of osteoblast differentiation and function, including
mineralization and matrix protein deposition (16).
In the present study, it was confirmed that leptin
promoted the proliferation of osteoblasts in vitro, and
demonstrated for the first time, to the best of our knowledge, that
caveolin-1 critically contributed to the proliferative effect of
leptin on osteoblasts, and this was mediated by the activation of
Akt The results may aid in the development of therapeutics for
leptin-induced bone diseases.
Materials and methods
Cell culture and reagents
An osteoblastic cell line derived from the bone of
human fetal osteoblasts (hFOB 1.19), was purchased from American
Type Culture Collection (Manassas, VA, USA). In culture conditions
of 37°C with 5% CO2, the cells were grown in Dulbecco's
modified Eagle's medium (DMEM; Sigma-Aldrich, St. Louis, MO, USA)
at pH 7.4, supplemented with 3.7 g/l NaHCO3, 4.77 g/l
HEPES, 10% fetal bovine serum (FBS; Invitrogen; Thermo Fisher
Scientific, Waltham, MA, USA) and 0.5% penicillin/streptomycin (50
U/ml penicillin and 50 µg/ml streptomycin; Sigma-Aldrich).
Every 2–3 days, the medium was replaced. When the cell culture
reached ~85% confluence, subculture was performed. Cells at the
third or fourth passage were used in the subsequent
experiments.
Cell proliferation assay
Using an MTT assay, cell viability was evaluated.
The cells were seeded in 96-well plates at a density of
3×10³ cells per well. Following incubation overnight,
the cells were exposed to leptin (Sigma-Aldrich); for 24–96 h
Following incubation overnight, the cells were exposed to different
concentration of leptin (0, 0.01, 0.05, 0.1, 0.5, 1, 5 and 10
µg/ml) for 24 h or the cells were exposed to 0.5
µg/ml leptin for 24–96 h. Fresh complete medium (0.2 ml)
supplemented with 20 µl MTT dye [(5 mg/ml in
phosphate-buffered saline (PBS)] was added to each well. Following
incubation at 37°C for 4 h, each well was washed thoroughly with
PBS. Subsequently, dimethyl sulfoxide (Sigma-Aldrich) was added to
each well to terminate the MTT reaction and dissolve the formazan
crystals. Following agitation at room temperature for ~10 min, the
optical density (OD) of each well was measured at 450 nm. The
viability of the control cells were considered as 100%, and the
results were calculated as follows: (ODtreated cells −
ODcontrol cells) / (ODcontrol cells −
ODblank) × 100%.
Analysis of cell apoptosis
In 6-well plates, 2×10⁵ cells/well were
seeded and cultured overnight. Following treatment with 0.5
µg/ml leptin for 24 h, the cells were trypsinized and washed
with PBS. The cells were suspended in 0.3 ml binding buffer,
following by the addition of 2 µl Annexin V (Beyotime
Institute of Biotechnology, Haimen, China) and careful pipetting of
the mixture. Following the addition of 5 µl propidium iodide
(PI; Beyotime Institute of Biotechnology), the mixture was
incubated for ~10 min at room temperature. The rates of apoptosis
were detected using a FACSCSalibur flow cytometer
(Becton-Dickinson; BD Biosciences, San Diego, CA, USA).
Cell cycle analysis
In 6-well plates, 2×10⁵ cells were seeded
per well. Following 12 h starvation, the cells were treated with
0.5 µg/ml leptin for 24 h for 48 h. Following trypsinization
and washing with PBS, the cells were resuspended with 500 µl
medium containing 1 mg/ml RNase A and 100 µg/ml PI (Beyotime
Institute of Biotechnology). Following incubation for 20 min at
room temperature, in the dark, the DNA contents of the cells were
measured using a FACSCalibur flow cytometer (Becton-Dickinson; BD
Biosciences).
Small interfering (si)RNA knockdown
siRNA was used to knock down the gene expression of
caveolin-1. A total of 5×10⁴ cells/well were seeded in
24-well tissue culture plates. Following incubation for 24 h at
37°C, the medium was replaced. Using 6 µl transfection
reagent (Qiagen), transfections were performed using siRNA (Santa
Cruz Biotechnology, Inc., Dallas, TX, USA) at a final concentration
of 30 nM. Based on the half-life of 5 h for caveolin-1 protein
(21), the cells in the wells were
exposed to the transfection mixture for 24 h at 37°C prior to cell
harvest.
Reverse transcription-quantitative
polymerase chain reaction (RT-qPCR)
Using TRIzol reagent (Takara Bio, Inc., Otsu,
Japan), total RNA was extracted from the cells. A 200 ng quantity
of total RNA was used to synthesize cDNA using M-MLV Reverse
Transcriptase (Promega Corporation, Madison, WI, USA). Based on the
previously published primers (22), qPCR was performed to measure the
mRNA levels of caveolin-1. The primers were as follows: caveolin-1,
forward 5′-TCA ACC GCG ACC CTA AAC ACC-3′ and reverse 5-′TGA AAT
AGC TCA GAA GAG ACA T-3′; β-actin, forward 5′-GGA GCA ATG ATC TTG
ATC TT-3′ and reverse 5′-CCT TCC TGG GCA TGG AGT CCT-3′. The
conditions for qPCR were as follows: Enzyme activation at 95°C for
10 min, 40 cycles of amplification and each of them consisted of
denaturation at 95°C for 15 sec, annealing at 60°C for 60 sec, and
extension at 60°C for 60 sec. The results were calculated with the
comparative quantification cycle (Cq) method. RT-qPCR was performed
using the Applied Biosystems 7500 Sequence Detection system (Thermo
Fisher Scientific, Inc.). The expression of caveolin-1 was
normalized to β-actin. The conditions for qPCR were as follows:
Enzyme activation at 95°C for 10 min, followed by 40 cycles of
amplification, each consisting of denaturation at 95°C for 15 sec,
annealing at 60°C for 60 sec and extension at 60°C for 60 sec. The
results were calculated using the quantification cycle (Cq) method
(23), and the expression of
caveolin-1 was normalzed with β-actin.
Western blot analysis
Using lysis buffer (Beyotime Institute of
Biotechnology), the cell lysates were prepared immediately
following treatment. Protein concentrations were measured using the
Bradford method (Bio-Rad Laboratories, Inc., Hercules, CA, USA).
Equal quantities (100 µg) of proteins were loaded and
separated on 8% SDS-polyacrylamide gels. The proteins were then
transferred onto PVDF membranes (EMD Millipore, Bedford, MA, USA).
Following blocking in TBST buffer containing 5% skim milk at room
temperature for 2 h, the blots were incubated at 4°C overnight with
the following primary antibodies: Rabbit anti-calveolin-1 (cat. no.
3267), rabbit anti-p473-Akt (cat. no. 4060), rabbit anti-GAPDH
(cat. no. 5174) and rabbit anti-Akt (cat. no. 4691) (Cell Signaling
Technology, Inc. Danvers, MA, USA). The blots were then washed in
TBST and incubated with the horseradish peroxidase-conjugated
Chicken anti-rabbit IgG secondary antibodies (cat. no. sc-516087;
Santa Cruz Biotechnology, Inc.) at room temperature for 1 h.
Following washing in TBST, the immunoreactive bands were visualized
by enhancement using a chemiluminescence kit (Pierce Biotechnology,
Rockford, IL, USA). The immunoreactive bands of GAPDH were used as
an internal control.
Statistical analysis
Experiments were performed three times. Data are
presented as the mean ± standard deviation. Statistical differences
were analyzed using the Student's two-sided t-test or one
way analysis of variance using SPSS 21.0 software (IBM SPSS,
Armonk, NY, USA). P≤0.05 was considered to indicate a statistically
significant difference.
Results
Leptin promotes cell proliferation
To determine the effect of leptin on the growth of
hFOB 1.19 cells, an MTT assay was performed. The cells were exposed
to leptin at the doses of 0, 0.01, 0.05, 0.1, 0.5, 1, 5 and 10
µg/ml for 24 h. As shown in Fig. 1A, the cell viabilities at the doses
ranging between 0.01 and 1 µg/ml were comparable with the
control, whereas the cell viabilities at 5 and 10 µg/ml were
marginally decreased, but not significantly, compared with that of
the control.
Subsequently, time-response assessment was performed
(Fig. 1B). The cells were
incubated with 0.5 µg/ml leptin for 24, 48, 72 and 96 h.
Between 24 and 72 h, a time-dependent increase in cell viability
induced by leptin was observed. Although 96-h treatment with 0.5
µg/ml leptin resulted in a cell viability comparable with
that of 72-h treatment, the cell viability was significantly
increased, compared with that in the control group at 96 h. Taken
together, these findings indicated that leptin induced hFOB 1.19
cell proliferation.
Leptin induces the expression of
caveolin-1
To observe the effect of lepin on the expression of
caveolin-1, the cells were exposed to leptin at the gradient doses
of 0, 0.01, 0.05, 0.1, 0.5, 1, 5 and 10 µg/ml for 24 h. The
mRNA and protein expression levels of caveolin-1 showed a
significant dose-dependent increase between doses of 0.05 and 5
µg/ml, whereas 0.01 µg/ml leptin had no effect on the
expression levels (Fig. 2A and B).
Unexpectedly, the expression of caveolin-1 at 10 µg/ml was
comparable to that at 5 µg/ml. Subsequently, time-response
assessment of the effect of leptin on the expression of caveolin-1
was performed. The cells were incubated with 0.5 µg/ml
leptin for 12, 24, 36 and 48 h. A time-dependent increase in the
expression of caveolin-1 was observed between 12 and 36 h, whereas
no increase in the expression of caveolin-1 was observed at 48 h,
compared with that at 36 h (Fig. 2C
and D). Taken together, these results indicated that leptin
induced the expression of caveolin-1.
Caveolin-1 konckdown decreases
leptin-induced Akt activation
It has been reported that leptin can activate the
phosphoinositide 3-kinase (PI3K) signaling pathway in a variety of
cells, including vascular smooth muscle, nucleus pulposus and
leukemic cells (24–26). Therefore, the present study
evaluated the effect of caveolin-1 knockdown on the activation of
the signaling pathway by leptin. As Akt is the immediate downstream
kinase activated by PI3K, the level of p-Akt was measured in the
present study. As shown in Fig. 3,
the level of p-Akt was markedly increased in the hFOB 1.19 cells
exposed to 0.5 µg/ml leptin, whereas no significant change
in the level of Akt was noted. Furthermore, the present study
evaluated the effect of caveolin-1 on the activation of Akt by
leptin. Caveolin-1 was knocked down by siRNA, and a marked decrease
in the level of p-Akt was noted, indicating that caveolin-1 may
functionally contribute to leptin-induced Akt activation.
Additionally, the effect of Akt activation on the expression of
caveolin-1 was evaluated. Following exposure to Akt inhibitor IV,
the increased expression of caveolin-1 was significantly inhibited
(Fig. 3).
Effect of caveolin-1 and p-Akt on
leptin-induced cell proliferation
To evaluate the involvement of caveolin-1 and p-Akt
in leptin-induced cell proliferation, the present study examined
the effects of caveolin-1 knockdown and the inhibition of Akt
activation on 0.5 µg/ml leptin-induced cell proliferation at
24, 48, 72 and 96 h. As shown in Fig.
4, leptin treatment significantly increased cell viability,
compared with the control group. As expected, the cell viabilities
in the groups of cells with caveolin-1 knockdown and Akt inhibition
were significantly suppressed, compared with leptin-treated group.
Taken together, these results indicated that caeolin-1 knockdown
and Akt inhibition individually counteracted the proliferative
function of leptin.
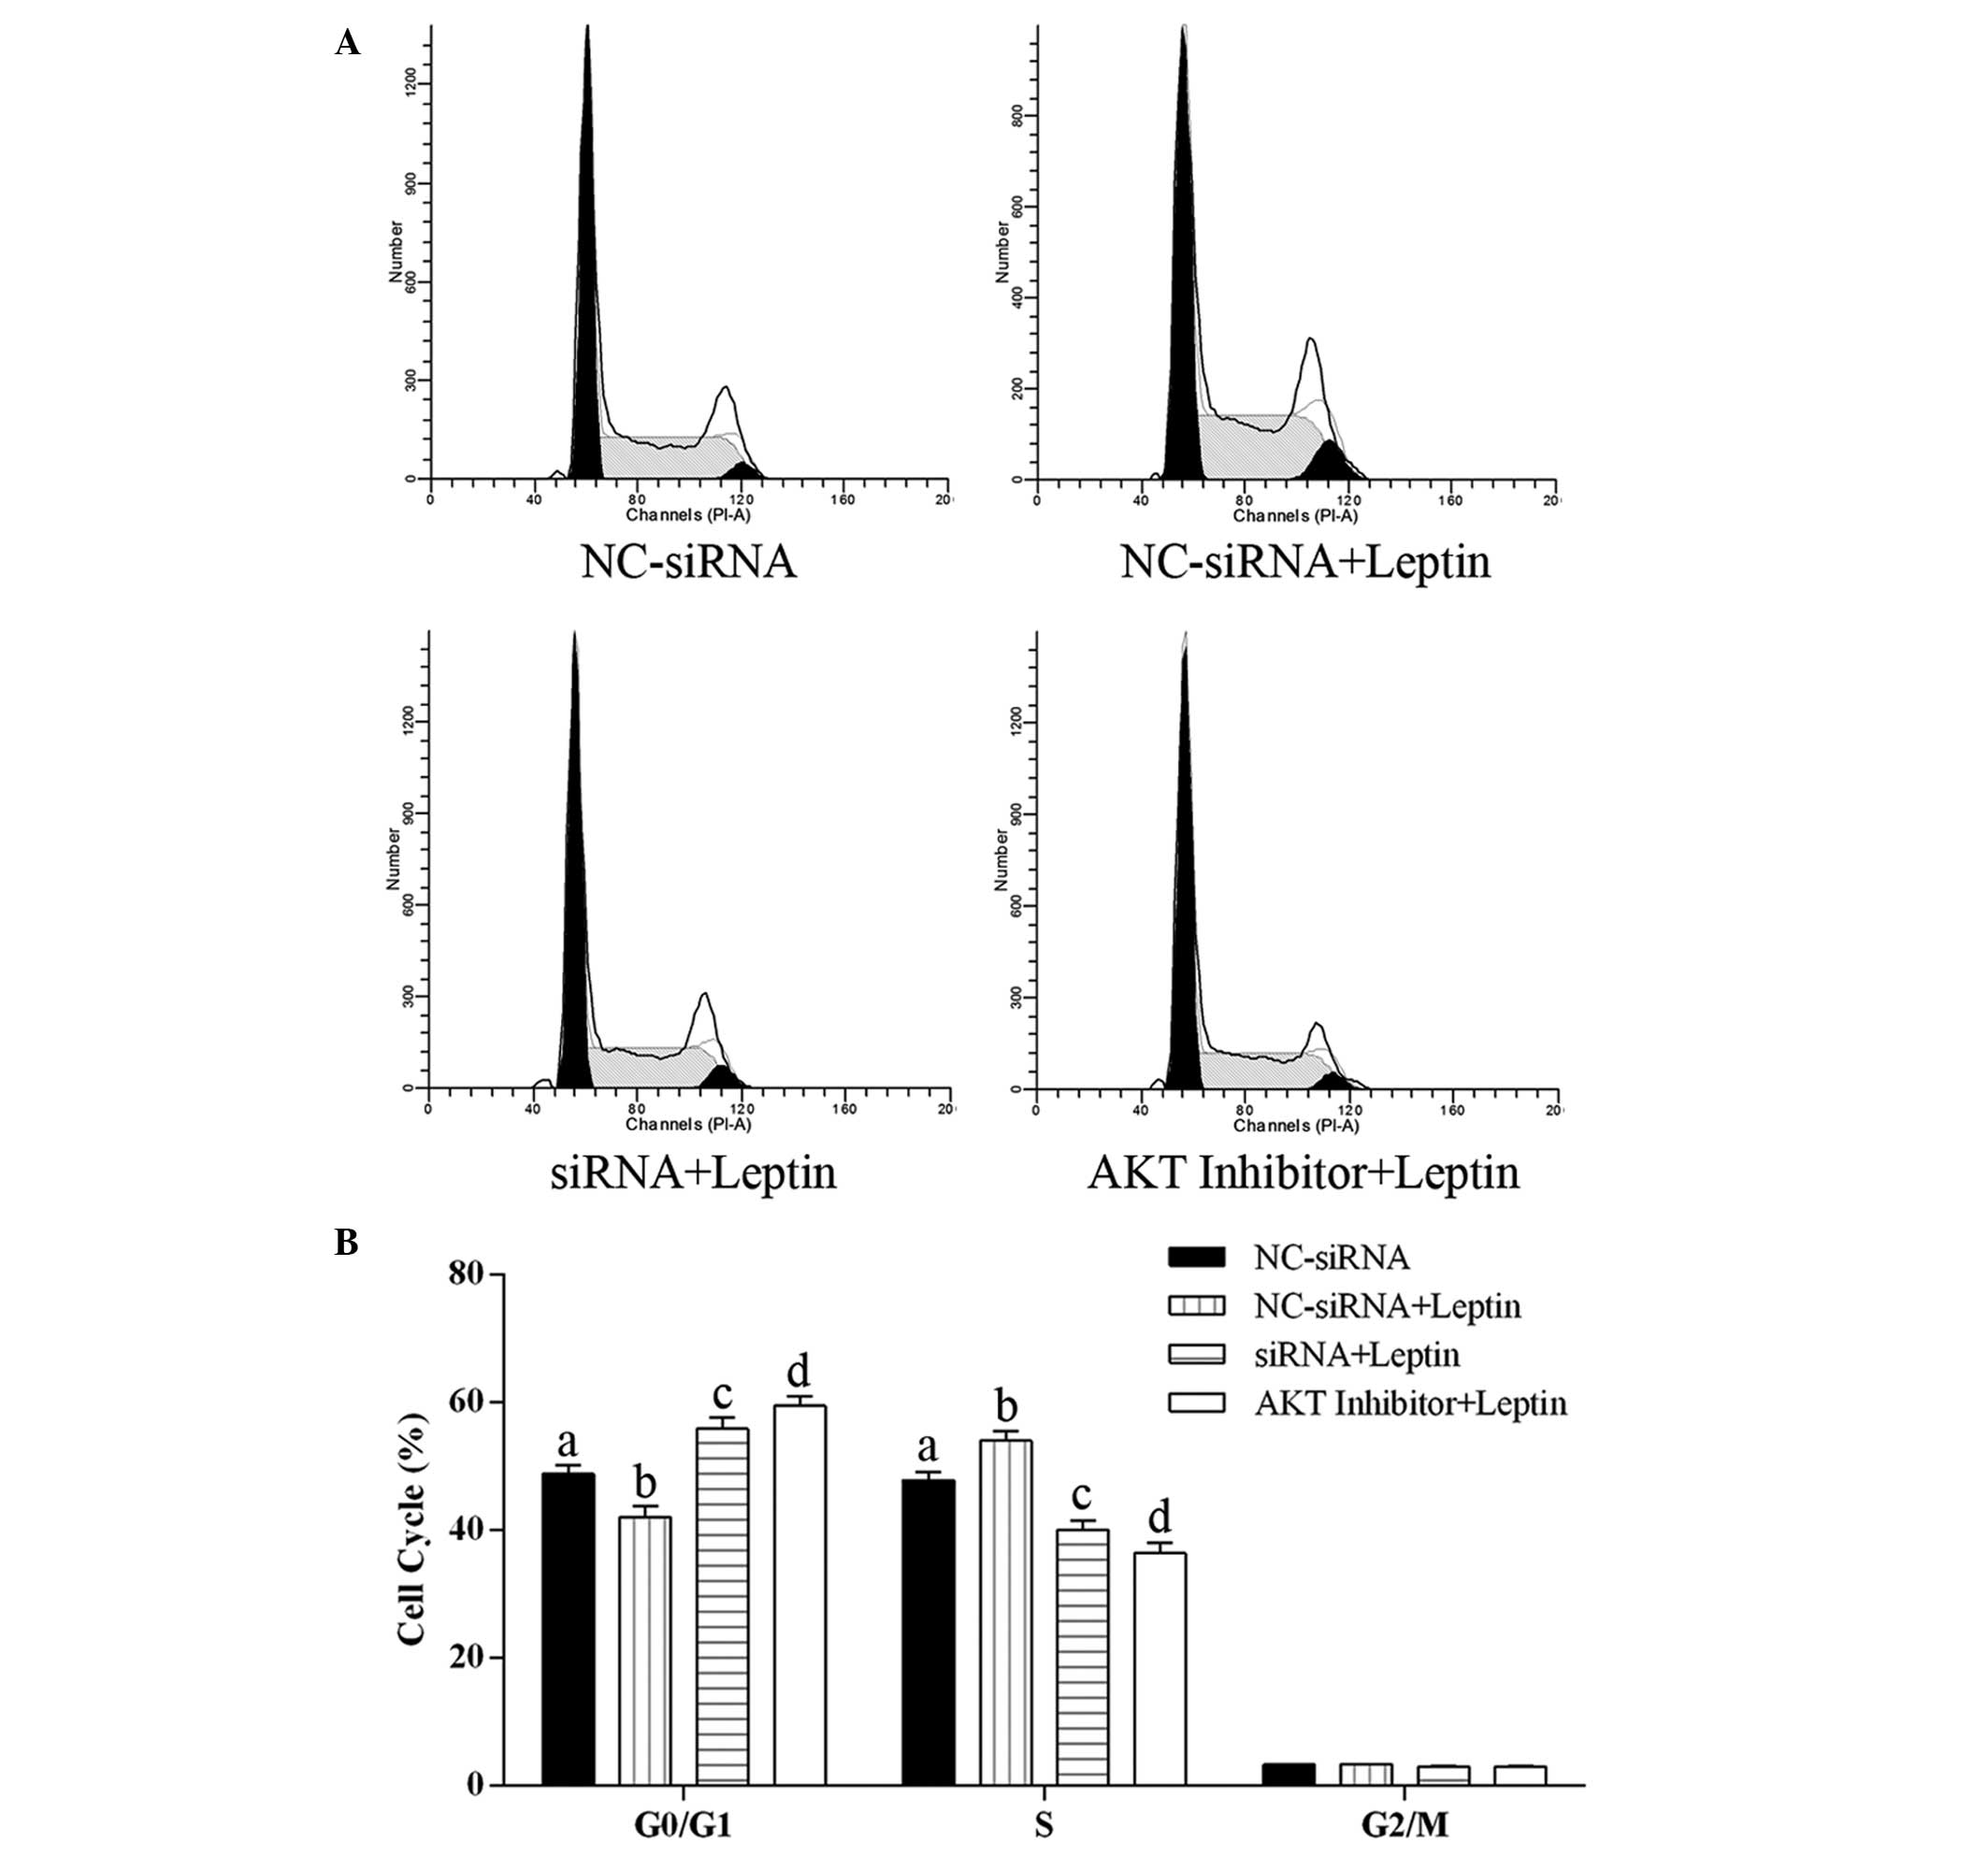
Effect of caveolin-1 knockdown and Akt
activation inhibition on the cell cycle distribution of cells
exposed to leptin
The cell cycle distribution of the hFOB 1.19 cells
was examined using flow cytometry. As shown in Fig. 5, exposure of the cells to leptin at
0.5 µg/ml for 24 h significantly decreased the proportion of
cells in the G0/G1 phase and increased the proportion of cells in
the S phase, compared with the control group, indicating that
leptin promoted the cell cycle towards the S phase. Compared with
the decreased proportion of cells in the G01/G1 phase and increased
proportion of cells in the S phase in the cells treated with
leptin, caveolin-1 knockdown and the inhibition of Akt activation
significantly increased the proportion of cells in the G0/G1 phase
and decreased the proportion of cells in the S phase, compared with
control group. Furthermore, the proportions of cells in the G0/G1
and S phases following Akt inhibition were significantly higher and
lower, respectively, compared with those following cavelin-1
knockdown. These results revealed that caveolin-1 knockdown and the
inhibition of Akt activation arrested hFOB 1.19 cell proliferation
via inducing cell cycle arrest at the G0/G1 phase.
Effect of caveolin-1 knockdown and Akt
activation inhibition on the apoptosis of cells exposed to
leptin
To evaluate whether caveolin-1 knockdown and Akt
inhibition induced cell apoptosis following treatment with 0.5
µg/ml leptin, the rates of apoptosis at the early and late
stages were detected. As shown in Fig.
6, treatment with letpin marginally, but significantly,
decreased the rate of cell apoptosis at each stage, compared with
the control group. By contrast, caveolin-1 knockdown and Akt
inhibition resulted in A higher apoptotic rate, compared with th
econtrol group. These results revealed that caveolin-1 and p-Akt
were critical in the anti-apoptotic effect of leptin on the
cells.
Discussion
It is evident that leptin is important in bone
formation (15), however, it
remains controversial whether the effects of leptin on bone
formation are positive or negative. Osteoblasts, or bone-forming
cells, are one of three distinct cell types in bone. It is well
known that osteoblasts are positively associated with bone mass and
bone density (27). In the present
study, it was confirmed that leptin directly enhanced the
proliferation of osteoblasts and revealed that this effect was
critically mediated by caveolin-1 through the activation of
Akt.
Leptin functions as a growth factor in a variety of
cell types, including human prostate cancer cells and mouse
tracheal epithelial cells (28,29).
Gordeladze et al (30)
showed that leptin promotes human osteoblast proliferation.
Consistently, it was observed that leptin increased the
proliferation of the hFOB 1.19 cells in the present study.
Additionally, the results of the present study showed that leptin
suppressed the apoptosis of hFOB 1.19 cells. This supported the
results of a previous report, which found that leptin can protect
osteoblasts against apoptosis throughout the entire incubation
period via enhancing the expression of B cell lymphoma-2
(Bcl-2)-associated X protein-α and Bcl-2 (30). Leptin receptors are present in
osteoblasts (4,31), indicating that leptin exerts a
proliferative effect on hFOB 1.19 cells by directly binding to its
receptor. This further supports the hypothesis that peripheral
leptin may protect against bone loss.
As the major structural protein in caveolae,
caveolin-1 can be regulated by various cytokines, and is considered
to functionally contribute to certain intracellular signaling
pathways (32). According to the
results of the present study, the expression of caveolin-1 was
markedly elevated by leptin. This is consistent with the results of
a previous study, which demonstrated that leptin increases the
protein expression of caveolin-1 in vascular endothelial cells
(33). In the present study, it
was demonstrated that caveolin-1 and p-Akt were critical in the
proliferative effect of leptin. Furthermore, it was observed that,
in the cells with caveolin-1 knockdown, the activation of Akt by
leptin was significantly decreased, however, it was significantly
higher than that in the control group (Fig. 3), suggesting that caveolin-1
enhanced the activation of Akt by leptin. Taken together, these
results indicated that caveolin-1 may be a positive regulator for
the proliferative signaling mechanism of leptin. However, this
differed from the results of a previous study, which reported that
caveolin-1 shares a functional similarity to the suppressor of
cytokine signalling proteins, which are involved in the classical
negative feedback signaling mechanism (34). Additionally, it has been shown that
increased expression of caveolin-1 impairs the activation of
extracellular signal-regulated kinase (ERK) induced by exposure to
100 ng/ml leptin for 0–30 min in vascular endothelial cells, and
may have implications for the development of leptin resistance in
the endothelium (33). Caveolin-1
is found to be expressed at high levels in osteoblasts (16). In caveolin-1, there is a
scaffolding domain, which can interact with various signal
transduction molecules, including src family tyrosine kinases,
receptor tyrosine kinases and protein kinase C (35). Zeidan et al (17) demonstrated that caveolin-1
colocalizes with leptin receptors, and suggested that caveolae are
important, and may have a primary role in leptin-induced activation
of ERK1/2 in vascular smooth muscle cells. This difference between
the positive role of leptin in the present study and the negative
role in the above mentioned studies may be due to different
treatment methods and cell lines.
The present study confirmed the proliferative role
of leptin in osteoblasts and demonstrated that caveolin-1 was
critical in leptin-induced osteoblast proliferation. However, the
present study involved in vitro experiments. Further
investigations are required to further elucidate the mechanism of
leptin signaling in osteoblasts. These data may assist in the
development of therapeutics for leptin-induced bone diseases.
References
|
1
|
Sinha MK, Sturis J, Ohannesian J, Magosin
S, Stephens T, Heiman ML, Polonsky KS and Caro JF: Ultradian
oscillations of leptin secretion in humans. Biochem Biophys Res
Commun. 228:733–738. 1996. View Article : Google Scholar : PubMed/NCBI
|
|
2
|
Maffei M, Halaas J, Ravussin E, Pratley
RE, Lee GH, Zhang Y, Fei H, Kim S, Lallone R, Ranganathan S, et al:
Leptin levels in human and rodent: Measurement of plasma leptin and
ob RNA in obese and weight-reduced subjects. Nat Med. 1:1155–1161.
1995. View Article : Google Scholar : PubMed/NCBI
|
|
3
|
Zhang J and Wang N: Leptin in chronic
kidney disease: A link between hematopoiesis, bone metabolism, and
nutrition. Int Urol Nephrol. 46:1169–1174. 2014. View Article : Google Scholar
|
|
4
|
Reseland JE, Syversen U, Bakke I, Qvigstad
G, Eide LG, Hjertner O, Gordeladze JO and Drevon CA: Leptin is
expressed in and secreted from primary cultures of human
osteoblasts and promotes bone mineralization. J Bone Miner Res.
16:1426–1433. 2001. View Article : Google Scholar : PubMed/NCBI
|
|
5
|
Taichman RS and Hauschka PV: Effects of
interleukin-1 beta and tumor necrosis factor-alpha on osteoblastic
expression of osteocalcin and mineralized extracellular matrix in
vitro. Inflammation. 16:587–601. 1992. View Article : Google Scholar : PubMed/NCBI
|
|
6
|
Laharrague P, Larrouy D, Fontanilles AM,
Truel N, Campfield A, Tenenbaum R, Galitzky J, Corberand JX,
Pénicaud L and Casteilla L: High expression of leptin by human bone
marrow adipocytes in primary culture. FASEB J. 12:747–752.
1998.PubMed/NCBI
|
|
7
|
Zhang Y, Proenca R, Maffei M, Barone M,
Leopold L and Friedman JM: Positional cloning of the mouse obese
gene and its human homologue. Nature. 372:425–432. 1994. View Article : Google Scholar : PubMed/NCBI
|
|
8
|
Sebastién-Ochoa A, Fernández-Garcia D,
Reyes-García R, Mezquita-Raya P, Rozas-Moreno P, Alonso-Garcia G
and Muñoz-Torres M: Adiponectin and leptin serum levels in
osteoporotic postmenopausal women treated with raloxifene or
alendronate. Menopause. 19:172–177. 2012. View Article : Google Scholar
|
|
9
|
Lajeunesse D, Pelletier JP and
Martel-Pelletier J: Osteoarthritis: A metabolic disease induced by
local abnormal leptin activity? Curr Rheumatol Rep. 7:79–81. 2005.
View Article : Google Scholar : PubMed/NCBI
|
|
10
|
Lee SW, Park MC, Park YB and Lee SK:
Measurement of the serum leptin level could assist disease activity
monitoring in rheumatoid arthritis. Rheumatol Int. 27:537–540.
2007. View Article : Google Scholar
|
|
11
|
Wu YP, Chen WS, Xu SJ and Zhang N:
Osteoporosis as a potential contributor to the bone metastases. Med
Hypotheses. 75:514–516. 2010. View Article : Google Scholar : PubMed/NCBI
|
|
12
|
Ducy P, Amling M, Takeda S, Priemel M,
Schilling AF, Beil FT, Shen J, Vinson C, Rueger JM and Karsenty G:
Leptin inhibits bone formation through a hypothalamic relay: A
central control of bone mass. Cell. 100:197–207. 2000. View Article : Google Scholar : PubMed/NCBI
|
|
13
|
Bartell SM, Rayalam S, Ambati S, Gaddam
DR, Hartzell DL, Hamrick M, She JX, Della-Fera MA and Baile CA:
Central (ICV) leptin injection increases bone formation, bone
mineral density, muscle mass, serum IGF-1, and the expression of
osteogenic genes in leptin-deficient ob/ob mice. J Bone Miner Res.
26:1710–1720. 2011. View
Article : Google Scholar : PubMed/NCBI
|
|
14
|
Neve A, Corrado A and Cantatore FP:
Osteoblast physiology in normal and pathological conditions. Cell
Tissue Res. 343:289–302. 2011. View Article : Google Scholar
|
|
15
|
Takeda S, Elefteriou F, Levasseur R, Liu
X, Zhao L, Parker KL, Armstrong D, Ducy P and Karsenty G: Leptin
regulates bone formation via the sympathetic nervous system. Cell.
111:305–17. 2002. View Article : Google Scholar : PubMed/NCBI
|
|
16
|
Sawada N, Taketani Y, Amizuka N, Ichikawa
M, Ogawa C, Nomoto K, Nashiki K, Sato T, Arai H, Isshiki M, et al:
Caveolin-1 in extracellular matrix vesicles secreted from
osteoblasts. Bone. 41:52–58. 2007. View Article : Google Scholar : PubMed/NCBI
|
|
17
|
Zeidan A, Purdham DM, Rajapurohitam V,
Javadov S, Chakrabarti S and Karmazyn M: Leptin induces vascular
smooth muscle cell hypertrophy through angiotensin II- and
endothelin-1-dependent mechanisms and mediates stretch-induced
hypertrophy. J Pharmacol Exp Ther. 315:1075–1084. 2005. View Article : Google Scholar : PubMed/NCBI
|
|
18
|
Baker N, Zhang G, You Y and Tuan RS:
Caveolin-1 regulates proliferation and osteogenic differentiation
of human mesenchymal stem cells. J Cell Biochem. 113:3773–3787.
2012. View Article : Google Scholar : PubMed/NCBI
|
|
19
|
Solomon KR, Danciu TE, Adolphson LD, Hecht
LE and Hauschka PV: Caveolin-enriched membrane signaling complexes
in human and murine osteoblasts. J Bone Miner Res. 15:2380–2390.
2000. View Article : Google Scholar : PubMed/NCBI
|
|
20
|
Hens JR, Wilson KM, Dann P, Chen X,
Horowitz MC and Wysolmerski JJ: TOPGAL mice show that the canonical
Wnt signaling pathway is active during bone development and growth
and is activated by mechanical loading in vitro. J Bone Miner Res.
20:1103–1113. 2005. View Article : Google Scholar : PubMed/NCBI
|
|
21
|
Forbes A, Wadehra M, Mareninov S, Morales
S, Shimazaki K, Gordon LK and Braun J: The tetraspan protein EMP2
regulates expression of caveolin-1. J Biol Chem. 282:26542–26551.
2007. View Article : Google Scholar : PubMed/NCBI
|
|
22
|
Basu Roy UK, Henkhaus RS, Loupakis F,
Cremolini C, Gerner EW and Ignatenko NA: Caveolin-1 is a novel
regulator of K-RAS-dependent migration in colon carcinogenesis. Int
J Cancer. 133:43–57. 2013. View Article : Google Scholar : PubMed/NCBI
|
|
23
|
Livak KJ and Schmittgen TD: Analysis of
relative gene expression data using real-timequantitative PCR and
the 2(-Delta Delta C(T)) Method. Methods. 25:402–408. 2001.
View Article : Google Scholar
|
|
24
|
Liu GY, Liang QH, Cui RR, Liu Y, Wu SS,
Shan PF, Yuan LQ and Liao EY: Leptin promotes the osteoblastic
differentiation of vascular smooth muscle cells from female mice by
increasing RANKL expression. Endocrinology. 155:558–567. 2014.
View Article : Google Scholar
|
|
25
|
Li Z, Shen J, Wu WK, Yu X, Liang J, Qiu G
and Liu J: Leptin induces cyclin D1 expression and proliferation of
human nucleus pulposus cells via JAK/STAT, PI3K/Akt and MEK/ERK
pathways. PLoS One. 7:e531762012. View Article : Google Scholar
|
|
26
|
Beaulieu A, Poncin G, Belaid-Choucair Z,
Humblet C, Bogdanovic G, Lognay G, Boniver J and Defresne MP:
Leptin reverts pro-apoptotic and antiproliferative effects of
α-linolenic acids in BCR-ABL positive leukemic cells: Involvement
of PI3K pathway. PLoS One. 6:e256512011. View Article : Google Scholar
|
|
27
|
Lloyd JT, Alley DE, Hawkes WG, Hochberg
MC, Waldstein SR and Orwig DL: Body mass index is positively
associated with bone mineral density in US older adults. Arch
Osteoporos. 9:1752014. View Article : Google Scholar : PubMed/NCBI
|
|
28
|
Frankenberry KA, Somasundar P, McFadden DW
and Vona-Davis LC: Leptin induces cell migration and the expression
of growth factors in human prostate cancer cells. Am J Surg.
188:560–565. 2004. View Article : Google Scholar : PubMed/NCBI
|
|
29
|
Tsuchiya T, Shimizu H, Horie T and Mori M:
Expression of leptin receptor in lung: Leptin as a growth factor.
Eur J Pharmacol. 365:273–279. 1999. View Article : Google Scholar : PubMed/NCBI
|
|
30
|
Gordeladze JO, Drevon CA, Syversen U and
Reseland JE: Leptin stimulates human osteoblastic cell
proliferation, de novo collagen synthesis, and mineralization:
Impact on differentiation markers, apoptosis, and osteoclastic
signaling. J Cell Biochem. 85:825–836. 2002. View Article : Google Scholar : PubMed/NCBI
|
|
31
|
Lee YJ, Park JH, Ju SK, You KH, Ko JS and
Kim HM: Leptin receptor isoform expression in rat osteoblasts and
their functional analysis. FEBS Lett. 528:43–47. 2002. View Article : Google Scholar : PubMed/NCBI
|
|
32
|
Zhang J, Lazarenko OP, Blackburn ML,
Badger TM, Ronis MJ and Chen JR: Soy protein isolate down-regulates
caveolin-1 expression to suppress osteoblastic cell senescence
pathways. FASEB J. 28:3134–3145. 2014. View Article : Google Scholar : PubMed/NCBI
|
|
33
|
Singh P, Peterson TE, Sert-Kuniyoshi FH,
Jensen MD and Somers VK: Leptin upregulates caveolin-1 expression:
Implications for development of atherosclerosis. Atherosclerosis.
217:499–502. 2011. View Article : Google Scholar
|
|
34
|
Jasmin JF, Mercier I, Sotgia F and Lisanti
MP: SOCS proteins and caveolin-1 as negative regulators of
endocrine signaling. Trends Endocrinol Metab. 17:150–158. 2006.
View Article : Google Scholar : PubMed/NCBI
|
|
35
|
Razani B, Woodman SE and Lisanti MP:
Caveolae: From cell biology to animal physiology. Pharmacol Rev.
54:431–467. 2002. View Article : Google Scholar : PubMed/NCBI
|