Introduction
Glucocorticoids receptors (GRs) belong to the family
of steroid hormone receptors and they are found in a number of
different cell types in the human kidney, including glomerulus
cells, podocytes, epithelial cells and endothelial cells (1,2).
Glucocorticoids (GCs) are commonly used to treat proteinuric
glomerular diseases, such as membranoproliferative
glomerulonephritis (3), membranous
nephropathy (4), IgA nephropathy,
crescentic glomerulonephritis (5)
and antiglomerular basement membrane disease (6). In general, GCs remain the cornerstone
of treatment for a number of inflammatory such as lupus nephritis
(LN) (7,8) as well as for non-inflammatory renal
diseases such as the Minimal Change Nephropathy (MCD) (7,9).
In humans, there are two main isoforms of GR: The
active α form, which can bind GCs and mediate their effects, and
the inactive β form, which cannot bind GCs (2,10).
The binding of GCs to GRs results in the complex translocation to
the nucleus and further activation or inhibition of the synthesis
of certain anti-inflammatory proteins by binding to specific DNA
sequences called GC response elements (11,12).
GRs can also interact with transcription factors such as
NF-κB, which regulate cell proliferation and survival
(13) and they may also present
nongenomic effects which are though not well studied (14).
The effectiveness of GCs treatment may be influenced
by the structure and expression levels of GRs, their affinity for
GCs and their ability to translocate to the nucleus and
transactivate response elements. Different studies have indicated
that analysis of GRs in peripheral blood mononuclear cells (PBMCs)
before the initiation of steroid therapy may predict the clinical
response to steroids and the outcome for patients (9,15,16).
It has been also suggested that the expression of certain micro
microRNAs (miRNAs/miRs) may predict the clinical response to GCs
and influence the response of leukocytes to GCs (17). In particular, miR30a, miR24 and
miR370 have been already studied in focal segmental
glomerulosclerosis and membranous glomerulonephritis (9) compared with normal renal samples.
miRNAs are short, noncoding and single stranded RNAs that can block
protein translation by binding to the 30-untranslated regions
(30-UTRs) of target gene and inhibit the expression of genes
(18) thus regulating the
apoptosis, differentiation, metabolism and finally the availability
of GCs. Moreover, miRNAs may be also regulated by GCs to change
cell function, proliferation and survival (18).
The present study aimed to analyze GR and expression
of specific miRNAs (miR30a, miR24 and miR370) in human renal
samples from newly-diagnosed patients with LN, MCD and pauci-immune
nephritis (PIN) before the initiation of any treatment and to
compare them with the normal renal samples. It also aimed to study
the correlation of GR and miRNAs expression with various prognostic
parameters and the response to the treatment.
The primary aim of the present study was to analyze
mRNA and protein expression of GR in renal samples obtained from
renal biopsies of patients with primary (MCD) and secondary (LN and
PIN) nephritis compared with the ‘normal’ renal samples from
nephrectomized patients. The GR expression was correlated with
other prognostic parameters such as the eGFR and the disease
activity as well as the response to treatment.
The secondary outpoint was to analyze the expression
of the following miRNAs: miR30a, miR24 και miR370 in
pathological (from renal biopsies) and normal renal samples and to
associate them with the GR mRNA expression as well as the response
to treatment.
Materials and methods
Definitions
MCD: Complete remission was defined by the reduction
of proteinuria to <300 mg/day (or <300 mg/g of creatinine),
stable serum creatinine and serum albumin >3.5 g/dl. Partial
remission was defined by the reduction in proteinuria of >50
percent, with absolute values between 300 mg and 3.5 g/day
(19). According to time to
response, patients were further divided in two subgroups the early
(<4 weeks) and late responders (4–16 weeks) and the
non-responders (>16 weeks) (19).
LN: Complete remission was defined by the reduction
of proteinuria to <500 mg/day (or <300 mg/g of creatinine).
Partial remission was defined by the reduction of >50 percent of
the proteinuria (absolute values between 300 mg and 3.5 g/day)
(19). Non-responders were defined
those with no improvement after 3 months (12 weeks) of therapy.
PIN: Complete remission was defined by the
stabilization or improvement of kidney function, resolution of
hematuria and all other organ-specific vasculitic symptoms. Partial
remission was defined by the persistence of dysmorphic (i.e.,
glomerular) hematuria with or without red blood cell casts despite
improvement in or stabilization of the serum creatinine and
disappearance of extrarenal signs of active disease (19). Non responders were defined those
with non-response after 6 weeks of therapy.
Subjects
In the present study, a total of 51 patients with LN
(n=20), MCD (n=14) and PIN (n=17) and 22 healthy controls without
any renal disease were recruited from the Clinic of Nephrology and
Renal Transplantation of the General Laikon hospital between
November 2020 and March 2021. The patients had all undergone renal
biopsies, while the controls were nephrectomised for renal tumors
without a preexisting history of renal disease. mRNA expression was
analyzed through reverse transcription-quantitative (RT-q) PCR and
protein expression through immunohistochemical analysis. Clinical
and immunohistopathological data were collected from all
participants after obtaining written consent. The present study was
conducted in accordance with the ethical standards of the
institutional research committee of the General Laikon hospital and
the Medical School of the National and Kapodistrian University of
Athens and based on the Declaration of Helsinki, (approval no. 235;
03/04/2020).
Renal tissues samples
The mRNA expression of the GR, as well as of miR30a,
miR24 and miR370 were determined by RT-qPCR in renal tissues
samples. Total RNA from renal tissues was extracted using
NucleoSpin miRNA kit (Macherey-Nagel) according to the
manufacturer's instructions. A Takara kit (Takara Bio Europe AB)
was used for cDNA according to the manufacturer's instructions. All
samples were incubated with DNAse I (Qiagen GmbH) prior to cDNA
synthesis.
The RNA quality and concentration were calculated
spectrophotometrically. Then 1 µg of total RNA from each sample was
reverse-transcribed using the Superscript III reverse transcriptase
system (Invitrogen; Thermo Fisher Scientific, Inc.) using oligo-dT
primer (0.5 µM). The mRNA expression levels of each target were
measured using semi-quantitative real-time polymerase chain
reaction (RT-qPCR) on an ABI Prism 7000 instrument (Applied
Biosystems; Thermo Fisher Scientific, Inc.). Each cDNA sample was
mixed with specific sets of primers and the qPCR master mix (KAPA
SYBR FAST Universal kit; MilliporeSigma) for 2 min at 50°C and 2
min at 95°C, followed by 40 cycles consisting of 15 sec at 95°C and
60 sec at 60°C. A standard dissociation method was used to ensure
that each amplicon was a single product. All reactions were
performed in duplicate to ensure reproducible results. To evaluate
differences in expression between groups, the fold change was
calculated for each gene applying the comparative Cq
(2−∆∆Cq) method. Relative mRNA expression levels were
estimated by calculating delta Cq (Cycle threshold) values using
the Cq values of the respective housekeeping gene for normalization
(20). Primer sets used to amplify
the genomic region of reference and target genes are included in
the supplementary data (Table SI)
(16). Gene and miRNAs expression
levels were normalized by subtracting Cq value of the GAPDH and
U6sn RNA respectively from that of GOI using the equation
(ΔCq=-|CqGOI-CqGAPDH or U6sn|).
Immunohistochemistry
Biopsy slides were collected from all the 51
patients and the 22 nephrectomized patients used as controls. From
them, 4 µm sections of formalin-fixed paraffin-embedded tissue were
prepared for immunohistochemical staining. A polyclonal rabbit
anti-GCR antibody (Invitrogen; Thermo Fisher Scientific, Inc.; cat.
no. PA1-511A) incubated for 60 min at room temperature, was used at
a dilution of 1:200 for GR staining. The sections were
deparaffinized, hydrated in ethyl alcohol and washed in tap water.
Endogenous peroxidase activity was blocked with 3% hydrogen
peroxide. Antigen retrieval was performed in EDTA buffer for 20 min
using a steamer and the ready-to-use antibody was incubated for 30
min at room temperature. Secondary staining kits (EnVision; Dako;
Agilent Technologies, Inc.) were used according to the
manufacturer's instructions and chromogen was added. Finally, the
slides were counterstained with hematoxylin for 1 min at room
temperature.
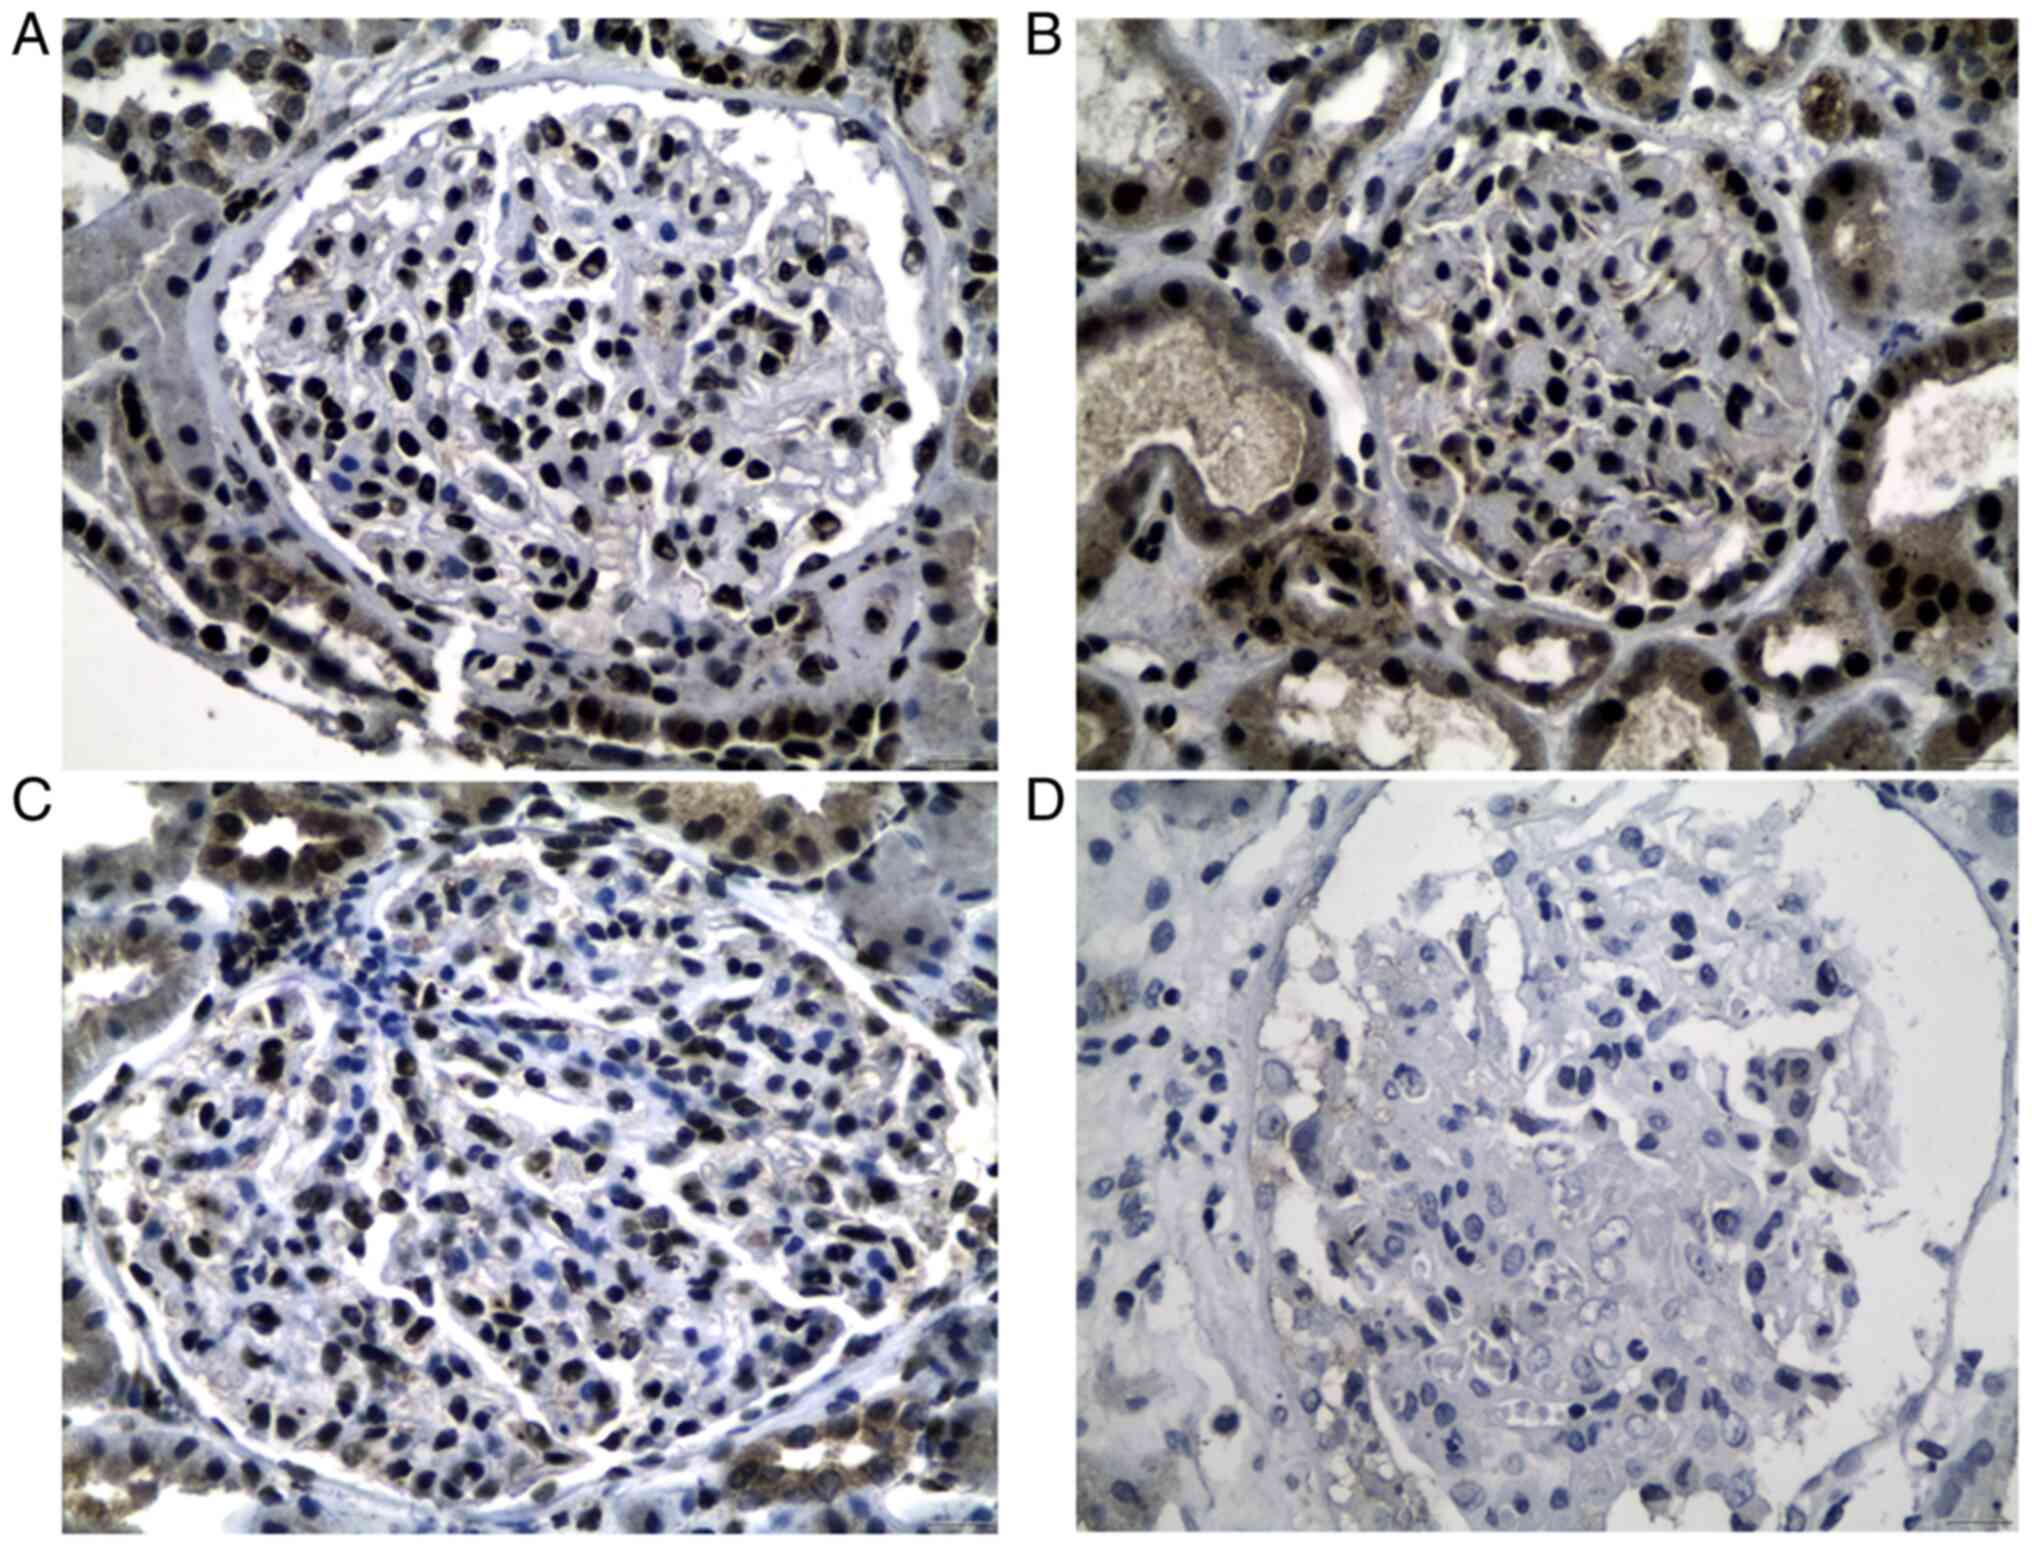
A cut-off of at least 5 glomeruli in each tissue
sample was required as an minimum adequate sample for the
immunohistochemical evaluation. The intense GR staining was noticed
in glomerular cells (location and appearance of podocytes). The
immunohistochemical assessment was performed using an Olympus
microscope (magnification, ×400). The number of positive podocytes
with a strong nuclear staining per glomerulus was used as a marker,
in order to determine the extent/degree of GR positivity. Any other
positivity in different glomerular or other renal cells was
overlooked. The count of positive podocytes was performed by two
experienced pathologists. The following semi-quantitative score was
defined including three groups of cases (A, B, C) for every disease
category, according to the average (mean) number of positive
podocytes/per glomerulus: Group A (mild degree): 1–2 positive
podocytes/glomerulus; group B (moderate degree): 3–5 positive
podocytes/glomerulus; and group C (severe degree): ≥6 positive
podocytes/glomerulus.
Statistical analysis
All the data in this study are presented as mean ±
standard deviation (SD) of the mean. Mann-Whitney tests were used
to compare non-parametric data between the different groups of
patients and controls. For the comparison of numerical variables
among multiple groups, one-way ANOVA or Kruskal-Wallis test
followed by post hoc analysis (Bonferroni correction) were used
based on the results of Shapiro-Wilk normality test. Spearman's
rank correlation coefficient tests were used to analyze
correlations. All calculations were performed using GraphPad Prism
7 software (Dotmatics). All tests were two-sided. P<0.05 was
considered to indicate a statistically significant difference.
Results
Clinical and epidemiological
characteristics of the total studied population
The clinical characteristics of all included
patients and controls are presented in Table I. All 51 patients were naive of any
treatment at the time of diagnosis and 22 nephrectomised controls
were also included in the present study.
 | Table I.Clinical and epidemiological
characteristics of the included population. |
Table I.
Clinical and epidemiological
characteristics of the included population.
|
| Patients with renal
disease |
|---|
|
|
|
|---|
| Characteristic | MCD | LN | PIN | Total | Controls |
|---|
| Number | 14 | 20 | 17 | 51 | 22 |
| Sex
(Female/Male) | 7/7 | 17/3 | 9/8 | 33/18 | 11/11 |
| Mean age ± SD
(years) | 52±17.2 | 38±16.9 | 61.3±12 | 49±18.5 | 64.8±13.9 |
| Mean creatinine
levels ± SD (mg/dl) | 1.35±1 | 0.94±0.7 | 3.4±2.1 | 1.86±1.7 | na |
| Mean eGFR ± SD
(ml/min/1.73 m2) | 78.2±28.5 | 87.7±27.7 | 25.6±19.6 | 66.7±37 | na |
| Treated with GC
before biopsy | 0 | 7 | 3 | 10 | na |
| Albuminuria/24
h | 7.48±2.7 | 3.8±3.5 | 1.33±0.8 | 4.3±3.6 | na |
| Nephrotic
syndrome | 14/14 | 12/20 | 2/17 | 28/51 | na |
| Responders/non
responders | 10/4 | 5/13a | 7/7b | 38/51 | na |
| Follow-up (mean ±
SD), months | 26.3 (14.4) | 11 (9) | 32.3 (14.8) |
| na |
mRNA and protein expression of total
GR in pathological and normal renal samples
GR mRNA expression was statistically significantly
underexpressed in all pathological renal samples of the patients
compared with ‘normal’ renal tissues of controls (P=0.023 for LN,
P=0.05 for MCD and P=0.004 for PIN; Fig. 1A). Similarly, total GR protein
expression was underexpressed in all pathological renal samples
(>6 of GR stained podocytes/glomerulus in 50% of patients with
LN; 50% with MCD; and 18% with PIN) compared with healthy controls
(>6 stained podocytes/glomerulus in the 100% of patients;
Fig. 2A-D).
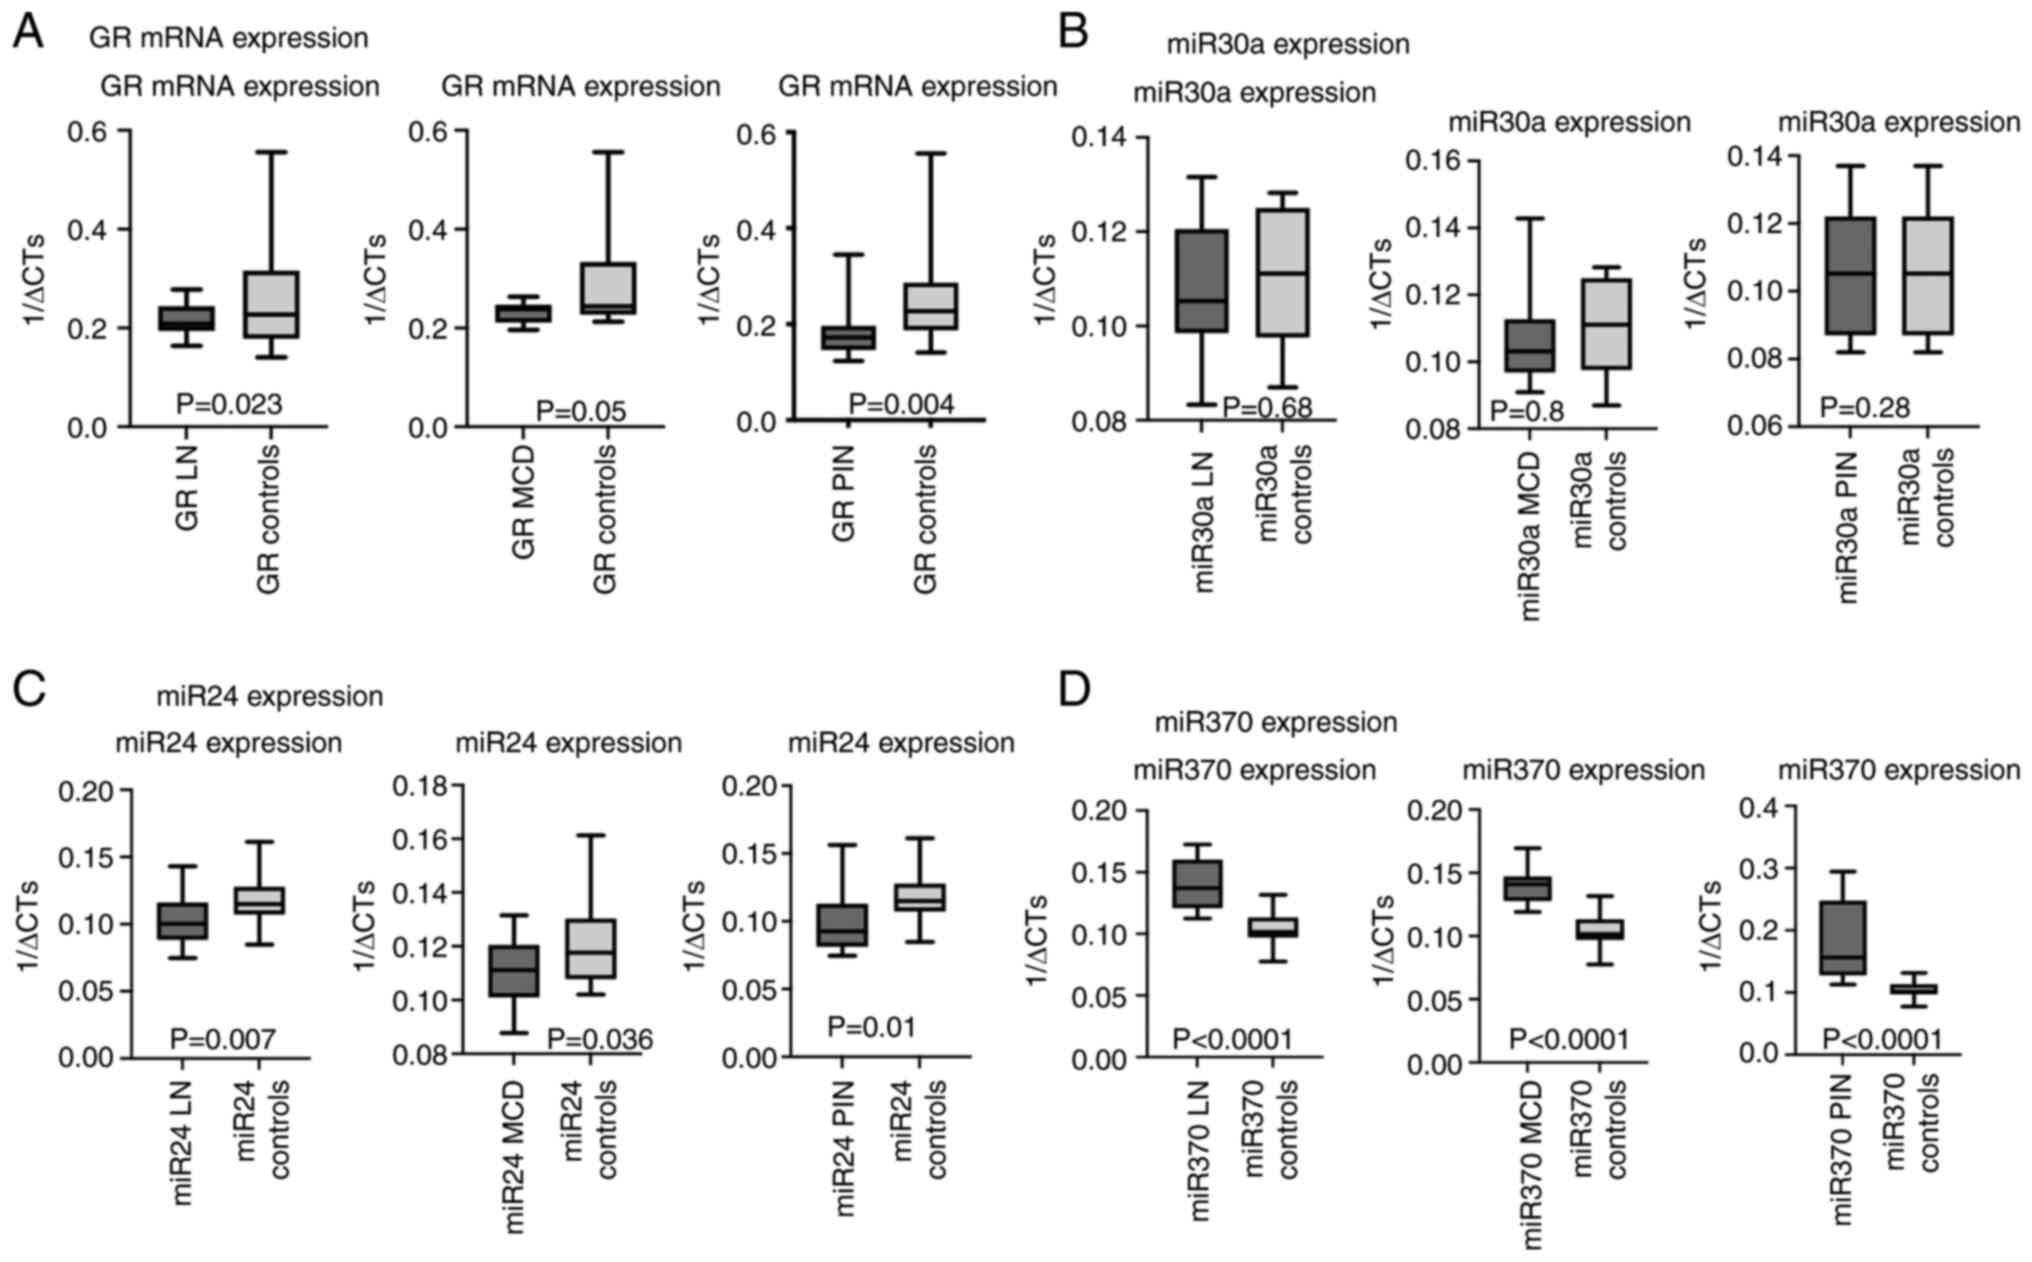 | Figure 1.mRNA expression of GR, miR 30a, miR24
and miR370 in the LN, MCD and PIN patients compared with controls.
(A) mRNA expression of GR in renal samples of patients with LN, MCD
and PIN compared with controls. (B) miR30a expression of GR in
renal samples of patients with LN, MCD and PIN compared with
controls. (C) miR 24 expression of GR in renal samples of patients
with LN, MCD and PIN, compared with controls. (D) miR 370
expression of GR in renal samples of patients with LN, MCD and PIN
compared with controls. GR, glucocorticoid receptor; miR, microRNA;
LN, Lupus nephritis; MCD, minimal change disease; PIN, pauci-immune
glomerulonephritis. |
In particular, in LN patients, 5/20 biopsies showed
a weak staining (group A), 5/20 biopsies showed a moderate staining
(group B) and the remaining 10/20 biopsies showed a strong staining
(group C). In MCD 1/14 cases were recorded in group A, 6/14
biopsies were recorded in group B and 7/14 in group C, while in PIN
cases, 8/17 cases were recorded in group A, 6/17 in group B and
3/17 cases in group C. All control group cases 22/22 (100%) showed
strong nuclear podocyte staining/per glomerulus (Table II).
| Table II.Immunohistochemical expression of GR
in LN, MCD and PIN renal samples classified in three grades based
on the number of podocytes with GR staining per glomerulus as
follows: A (mild): 1–2 podocytes stained with GR; B (moderate): 3–4
podocytes stained with GR; C (intense): >6 podocytes stained
with GR. |
Table II.
Immunohistochemical expression of GR
in LN, MCD and PIN renal samples classified in three grades based
on the number of podocytes with GR staining per glomerulus as
follows: A (mild): 1–2 podocytes stained with GR; B (moderate): 3–4
podocytes stained with GR; C (intense): >6 podocytes stained
with GR.
| Renal
disorder/Grade of GR expression (podocytes/glomerulus) | A (mild
staining) | B (moderate
staining) | C (intense
staining) | Total |
|---|
| LN | 5 (25%) | 5 (25%) | 10 (50%) | 20 |
| MCD | 1 (7%) | 6 (43%) | 7 (50%) | 14 |
| PIN | 8 (47%) | 6 (35%) | 3 (18%) | 17 |
| Controls | 0 | 0 | 22 (100) | 22 |
| Total | 14/51 (29%) | 17/51 (33.3%) | 20/51 (39%) |
|
Comparing GR mRNA expression in the different renal
diseases, it was observed that patients with PIN had significantly
lower expression of GR comparing with LN (P=0.006) and MCD
(P=0.021) patients whereas MCD patients presented significantly
higher GR expression compared with PIN (P=0.021) and LN (P=0.4)
patients although in the latter group the difference was not
statistical different (Table
III; Fig. 3A). Similarly, in
protein levels GR expression was lower in PIN patients (16.68% of
patients) compared with the GR expression in MCD and LN (Table II).
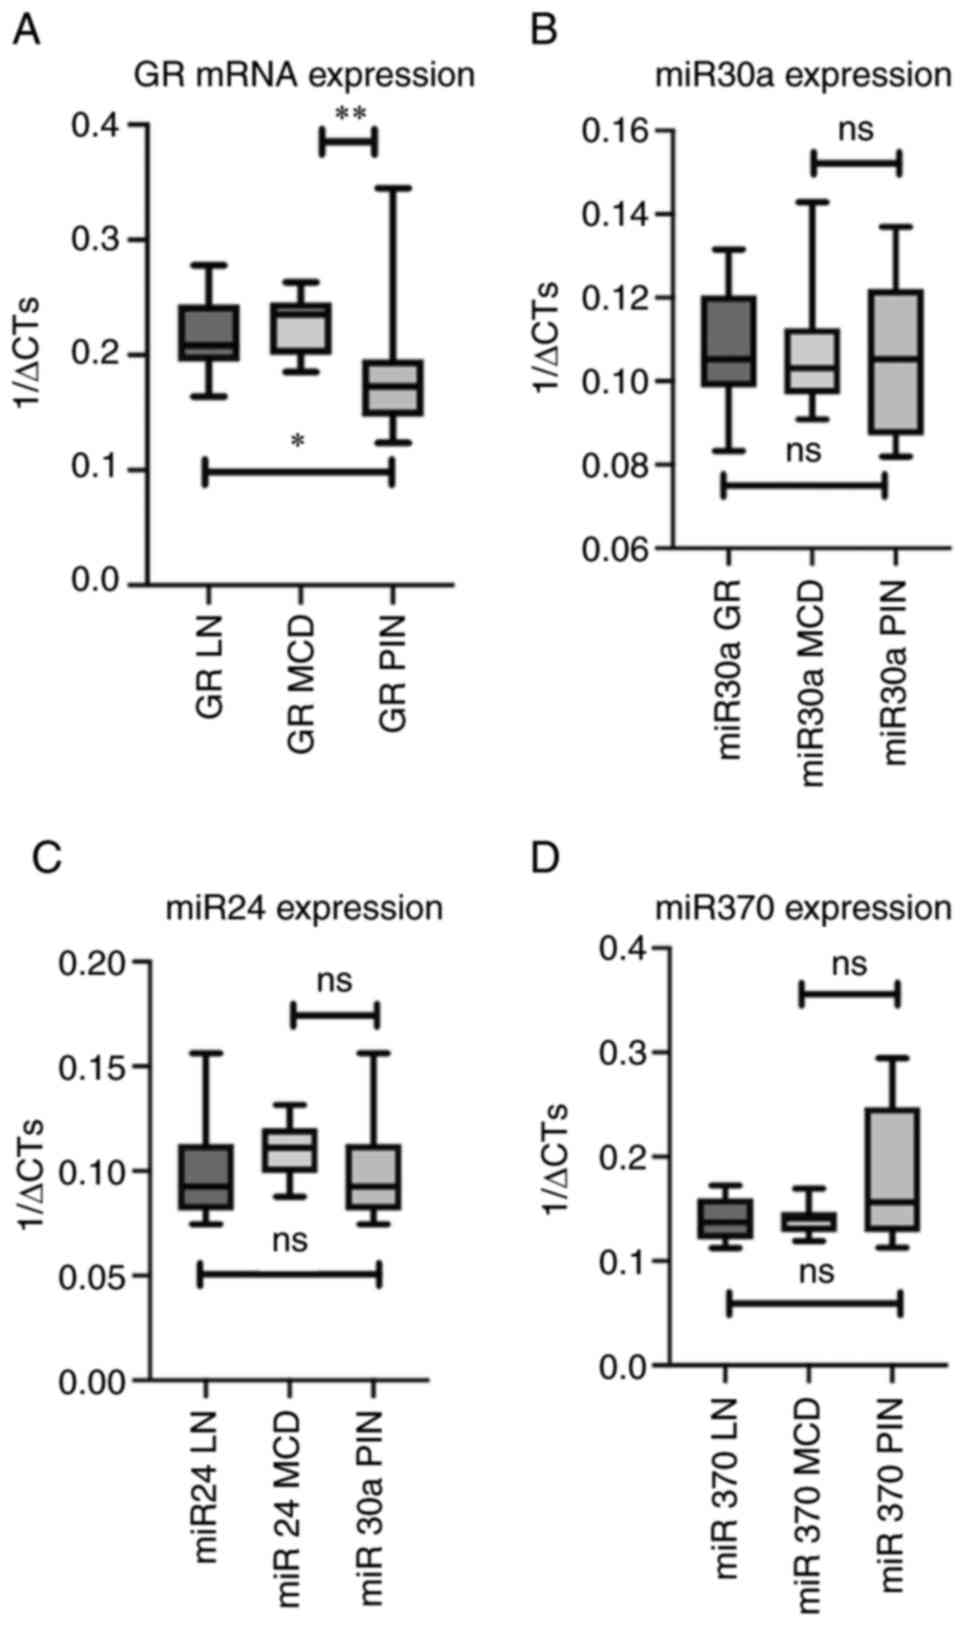 | Figure 3.Comparison of mRNA expression of GR,
miR 30a, miR24 and miR370 among the different renal disorders. (A)
Comparison of mRNA expression of GR in the renal samples of
patients with LN, MCD and PIN. (B) Comparison of miR30a expression
in the renal samples of patients with LN, MCD and PIN. (C)
Comparison of miR 24 expression in the renal samples of patients
with LN, MCD and PIN. (D) Comparison of miR 370 expression in the
renal samples of patients with LN, MCD and PIN. *P=0.016,
**P=0.021, ns, no significance; GR, glucocorticoid receptor; miR,
microRNA; LN, Lupus nephritis; MCD, minimal change disease; PIN,
pauci-immune glomerulonephritis. |
| Table III.Comparison of the fold regulation of
target genes (GR, miR30a, miR24, miR370) between the different
groups of patients with renal disorders (LN, MCD, PIN). |
Table III.
Comparison of the fold regulation of
target genes (GR, miR30a, miR24, miR370) between the different
groups of patients with renal disorders (LN, MCD, PIN).
| Fold regulation
(P-value)/Renal disease | GR total,
P-value | miR30a,
P-value | miR24, P-value | miR370,
P-value |
|---|
| LN vs.
Controls | −1.27,
P=0.023↓ | −1.15, P=0.680
(−) | −2.6, P=0.007↓ | 5.39,
P<0.001↑ |
| MCD vs.
Controls | −1.06,
P=0.052↓ | −1.09, P=0.810
(−) | −1.5, P=0.036↓ | 5.37,
P<0.001↑ |
| PIN vs.
Controls | −2.2, P=0.004
↓ | −1.29, P=0.281
(−) | −3.9, P=0.010↓ | 14,
P<0.001↑ |
| LN vs. MCD | P=0.419 | P=0.820(−) | P=0.381 (−) | P=0.992 (−) |
| LN vs. PIN | P=0.016
(LN>PIN) | P=0.762 (−) | P=0.551 (−) | P=0.190 (−) |
| MCD vs. PIN | P=0.020
(MCD>PIN) | P=0.681 (−) | P=0.180 (−) | P=0.271 (−) |
GR relative mRNA expression was not significantly
associated (P=0.9) with LN disease activity (cut off <10 vs.
>10) nor with renal insufficiency severity (based on eGFR <20
ml/min/1.73 m2; P=0.9). No statistically significant
association was demonstrated between GR mRNA expression and
response to the treatment in the renal samples of LN, MCD and PIN
patients based on the definition of response for each group (as
described above in the Material and methods section). No difference
was observed between early responders and late responders in MCD
patients.
Expression of miR30a, miR24 and miR370
in pathological and normal renal samples
No significant differences were observed in the
miR30a expression between the patients' renal samples compared with
the ‘normal’ renal tissues of controls (Table IV; Fig. 1B). However, miR24 levels were
statistically significant lower in all pathological renal samples
(P=0.007 for LN; P=0.036 for MCD; and P=0.01 for PIN) compared with
the ‘normal’ tissues of the controls (Fig. 1C). By contrast, miR370 levels
presented significantly higher expression (P<0.0001) in all
pathological renal samples (P<0.0001 for LN; P<0.0001 for
MCD; and P<0.0001 for PIN) compared with the ‘normal’ tissues of
the controls (Fig. 1D). miRNA
expression did not differ when comparing the three groups of
patients with LN, MCD and PIN (Fig.
3B-D). None of the three analyzed miRNAs showed a statistically
significant association with the response to the treatment in LN,
MCD and PIN patients based on the defined criteria aforementioned
nor between early and late responders among patients with MCD.
However, miR24 expression was downregulated in all renal samples of
non-responders with LN, MCD and PIN compared with responders
although this was not statistically significant.
| Table IV.Associations between the expression
of GR and the miR30a, miR24 and miR370 in LN, MCD and PIN
patients. |
Table IV.
Associations between the expression
of GR and the miR30a, miR24 and miR370 in LN, MCD and PIN
patients.
|
| mRNA GR expression,
P-value, rs (95%CI) |
|---|
|
|
|
|---|
| Patients | miR30a | miR24 | miR370 |
|---|
| LN | 0.09,
rs=0.38 | 0.2,
rs=0.294 | 0.18,
rs=0.3208 |
|
|
(−0.08605–0.7127) |
(−0.1836–0,6602) | (−0.17–0.68) |
| MCD | 0.45,
rs=−0.2190 | 0.4,
rs=−0.2423 | 0.38,
rs=0.28 |
|
|
(−0.6715–0.3526 |
(−0.6940–0.3463) |
(−0.3328–0.7307) |
| PIN | 0.57,
rs=0.1447 | 0.99,
rs=−0,003699 | 0.56,
rs=0,1538 |
|
| (−0.3744 to
0.5948) |
(−0.4953–0.4897) |
(−0.3839–0.6136) |
Association of total GR expression
with miRNAs expression (miR30a, miR 24, miR370)
GR mRNA expression showed no statistically
significant association with the three miRNAs, although GR
expression in LN renal samples was positively associated with all
three miRNAs and negative in MCD renal samples except for miR370.
In PIN patients GR expression was positively associated with
miR30a and miR370 and negatively with miR24 (Table IV).
Discussion
Steroids remain the cornerstone of treatment in the
majority of renal disorders. Thus, the analysis of the GR
expression, or of the molecules regulating its expression, is of
importance for the understanding of the physiology of renal
disorders and especially of their prognosis. The data of the
present study demonstrated that GR mRNA and protein levels
were underexpressed in all pathological renal samples of patients
diagnosed with LN, MCD and PIN compared with ‘normal’ renal tissues
of controls. PIN samples presented the lowest GR mRNA and
protein expression comparing with LN and MCD samples. miR24 and
miR370 expression demonstrated statistically significant difference
in all pathological compared with ‘normal’ renal tissues whereas no
significant difference was found in the miR30a expression comparing
pathological with ‘normal’ renal tissues. GR expression was
not significantly associated either with LN disease activity score
or with eGFR or response to the treatment. miR24 was downregulated
in all non-responders compared with responders although this was
not statistically significant.
Similar results have been demonstrated in the PBMCs
of LN patients without any steroid therapy, where GR expression was
downregulated compared with controls (7). In the same study no differences were
observed in GR number between patients with resistance and those
who showed complete or partial remission after prednisone (1
mg/kg/day) administration as part of their routine therapy
(7). However there are also
contradictory results showing that GR levels in PBMCs of patients
with LN and not taking steroid therapy were significantly elevated
compared with healthy controls (21). In another study LN patients without
GC therapy and healthy controls had similar GR levels (22) and whole cell and nuclear GR levels,
as observed by western blot analysis in PBMCs, were similar between
LN patients and controls (23).
However, the GR-DNA binding was significantly reduced in LN
patients, further supporting the notion that LN is characterized by
GC hyposensitivity (24).
As to GR expression in MCD, it has been shown that
GR expression is higher in renal samples of controls compared with
MCD patients and in particularly in early responders (<4 weeks)
compared with late responders (>4 weeks) (15,16).
The results of the present study confirmed that GR expression was
significantly lower in MCD samples compared with controls. GR mRNA
expression has been inversely correlated with the time to complete
remission (16,25,26).
In another study, including 37 children with MCD and 12 patients
with focal segmental glomerulosclerosis, significant lower GR
expression was found in steroid-resistant patients in comparison
with early steroid responders, late steroid responders and controls
(15). In addition late responder
patients had lower GR expression and more frequent relapse or
steroid-dependent course of the disease (15). Glomerular GR was significantly
higher in all MCD compared with focal segmental glomerulosclerosis
renal samples of included patients (15). In the present study, however, GR
expression was not found to be statistically different between MCD
and LN or PIN samples.
GR expression also has been studied in several other
nephropathies. In IgA nephropathy, GR mRNA and protein expression
is significantly higher in the responders compared with the
non-responders (27). GR subtypes
α and β expression has been also studied in PBMC samples in
patients with focal segmental glomerulosclerosis and membranous
glomerulonephritis without demonstrating statistically significant
differences (9).
The functions of miRNAs are considered epigenetic
factors potentially implicated in the regulators of GR expression
(28). miR24 has been found to
enhance apoptosis (29,30). It has been also documented that
miR24 is a negative regulator of steroid 11β-hydroxylase (CYP11B1)
which transforms the metabolite 11 deoxycortisol (inactive) to
cortisol (active) and thus it may be involved in the availability
of glucocorticoids (31). In
vitro, it has been shown that miR24 can reduce paclitaxel
resistance in breast cancer cells (32) implying a role for miR24 in drug
resistance. miR24 levels are significantly reduced in patients with
membranous glomerulonephritis compared with controls as well as
with patients with focal segmental glomerulosclerosis (9). In the present study miR24 levels were
downregulated in all pathological samples of LN, MCD and PIN
patients compared with healthy controls.
By contrast, in the present study miR370 levels were
found significantly higher in all pathological renal samples
compared with healthy controls. Previous studies have shown that
miR370 levels are increased in healthy controls compared with
patients with nephrotic syndrome or membranous glomerulonephritis,
as well as in patients with membranous glomerulonephritis compared
with patients with focal segmental glomerulosclerosis (9,28).
Over-activation of miR370 has been verified in high glucose-treated
podocytes, while miR370 repression protects against high
glucose-induced apoptosis, cell membrane and DNA damage in
podocytes (28).
miR30a serves the role of transcriptional regulator
of renal development. Decreased levels of miR30a-5p in the
podocytes of Dicer knockout mice lead to podocyte apoptosis and
depletion (33,34). The miR30a negatively regulates the
expression of GRα in the podocyte. Suppression of miR30a can
improve steroid responsiveness in the injured podocytes (35). The miR30 is induced by GC treatment
that suggests negative-feedback modulation of GC responsiveness
(36). Overexpression of miR30a
has been found in drug-resistant cases implying that miR30a may
function as a suitable biomarker in the diagnose of drug resistance
and pathological type (37).
Most of the studies in the literature have clearly
demonstrated the significant reverse correlation between the
expression of GR and the response to the treatment (9,15,16).
Follow-up of cases reveals that most of late responder patients,
who had lower GR expression, had relapsing or steroid-dependent
course of the disease. By contrast, most of the early responder
patients, who had higher GCR expression, showed non-relapsing
course during period of follow-up (25). Unfortunately the small number of
our samples did not allow the clarification of the association of
GR and miRNAs expression with the response to the treatment.
The present study analyzed the expression of GR and
of three miRNAs in the renal tissues of patients with LN, MCD and
PIN compared with healthy controls. Although there are data in the
literature regarding GR expression in LN and MCD, to the best of
the authors' knowledge, this is the first study of GR expression in
PIN. Moreover, the present study confirmed the different expression
of GR among the different renal disease and especially the
different expression compared with the normal tissues. Thus, GR
expression appears to have potentially a key role to the
pathophysiology of the different renal diseases. On the other hand,
the small sample size did not allow more robust statistical
analysis especially regarding response to the treatment and this is
the main limitation of the present study. Thus, the role of GR and
especially of the miRNAs in the pathophysiology, the prognosis and
the response to the treatment of these renal diseases remains to be
further elucidated in larger studies.
Supplementary Material
Supporting Data
Acknowledgements
Not applicable.
Funding
Funding: No funding was received.
Availability of data and materials
The datasets used and/or analyzed during the current
study are available from the corresponding author on reasonable
request.
Authors' contributions
IB conceived the project and supervised the
manuscript. AA wrote the greatest part of the paper and performed
statistical analyses, AA, IK and SM created, analysed and organized
the databases with the clinical and the histopathological data and
confirmed the authenticity of all the raw data, GL and SS performed
the immunohistochemistry and evaluated the expression of GR in
glomeruli, MG performed the PCR, SM edited part of the paper and
contributed to gathering clinical data. All authors read and
approved the final manuscript.
Ethics approval and consent to
participate
The present study was conducted in accordance with
the ethical standards of the institutional research committee of
the General Laikon hospital and of the Medical School of National
and Kapodistrian University of Athens based on the Declaration of
Helsinki (approval no. 235, 03/04/2020). Patient consent was
obtained from all participants for participation in the study or
use of their tissue (or a parent/legal guardian in the case of
children under 18 and patients otherwise considered minors under
local legislation).
Patient consent for publication
Not applicable.
Competing interests
The authors declare that they have no competing
interests.
References
|
1
|
Yan K, Kudo A, Hirano H, Watanabe T,
Tasaka T, Kataoka S, Nakajima N, Nishibori Y, Shibata T, Kohsaka T,
et al: Subcellular localization of glucocorticoid receptor protein
in the human kidney glomerulus. Kidney Int. 56:65–73. 1999.
View Article : Google Scholar : PubMed/NCBI
|
|
2
|
Goodwin JE: Role of the glucocorticoid
receptor in glomerular disease. Am J Physiol Renal Physiol.
317:F133–F136. 2019. View Article : Google Scholar : PubMed/NCBI
|
|
3
|
Lu DF, Moon M, Lanning LD, McCarthy AM and
Smith RJH: Clinical features and outcomes of 98 children and adults
with dense deposit disease. Pediatr Nephrol. 27:773–781. 2012.
View Article : Google Scholar : PubMed/NCBI
|
|
4
|
Barrett CMF, Troxell ML, Larsen CP and
Houghton DC: Membranous glomerulonephritis with crescents. Int Urol
Nephrol. 46:963–971. 2014. View Article : Google Scholar : PubMed/NCBI
|
|
5
|
Sharmeen S, Cassol C and Kato H:
ANCA-associated necrotizing glomerulonephritis overlapping with
mesangial proliferative lupus nephritis refractory to
plasmapheresis, steroid pulse therapy, and a combination of
mycophenolate mofetil and rituximab. Case Rep Rheumatol.
2018:30768062018.PubMed/NCBI
|
|
6
|
Wu X, Zhang M, Huang X, Zhang L, Zeng C,
Zhang J, Liu Z and Tang Z: Therapeutic mechanism of glucocorticoids
on cellular crescent formation in patients with antiglomerular
basement membrane disease. Am J Med Sci. 354:145–151. 2017.
View Article : Google Scholar : PubMed/NCBI
|
|
7
|
Jiang L, Hindmarch CCT, Rogers M, Campbell
C, Waterfall C, Coghill J, Mathieson PW and Welsh GI: RNA
sequencing analysis of human podocytes reveals glucocorticoid
regulated gene networks targeting non-immune pathways. Sci Rep.
6:356712016. View Article : Google Scholar : PubMed/NCBI
|
|
8
|
Bazsó A, Szappanos Á, Rásonyi R, Nagy E,
Farkas A, Várnai B, Patócs A, Kiss E and Poór G: Polymorphisms of
human glucocorticoid receptor gene in systemic lupus erythematosus:
A single-centre result. Clin Rheumatol. 38:1979–1984. 2019.
View Article : Google Scholar : PubMed/NCBI
|
|
9
|
Rahbar Saadat Y, Hejazian SM,
Nariman-Saleh-Fam Z, Bastami M, Poursheikhani A, M Shoja M, Ardalan
M and Zununi Vahed S: Glucocorticoid receptors and their upstream
epigenetic regulators in adults with steroid-resistant nephrotic
syndrome. Biofactors. 46:995–1005. 2020. View Article : Google Scholar : PubMed/NCBI
|
|
10
|
Ponticelli C and Locatelli F:
Glucocorticoids in the treatment of glomerular diseases: Pitfalls
and pearls. Clin J Am Soc Nephrol. 13:815–822. 2018. View Article : Google Scholar : PubMed/NCBI
|
|
11
|
Evans RM: The steroid and thyroid hormone
receptor superfamily. Science. 240:889–895. 1988. View Article : Google Scholar : PubMed/NCBI
|
|
12
|
Zhou J and Cidlowski JA: The human
glucocorticoid receptor: One gene, multiple proteins and diverse
responses. Steroids. 70:407–417. 2005. View Article : Google Scholar : PubMed/NCBI
|
|
13
|
De Bosscher K, Vanden Berghe W and
Haegeman G: The interplay between the glucocorticoid receptor and
nuclear factor-kappaB or activator protein-1: Molecular mechanisms
for gene repression. Endocr Rev. 24:488–522. 2003. View Article : Google Scholar : PubMed/NCBI
|
|
14
|
Wilkenfeld SR, Lin C and Frigo DE:
Communication between genomic and non-genomic signaling events
coordinate steroid hormone actions. Steroids. 133:2–7. 2018.
View Article : Google Scholar : PubMed/NCBI
|
|
15
|
Gamal Y, Badawy A, Swelam S, Tawfeek MSK
and Gad EF: Glomerular glucocorticoid receptors expression and
clinicopathological types of childhood nephrotic syndrome. Fetal
Pediatr Pathol. 36:16–26. 2017. View Article : Google Scholar : PubMed/NCBI
|
|
16
|
Han SH, Park SY, Li JJ, Kwak SJ, Jung DS,
Choi HY, Lee JE, Moon SJ, Kim DK, Han DS and Kang SW: Glomerular
glucocorticoid receptor expression is reduced in late responders to
steroids in adult-onset minimal change disease. Nephrol Dial
Transplant. 23:169–175. 2008. View Article : Google Scholar : PubMed/NCBI
|
|
17
|
Wang H, Gou X, Jiang T and Ouyang J: The
effects of microRNAs on glucocorticoid responsiveness. J Cancer Res
Clin Oncol. 143:1005–1011. 2017. View Article : Google Scholar : PubMed/NCBI
|
|
18
|
Clayton SA, Jones SW, Kurowska-Stolarska M
and Clark AR: The role of microRNAs in glucocorticoid action. J
Biol Chem. 293:1865–1874. 2018. View Article : Google Scholar : PubMed/NCBI
|
|
19
|
Kidney Disease: Improving Global Outcomes
(KDIGO) Glomerular Diseases Work Group: KDIGO 2021 clinical
practice guideline for the management of glomerular diseases.
Kidney Int. 100((4S)): S1–S276. 2021.PubMed/NCBI
|
|
20
|
Livak KJ and Schmittgen TD: Analysis of
relative gene expression data using real-time quantitative PCR and
the 2(−Delta Delta C(T)) method. Methods. 25:402–408. 2001.
View Article : Google Scholar : PubMed/NCBI
|
|
21
|
Gladman DD, Urowitz MB, Doris F,
Lewandowski K and Anhorn K: Glucocorticoid receptors in systemic
lupus erythematosus. J Rheumatol. 18:681–684. 1991.PubMed/NCBI
|
|
22
|
Oshima H: Studies on the glucocorticoid
receptor in human peripheral lymphocytes. II. Regulation by
glucocorticoid. Nihon Naibunpi Gakkai Zasshi. 62:1298–1305.
1986.(In Japanese). PubMed/NCBI
|
|
23
|
Oikonomidou O, Vlachoyiannopoulos PG,
Kominakis A, Kalofoutis A, Moutsopoulos HM and Moutsatsou P:
Glucocorticoid receptor, nuclear factor kappaB, activator protein-1
and C-jun N-terminal kinase in systemic lupus erythematosus
patients. Neuroimmunomodulation. 13:194–204. 2006. View Article : Google Scholar : PubMed/NCBI
|
|
24
|
Kino T, De Martino MU, Charmandari E,
Mirani M and Chrousos GP: Tissue glucocorticoid
resistance/hypersensitivity syndromes. J Steroid Biochem Mol Biol.
85:457–467. 2003. View Article : Google Scholar : PubMed/NCBI
|
|
25
|
Zahran AM, Aly SS, Elsayh KI, Badawy A and
Gamal Y: Glucocorticoid receptors expression and histopathological
types in children with nephrotic syndrome. Ren Fail. 36:1067–1072.
2014. View Article : Google Scholar : PubMed/NCBI
|
|
26
|
Shalaby SA, El Idrissy HM, Safar RA and
Hussein ST: Glucocorticoid receptors and the pattern of steroid
response in idiopathic nephrotic syndrome. Arab J Nephrol
Transplant. 5:13–17. 2012.PubMed/NCBI
|
|
27
|
Kee YK, Nam BY, Jhee JH, Park JT, Lim BJ,
Yoo TH, Kang SW, Jeong HJ and Han SH: The association of glomerular
glucocorticoid receptor expression with responsiveness to
corticosteroid treatment in IgA nephropathy. Am J Nephrol.
50:187–195. 2019. View Article : Google Scholar : PubMed/NCBI
|
|
28
|
Xian Y, Dong L, Jia Y, Lin Y, Jiao W and
Wang Y: miR-370 promotes high glucose-induced podocyte injuries by
inhibiting angiotensin II type 1 receptor-associated protein. Cell
Biol Int. 42:1545–1555. 2018. View Article : Google Scholar : PubMed/NCBI
|
|
29
|
Lal A, Pan Y, Navarro F, Dykxhoorn DM,
Moreau L, Meire E, Bentwich Z, Lieberman J and Chowdhury D:
miR-24-mediated downregulation of H2AX suppresses DNA repair in
terminally differentiated blood cells. Nat Struct Mol Biol.
16:492–498. 2009. View Article : Google Scholar : PubMed/NCBI
|
|
30
|
Manvati S, Mangalhara KC, Kalaiarasan P,
Srivastava N and Bamezai RNK: miR-24-2 regulates genes in survival
pathway and demonstrates potential in reducing cellular viability
in combination with docetaxel. Gene. 567:217–224. 2015. View Article : Google Scholar : PubMed/NCBI
|
|
31
|
Robertson S, MacKenzie SM, Alvarez-Madrazo
S, Diver LA, Lin J, Stewart PM, Fraser R, Connell JM and Davies E:
MicroRNA-24 is a novel regulator of aldosterone and cortisol
production in the human adrenal cortex. Hypertension. 62:572–578.
2013. View Article : Google Scholar : PubMed/NCBI
|
|
32
|
Gong JP, Yang L, Tang JW, Sun P, Hu Q, Qin
JW, Xu XM, Sun BC and Tang JH: Overexpression of microRNA-24
increases the sensitivity to paclitaxel in drug-resistant breast
carcinoma cell lines via targeting ABCB9. Oncol Lett. 12:3905–3911.
2016. View Article : Google Scholar : PubMed/NCBI
|
|
33
|
Ho J, Ng KH, Rosen S, Dostal A, Gregory RI
and Kreidberg JA: Podocyte-specific loss of functional microRNAs
leads to rapid glomerular and tubular injury. J Am Soc Nephrol.
19:2069–2075. 2008. View Article : Google Scholar : PubMed/NCBI
|
|
34
|
Shi S, Yu L, Chiu C, Sun Y, Chen J,
Khitrov G, Merkenschlager M, Holzman LB, Zhang W, Mundel P and
Bottinger EP: Podocyte-selective deletion of dicer induces
proteinuria and glomerulosclerosis. J Am Soc Nephrol. 19:2159–2169.
2008. View Article : Google Scholar : PubMed/NCBI
|
|
35
|
Dhandapani MC, Venkatesan V, Rengaswamy
NB, Gowrishankar K, Nageswaran P and Perumal V: Association of ACE
and MDR1 gene polymorphisms with steroid resistance in children
with idiopathic nephrotic syndrome. Genet Test Mol Biomarkers.
19:454–456. 2015. View Article : Google Scholar : PubMed/NCBI
|
|
36
|
Yu-Shengyou and Li Y: Dexamethasone
inhibits podocyte apoptosis by stabilizing the PI3K/Akt signal
pathway. Biomed Res Int. 2013:3269862013. View Article : Google Scholar : PubMed/NCBI
|
|
37
|
Teng J, Sun F, Yu PF, Li JX, Yuan D, Chang
J and Lin SH: Differential microRNA expression in the serum of
patients with nephrotic syndrome and clinical correlation analysis.
Int J Clin Exp Pathol. 8:7282–7286. 2015.PubMed/NCBI
|