Introduction
Breast cancer is caused by unregulated cell
proliferation. Breast cancer is the most common cancer in women
globally (1), however, breast
cancer can also occur in men. Triple negative breast cancer (TNBC)
constitutes 10–20% of all breast cancer cases. TNBC is distinct
from other subtypes of breast cancer and is characterized by the
absence of estrogen receptor (ER), progesterone receptor (PR) and
human epidermal growth factor receptor 2 (HER2) (2). Patients with TNBC often exhibit early
relapse and distant metastases, including those affecting the liver
and central nervous system (3).
There are often aggressive clinical features in patients with TNBC,
including high tumor grade and mitotic indices with poor prognosis
(4). The 5-year survival rate for
patients with metastatic TNBC is 30% (5). Traditional treatment methods,
including surgery, radiation therapy and chemotherapy are used in
TNBC treatment, but the options are limited owing to the absence of
molecular targets, in particular HER2 because it is a key target
for targeted therapies (6).
Currently, TNBC remains a challenge in breast cancer research and
clinical practice.
The tumor microenvironment (TME) is composed of
immune and stromal cells, blood vessels and extracellular matrix
(7). CD8+ T cells, a
type of cytotoxic T lymphocyte (CTL) are a component in TME that
serve a role in immune surveillance against cancer through the
recognition of tumor-specific antigens on the surface of cancer
cells (8). Higher CD8+
T cell scores often indicate better survival in TNBC (9). In a number of patients with TNBC, the
density of CD8+ T cell infiltration is not uniformly
distributed. There is a notable pattern where density diminishes
from the periphery towards the interior of the tumor cell clusters,
with a rise again in the center of tumor (10). This phenomenon is explained by two
hypotheses: Physical barrier hypothesis which suggests that the
physical structure of TME, such as the extracellular matrix (ECM)
fibers, creates a barrier that impedes the migration of
CD8+ T cells into tumor cell clusters (11) and the biochemical barrier
hypothesis which proposes that certain chemical factors or signals
within TME may actively repel CD8+ T cells, preventing
their infiltration into tumor cell clusters (12). CD8+ T lymphocytes serve
a role in immunotherapy due to their responses to immune checkpoint
inhibitors including programmed cell death-1 (PD-1) inhibitors
(13). Significantly improved
clinical outcomes are observed in patients with TNBC treated with
checkpoint inhibitors; this is associated with a tissue-resident
memory CD8+ T cell gene signature, extracted from
tumor-free tissue (14). Exposure
to carcinogens like 12-dimethylbenz[a]anthracene (DMBA) triggers an
immune response in breast cancer cells, resulting in the production
of immune-activating factors such as CCL21. This chemokine enhances
the infiltration and activity of CD8+ T cells, which in
turn, suppress the metastasis of breast cancer by recognizing and
eliminating cancer cells that attempt to spread (15).
The aim of the present study was to identify the hub
genes associated with CD8+ T cells that serve a role in
the pathology of TNBC. This knowledge can be applied to the
development of targeted immunotherapy approaches with the potential
to improve treatment efficacy and patient outcomes, and further
contribute to understanding of the immunological dynamics within
this aggressive subtype.
Materials and methods
Research objects
mRNA expression data and corresponding clinical
information of patients with BC were downloaded from three public
databases by searching the key words ‘triple negative breast
cancer’ or ‘TNBC’. The inclusion criteria for samples from datasets
were as follows: i) Human TNBC samples; and ii) tumor sample size
or normal sample size was ≥10. Samples missing survival information
were excluded. The detailed information of all datasets were
summarized as follows. Samples that tested negative for ER, PR and
HER2 were selected from The Cancer Genome Atlas (TCGA;
tcga-data.nci.nih.gov/tcga/) resulting 122 TNBC samples. The
samples from Molecular Taxonomy of Breast Cancer International
Consortium (METABRIC) database were downloaded using cBioPortal
tool (cbioportal.org/). Patients with negative ‘ER_IHC’,
‘HISTOLOGICAL_SUBTYPE’ of ‘Ductal/NST’ and ‘HER2_SNP6’ no ‘Gain’
were selected from the ‘Clinical Data’ file. Samples with negative
ER, PR and HER2 status and ‘BREAST_CANCER_TYPE_DETAILED’ of ‘Breast
Invasive Ductal Carcinoma’ were selected from the ‘sample’ file,
resulting in 199 TNBC samples. Furthermore, from the Gene
Expression Omnibus (GEO) database (ncbi.nlm.nih.gov/geo/), the
following TNBC datasets were also obtained, including
inclusion/exclusion criteria cited in the references: GSE76250
(16); GSE38959 (17); GSE21653 (18); GSE31448 (19); GSE69031 (20); GSE45255 (21); GSE135565 (22) and GSE65194 (23) (Table
I).
 | Table I.GEO datasets. |
Table I.
GEO datasets.
| Dataset | TNBC samples | Normal tissue
samples | Total breast cancer
samples |
|---|
| GSE76250 | 165 | 33 | - |
| GSE38959 | 30 | 13 | - |
| GSE21653 | 237 | 29 | - |
| GSE31448 | 263 | 31 | - |
| GSE69031 | 19 | - | 130 |
| GSE45255 | 19 | - | 139 |
| GSE65194 | 41 | 11 | 153 |
| GSE135565 | 84 | - | - |
Tumor IMmune Estimation Resource database
(cistrome.shinyapps.io/timer/) was used to assess expression of
target gene in numerous types of cancers.
Weighted gene co-expression network
analysis (WGCNA)
WGCNA was performed using the ‘WGCNA’ R package
(version 1.69) (24) based on gene
expression values. The top 25% of genes were selected for WGCNA
using variance analysis. Pearson correlation coefficients were
calculated and an appropriate soft threshold (β) was applied by
criteria of R2≥0.9 to ensure the constructed network met
the scale-free network standard. A network was constructed using a
one-step method and the adjacency matrix was transformed into a
topological overlap matrix. A gene hierarchical clustering tree was
generated using hierarchical clustering. Gene and module
significance (P<0.05) were calculated to determine the
significance of genes and clinical information (P<0.05),
respectively. Heatmap was drawn based on ‘pheatmap’ package
(https://cran.r-project.org/web/packages/pheatmap/;
Version:1.0.12). Finally, key gene modules were identified by
calculating correlation between modules and CD8+ T cell
scores.
Differential gene expression analysis
and functional enrichment analysis
The ‘limma’ package (25) was used to identify differentially
expressed genes (DEGs) using cut off values of Log2 fold
change absolute >0.5 and P<0.05. To identify biological
processes and pathways enriched with DEGs, enrichment analysis was
performed using the ‘clusterProfiler’ function package (26) in R. Gene Ontology (GO, http://geneontology.org/docs/ontology-documentation/)
and Kyoto Encyclopedia of Genes and Genomes (KEGG, http://www.kegg.jp/) were used as primary sources of
functional annotation and GO terms including biological process
(BP), molecular function (MF) and cellular component (CC) and KEGG
pathways with a statistically significant enrichment cutoff of
P<0.05. Gene set enrichment analysis (GSEA) was used to identify
pathways differentially regulated between high and low gene
expression groups, defined based on the median of the expression of
the target gene. Pathways with P<0.05 were considered
significantly enriched.
Protein-protein interaction (PPI)
network
Search Tool for the Retrieval of Interacting
Genes/Proteins (STRING) database (27) (version 11.0, string-db.org/) was
used to analyze and predict functional connections and interactions
of proteins. PPI network of candidate genes was constructed and
interaction pairs were filtered by default minimum required
interaction score >0.4. Cytoscape software version 3.7.2
(28) was used to visualize the
PPI network and the top 50 genes were selected using the maximum
neighborhood component method with the cytoHubba plugin (29) (version 0.1).
Survival analysis
In survival analysis the datasets GSE69031,
GSE45255, GSE135565, and GSE65194 were merged after the batch
effects had been removed using the ComBat function from the R
package ‘sva’. Subsequently, R packages ‘survival’
(CRAN.R-project.org/package=survival) and ‘survminer’ (https://cran.r-project.org/web/packages/survminer/)
were used to estimate the overall survival (OS) rates based on the
Kaplan-Meier (KM) method. The log-rank test was performed to
determine the significance of differences in survival rate. A
multivariate Cox regression model was used to determine the
independent prognostic factors for TNBC.
Immune landscape analysis
Cell-type Identification By Estimating Relative
Subsets Of RNA Transcripts (CIBERSORT) (30) was used to calculate relative
proportion of 22 types of immune cell in the TNBC samples from
METABRIC database. The CIBERSORT software uses a deconvolution
algorithm with 547 barcode genes to characterize the composition of
immune cell infiltration based on the gene expression matrix. The
sum of all estimated proportions of immune cell types in each
sample equaled 1. xCell (xcell.ucsf.edu/, version 3.8) and Tumor-immune system
interactions and drug bank database (TISIDB, cis.hku.hk/TISIDB/) tools were also used to calculate
the abundance of immune cells.
Cell culture
A human normal breast epithelial cell line MCF10A
and two human TNBC cell lines, MDA-MB-231 and MDA-MB-453, were
purchased from Procell Life Science & Technology Co., Ltd. The
cell lines were cultured following the methods described previously
(31).
Reverse transcription-quantitative PCR
(RT-qPCR)
Total RNA was extracted from MCF10A, MDA-MB-231 and
MDA-MB-453 cells by TRNzol Universal Total RNA Extraction Reagent
(cat. no. DP424; Tiangen Biotech Co., Ltd.). RT-qPCR was performed
as previously described (31).
GAPDH served as the internal reference gene. Primer sequences are
shown in Table II. RT-qPCR was
performed in three biological replicates and three technical
replicates.
| Table II.Primer sequences for quantitative
PCR. |
Table II.
Primer sequences for quantitative
PCR.
| Gene | Sequence,
5′à3′ | Length, bp | RefSeq | Product length,
bp | Location |
|---|
| KCTD5 | F:
GGAGCTGCTGGGATTCCTTT | 20 | NM_018992 | 168 | 6th KCTD5 exon
1773–1792 |
|
| R:
GTCAGTCTGCACAGTACCCC | 20 |
|
| 6th KCTD5 exon
1921–1904 |
| GAPDH | F:
GAAGGTGAAGGTCGGAGTC | 19 | NM_001357943.2 | 172 | 2nd GAPDH exon
82–100 |
|
| R:
GAAGATGGTGATGGGATTTC | 20 |
|
| 4th GAPDH exon
253–234 |
|
|
|
| NM_001289745.3 | 226 | 2nd GAPDH exon
174–192 |
|
|
|
|
|
| 4th GAPDH exon
399–380 |
|
|
|
| NM_001289746.2 | 226 | 1st GAPDH exon
322–340 |
|
|
|
|
|
| 3rd GAPDH exon
547–528 |
|
|
|
| NM_002046.7 | 226 | 2nd GAPDH exon
82–100 |
|
|
|
|
|
| 4th GAPDH exon
307–288 |
Western blotting (WB)
WB was performed as described in a previous study
(32). Primary antibodies against
potassium channel tetramerization domain 5 (KCTD5; 1:1,000, cat.
no. ab194825; Abcam) and secondary goat anti-rabbit IgG (H+L)
antibodies conjugated with horseradish peroxidase (HRP; 1:10,000;
cat. no. ZB-2301; OriGene Technologies, Inc.) were used. GAPDH was
used as a loading control with primary (1:50,000; cat. no.
60004-1-Ig; Proteintech Group, Inc.) and secondary HRP-labeled goat
anti-mouse IgG (H+L) antibodies (1:10,000; cat. no. ZB-2305;
OriGene Technologies, Inc.). Finally, band intensities were
analyzed using Image J software (imagej.en.softonic.com/, version
1.6.0). WB experiment was performed in three biological
replicates.
Transfection
Short interfering (si)RNAs targeting KCTD5 and
negative control (NC) were purchased from Guangzhou RiboBio Co.,
Ltd. (Table III). In a 6-well
plate, 5×10⁵ MDA-MB-231 cells were cultured overnight at
37°C. Transfection was performed using Lipofectamine™ 3000 (cat.
no. 2343152, Invitrogen; Thermo Fisher Scientific, Inc.) according
to the manufacturer's instructions. The cells were incubated for 48
h at 37°C and 5% CO2. Transfection was performed in
three biological replicates.
| Table III.siRNA sequences. |
Table III.
siRNA sequences.
| siRNA | Sequence,
5′à3′ |
|---|
| siRNA1 | T:
GAACGAGACAGCAAAACAT |
|
| S:
GAACGAGACAGCAAAACAU |
|
| A:
AUGUUUUGCUGUCUCGUUC |
| siRNA2 | T:
AGCATCGGCTCCTCTTACA |
|
| S:
AGCAUCGGCUCCUCUUACA |
|
| A:
UGUAAGAGGAGCCGAUGCU |
| siRNA3 | T:
GTTGGAGGAAGCAGAATTT |
|
| S:
GUUGGAGGAAGCAGAAUUU |
|
| A:
AAAUUCUGCUUCCUCCAAC |
| si-NC | T:
ACGGAGGCTAAGCGTCGCAA |
|
| S:
ACGGAGGCUAAGCGUCGCAA |
|
| A:
UUGCGACGCUUAGCCUCCGU |
Wound healing assay
The migratory capacity of the MDA-MB-231 cell line
was assessed using a wound healing assay. A total of
5×10⁵ Cells were cultured in high-glucose Dulbecco's
Modified Eagle Medium (DMEM, PM150210, Procell) supplemented with
1% Penicillin/Streptomycin (P/S, 164210, Procell) and 10% Fetal
Bovine Serum (FBS, 164210, Procell). Once the cells reached
approximately 90% confluence, a standardized wound was created by
scratching the cell monolayer with a pipette tip, ensuring that the
tip was perpendicular to the ruler behind the culture dish to
maintain a consistent angle and avoid tilting.
After scratching, the cells were gently washed three
times with Phosphate-Buffered Saline (PBS) to remove detached cells
and debris, followed by the addition of serum-free medium to
facilitate cell migration without proliferation. The cultures were
then placed in a 37°C incubator with 5% CO2 to maintain
optimal growth conditions.
At 0 and 48 h post-wounding, images of the wound
area were captured using an inverted fluorescence microscope
(IMT-2; Olympus) with a 10× magnification. The wound healing rate
was quantified by measuring the wound area at both time points
using ImageJ software. The healing ratio was calculated as the
difference in wound area between 0 and 48 h divided by the wound
area at time zero, expressed as a percentage. Wound healing assay
was performed in three biological replicates and three random
fields of view were photographed for each sample.
Cell Counting Kit-8 (CCK-8) assay
After 24 h cell culture at 37°C, 100 µl cell
suspension was added to each well of a 96-well plate at a cell
density of 5,000 cells/well. The cells were cultured at 37°C and 5%
CO2 for 24 h. A total of 10 µl CCK-8 solution (C0037,
Beyotime Biotech Inc., Shanghai, China) was added to each well and
incubated for 1 h before measuring optical density at 450 nm. CCK-8
assay was conducted in three technical replicates.
Transwell assay
For the migration assay, 600 µl high-glucose DMEM
(PM150210, Procell) supplemented with 1% P/S (164210, Procell) and
10% FBS (164210, Procell)) was added to the lower chamber. In the
upper chamber, 1×10⁴ cells/well in 100 µl cell
suspension was added. The Transwell inserts used were 8.0 µm
polycarbonate membranes with a disposable cell culture insert
(TCS020006, Guangzhou JET Bio-filtration Co., Ltd., Guangzhou,
China). The upper chamber was filled with DMEM containing 0.1% FBS,
while the lower chamber was filled with DMEM supplemented with 10%
FBS. After 48 h at 37°C, cells were fixed with 4% paraformaldehyde
for 30 min at room temperature. After removing the non-migratory
cells from surface, the cells were stained with 0.1% crystal violet
for 1 h at room temperature and then rinsed with PBS (P1020,
Beijing Solarbio Science & Technology Co., Ltd., Beijing,
China). Transwell chambers were then air-dried and images were
captured using a fluorescence microscope (IMT-2, Olympus).
For the invasion assay, Matrigel (cat. no. 356234;
Corning Life Sciences, Inc.) was in moved from −20°C to a 4°C
refrigerator overnight. The Matrigel was diluted on ice with DMEM
to a concentration of 300 µg/ml and evenly applied to the surface
of the Transwell inserts at 37°C for 2 h to allow the Matrigel to
solidify. The subsequent protocol was the same to the migration
assay. For the Transwell migration and invasion assays, triplicate
biological repeats were conducted, and during image acquisition,
three random fields of view were photographed for each sample.
Statistical analysis
All statistical analyses were performed in R
(version 4.2.1). Data are presented as the mean ± SEM of three
independent experimental repeats; all experimental data were
analyzed using GraphPad Prism 6 (Dotmatics). Comparisons two groups
were performed using unpaired t-test, while comparisons between
multiple groups were conducted using ANOVA with Bonferroni's post
hoc test. Wilcoxon rank-sum test was used to compare gene
expression and immune cell infiltration. The ‘cor’ function was
used to perform Pearson correlation analysis. P<0.05 was
considered to indicate a statistically significant difference.
Results
Seven CD8+ T
cell-associated gene modules were screened by WGCNA
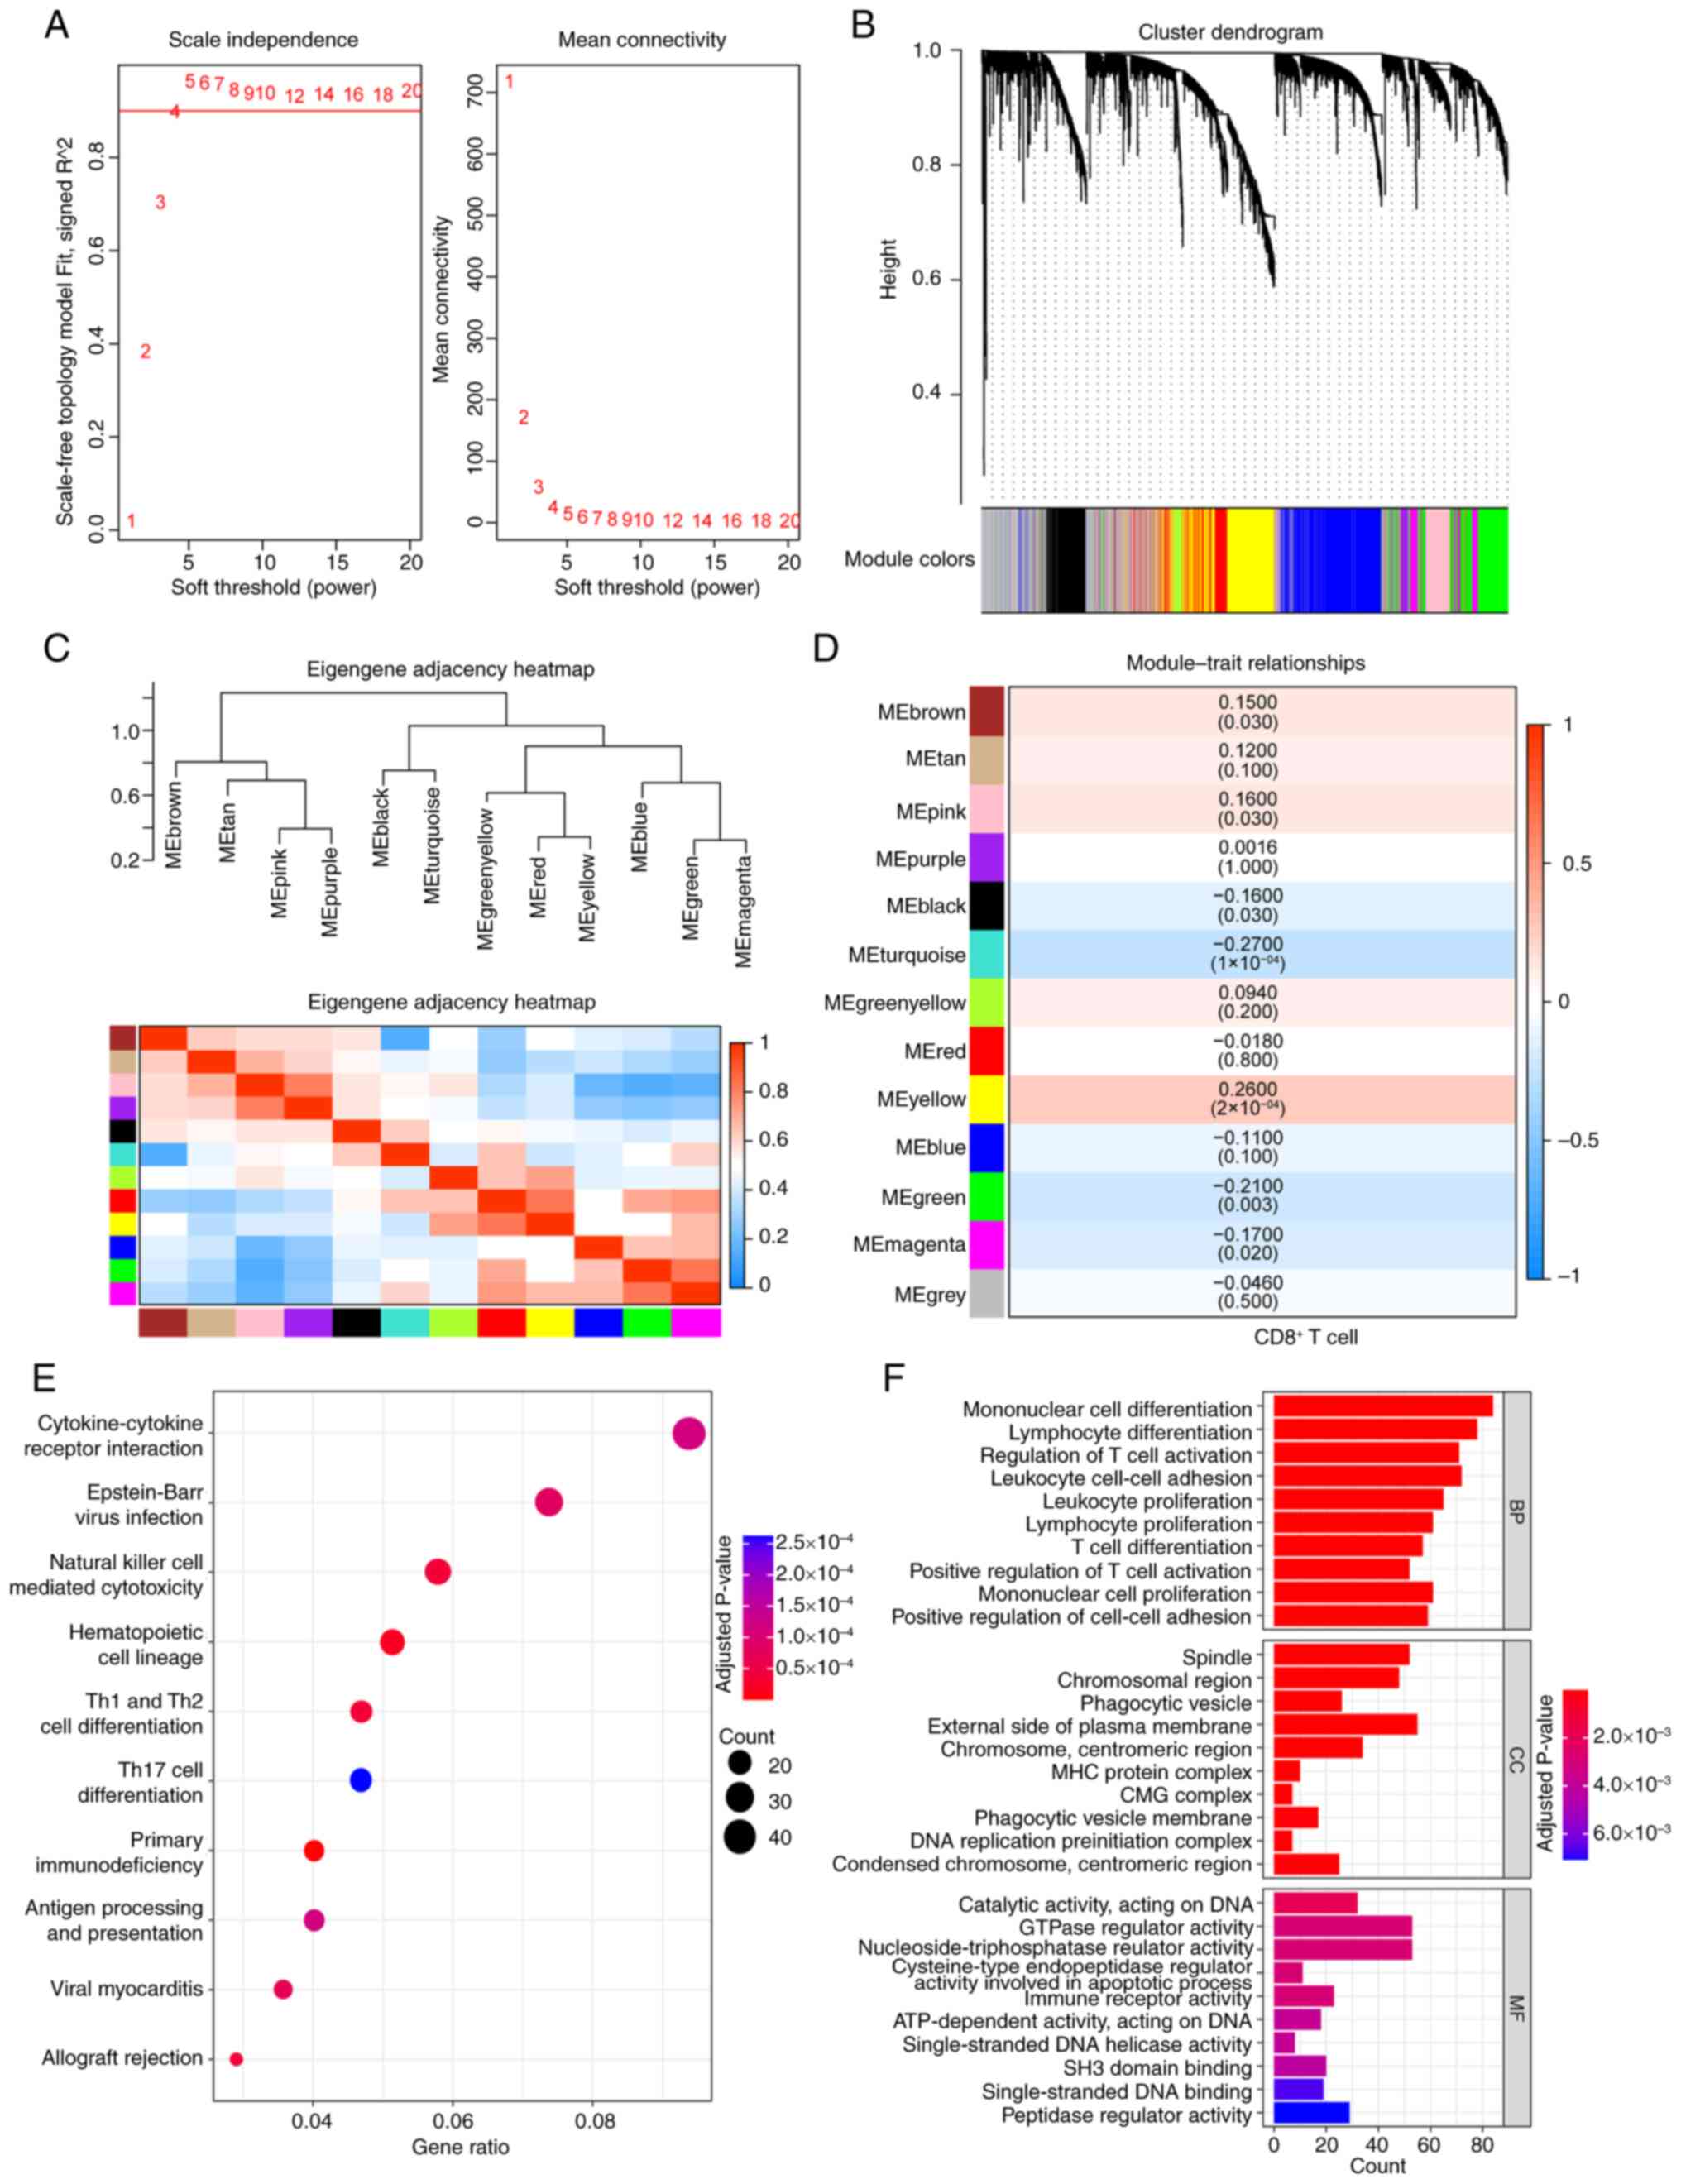
WGCNA analysis was conducted on TNBC samples from
METABRIC database, using a soft thresholding value of β=4 (Fig. 1A) to construct a gene network,
which yielded 13 gene modules (Fig.
1B). The CIBERSORT was used to estimate infiltration ratios of
22 types of immune cells in the TNBC samples and CD8+ T
cell scores from each sample were selected as the trait data for
WGCNA. The association between gene module and CD8+ T
cell scores was calculated (Fig. 1C
and D) and seven gene modules [yellow (cor=0.26), green
(cor=−0.21), magenta (cor=−0.17), turquoise (cor=−0.27), black
(cor=−0.16), pink (cor=0.16) and brown (cor=0.15)] were
significantly related to CD8+ T cell. These modules
comprised a total of 2,815 genes, which were considered
CD8+ T cell-related genes in TNBC. GO and KEGG
enrichment analyses were performed on these genes and 36
significantly enriched KEGG pathways, 622 significantly enriched
BP, 25 MF and 45 CC terms were identified. The top 10 significantly
enriched KEGG pathways and the top 10 significantly enriched GO
terms are shown in Fig. 1E and F,
respectively. The detailed results are presented in Table SI.
CD8+ T cell-associated
KCTD5 is significantly upregulated in TNBC and associated with poor
prognosis
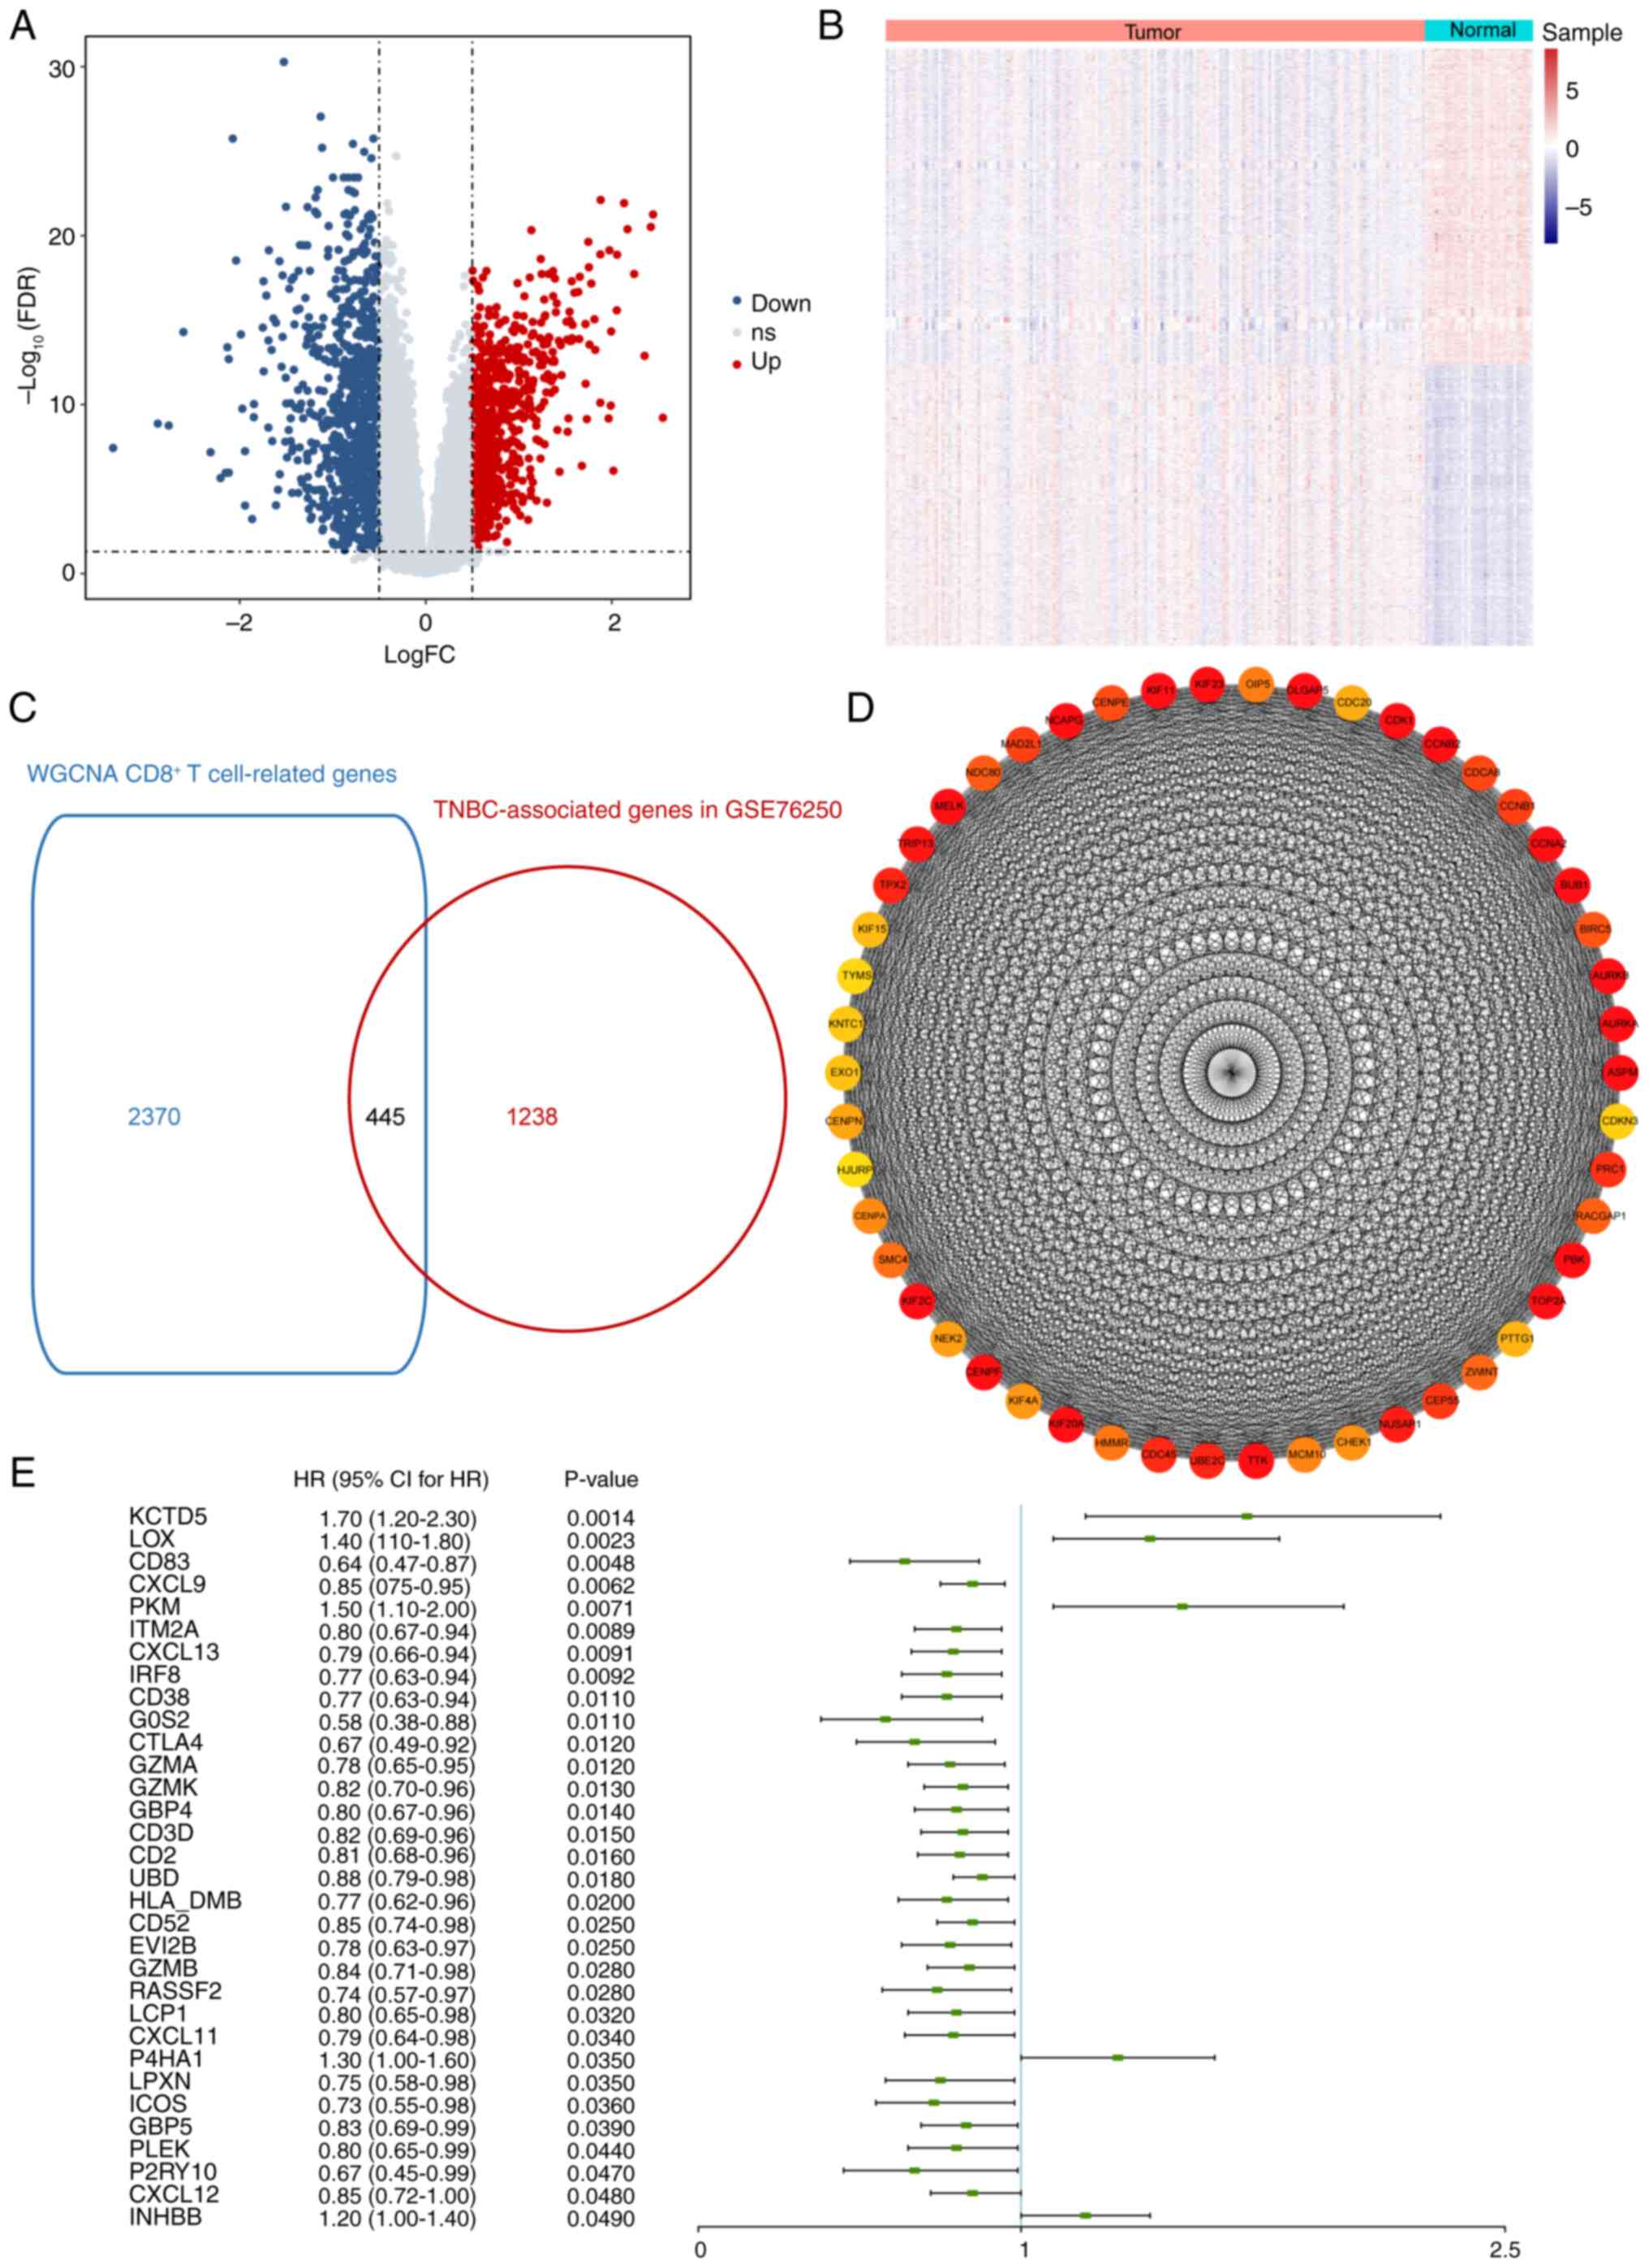
Differential gene expression analysis was performed
using the GSE76250 dataset. Compared with normal samples, 1,683
DEGs were identified in TNBC samples including 791 up- and 892
downregulated genes (Fig. 2A and
B). A cross analysis between the aforementioned 1,683 DEGs and
2,815 CD8+ T cell-associated genes from the WGCNA was
conducted, resulting in 445 CD8+ T cell-associated genes
with aberrant expression in TNBC (Fig.
2C; Table SII). PPI network
from the 445 candidate genes was constructed and interaction pairs
were filtered based on STRING database. PPI network was visualized
and the top 50 genes were selected (Fig. 2D).
Univariate Cox regression analysis was performed on
445 candidate genes and the hazard ratio was calculated. Among all
the candidate genes identified as significant variables
(P<0.05), KCTD5 demonstrated the highest significance and was
selected as the target gene for subsequent assessment (Fig. 2E). KCTD5 was categorized in the
yellow module (Table SI), which
was positively correlated with CD8+ T cell levels.
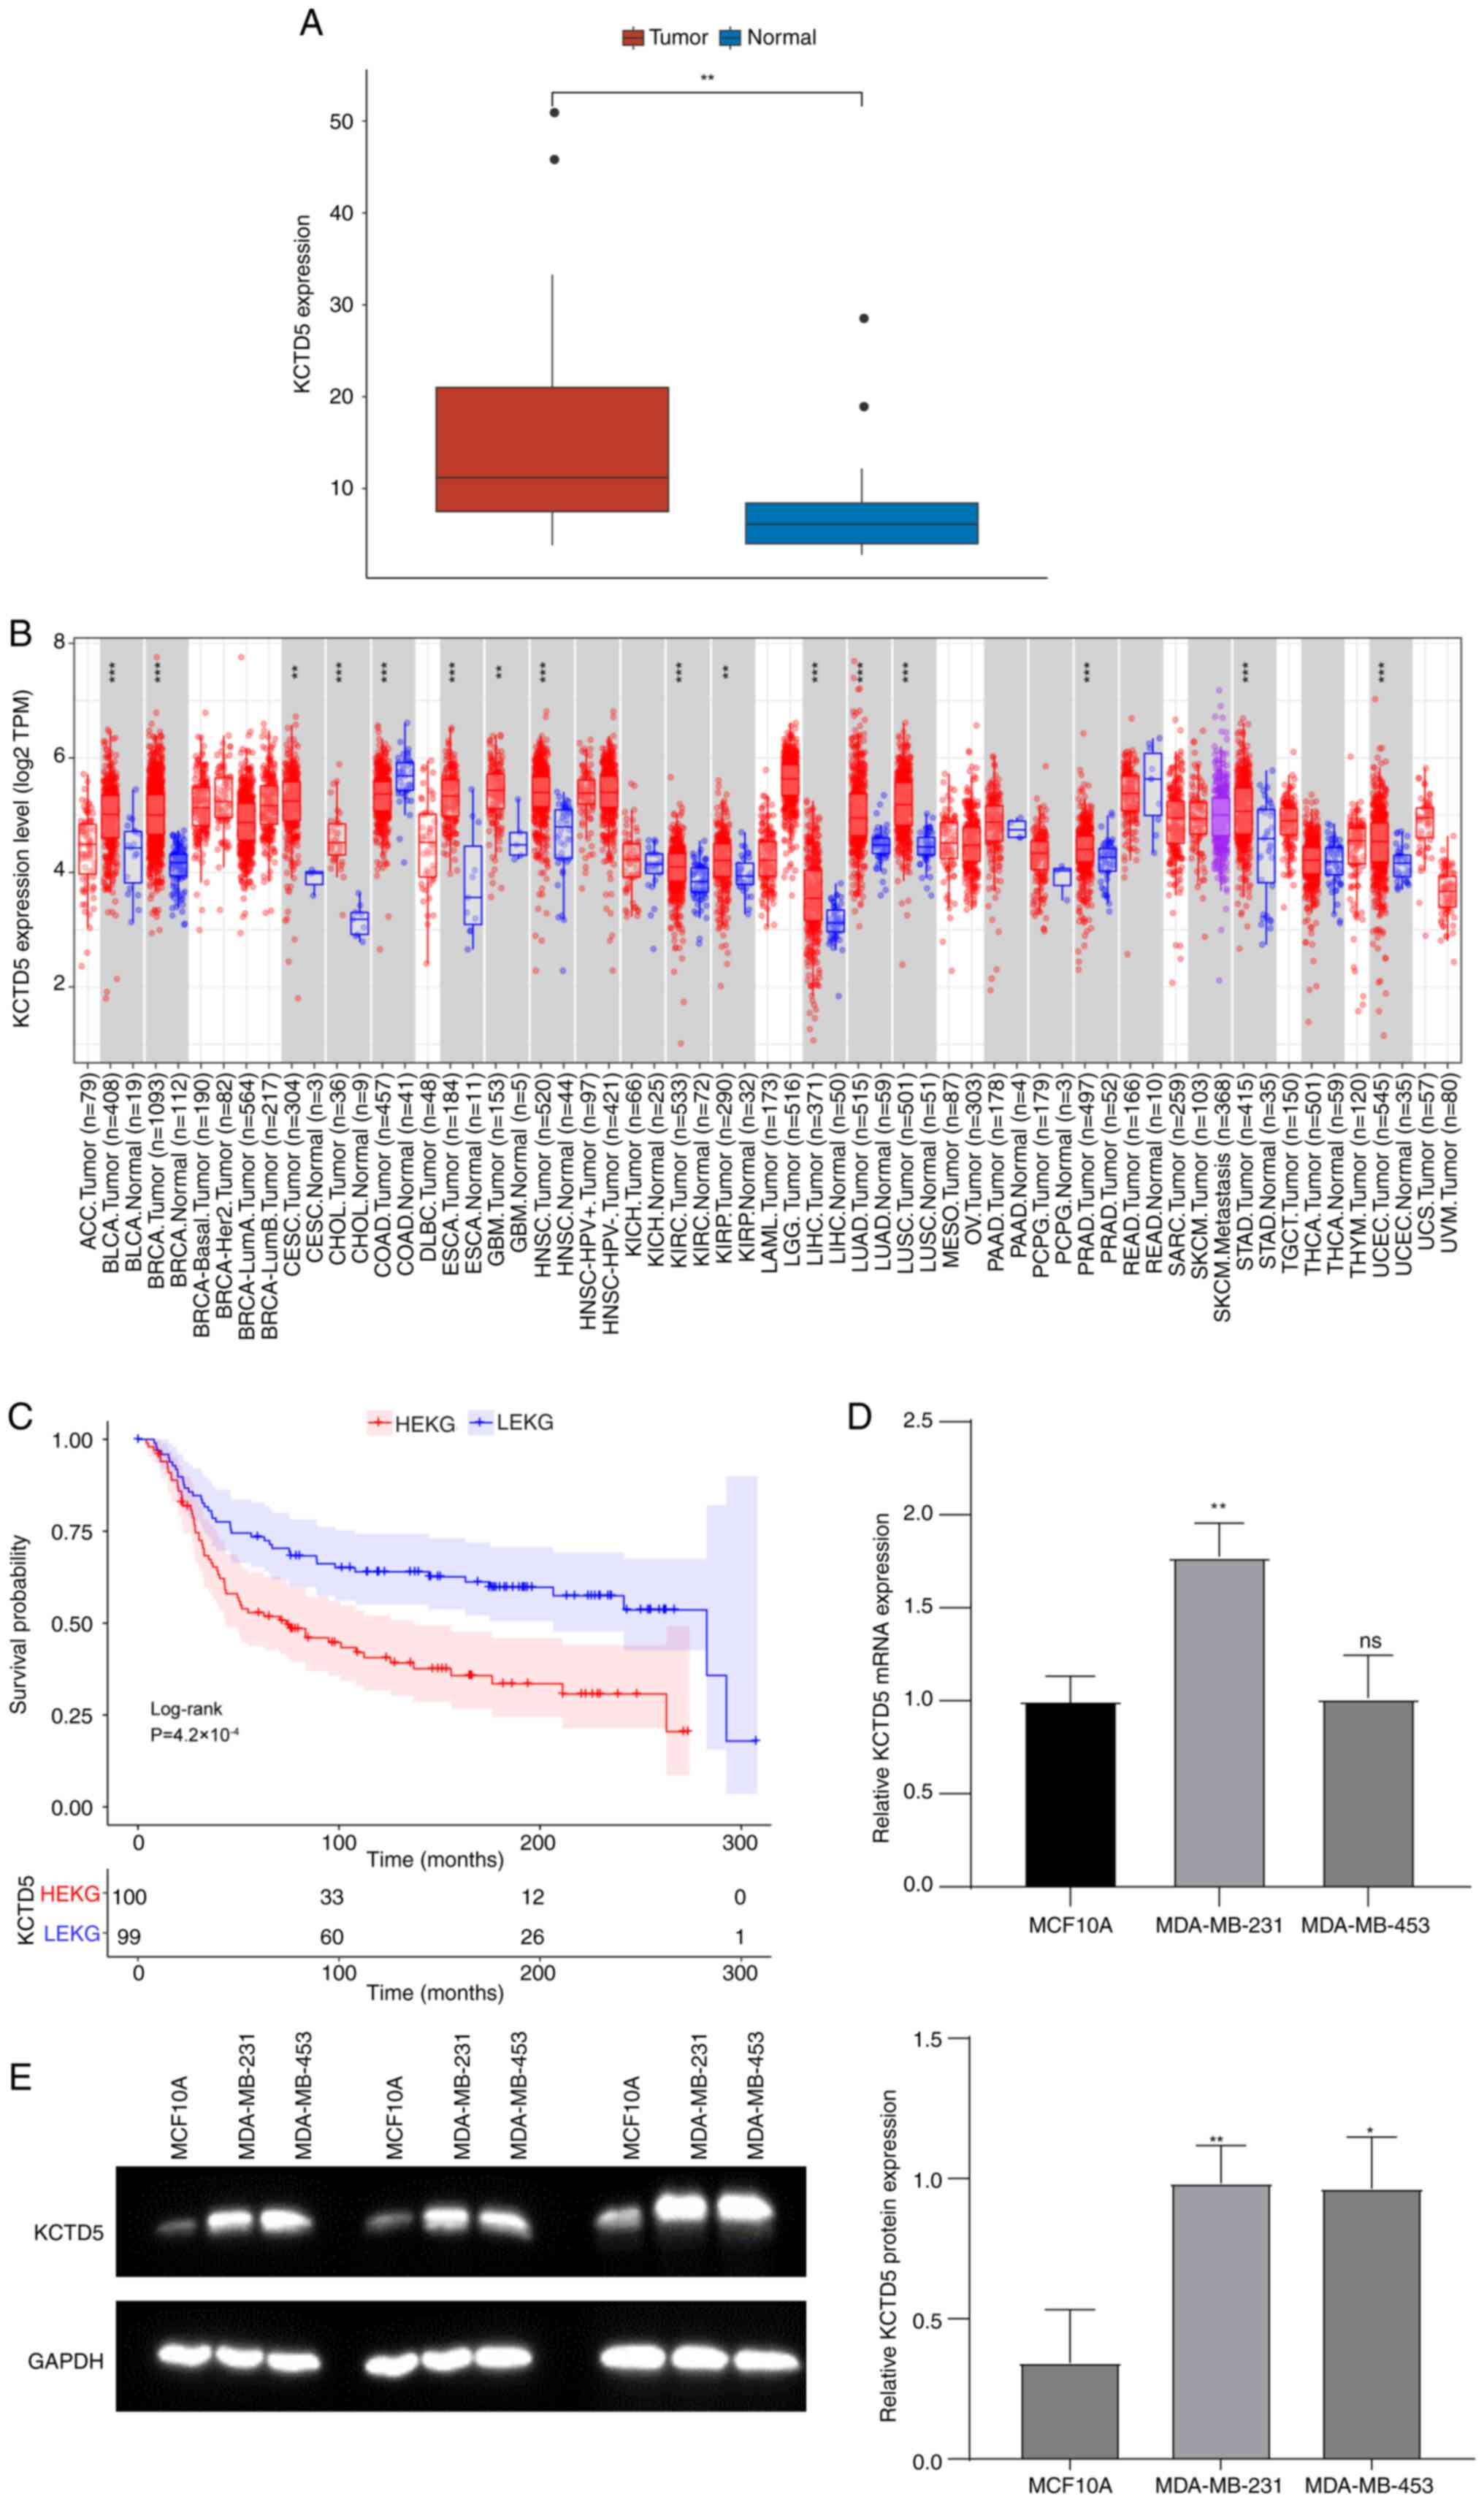
Expression of hub gene KCTD5 in TNBC in both public
datasets and TNBC cell lines was assessed. In the GSE38959 dataset,
KCTD5 mRNA expression was significantly increased in the TNBC
compared with the normal samples (Fig.
3A). Tumor IMmune Estimation Resource database
(cistrome.shinyapps.io/timer/) was used to assess expression of
KCTD5 in numerous types of cancers. KCTD5 was significantly
upregulated in Bladder Urothelial Carcinoma (BLCA), Breast Invasive
Carcinoma (BRCA), Cervical Squamous Cell Carcinoma (CESC),
Cholangiocarcinoma (CHOL), Esophageal Carcinoma (ESCA),
Glioblastoma Multiforme (GBM), Head and Neck Squamous Cell
Carcinoma (HNSC), Kidney Renal Clear Cell Carcinoma (KIRC), Kidney
Renal Papillary Cell Carcinoma (KIRP), Liver Hepatocellular
Carcinoma (LIHC), Lung Adenocarcinoma (LUAD), Lung Squamous Cell
Carcinoma (LUSC), Prostate Adenocarcinoma (PRAD), Stomach
Adenocarcinoma (STAD), and Uterine Corpus Endometrial Carcinoma
(UCEC) compared with normal samples (Fig. 3B).
TNBC samples in the METABRIC database were divided
into high KCTD5 expression group (HEKG) and low KCTD5 expression
group (LEKG) by the median KCTD5 expression value (6.067). KM
survival analysis demonstrated that patients in HEKG had a
significantly shorter overall survival (OS) compared with LEKG
(Fig. 3C). Expression of KCTD5 was
validated in TNBC cell lines MDA-MB-231 and MDA-MB-453 by RT-qPCR
and WB with the control of human normal breast epithelial cell line
MCF10A. MRNA expression levels of KCTD5 were significantly higher
in MDA-MB-231 compared with normal cells (Fig. 3D). Likewise, both TNBC cell lines
demonstrated significantly higher KCTD5 protein levels compared
with the normal cell line (Fig.
3E).
KCTD5 is associated with malignant
progression of TNBC
TNBC samples from TCGA were grouped into HEKG and
LEKG according to the median expression of KCTD5. The DEGs between
HEKG and LEKG were assessed and upregulated genes were subjected to
KEGG and GO enrichment analyses. There were 18 significantly
enriched KEGG pathways, 602 significantly enriched BP, 97 MF and
144 CC entries, with the top ten enriched KEGG pathways and top ten
enriched GO pathways shown in Fig. 4A
and B, respectively. GSEA was performed between HEKG and LEKGs.
The results demonstrated that there were 136 pathways significantly
enriched in HEKG compared with LEKG (Table SIII), including IL-17 signaling
pathway, MAPK signaling pathway, NF-κB signaling pathway, PI3K-Akt
signaling pathway, Wnt signaling pathway, etc. which were
associated with proliferation, survival, invasion, and metastasis
of cancer cells (Fig. 4C). The
enrichment of functions, including those associated with cell cycle
and tumor-associated pathways, suggested the role of KCTD5 in the
malignant progression of TNBC, influencing key processes such as
tumor occurrence and invasion.
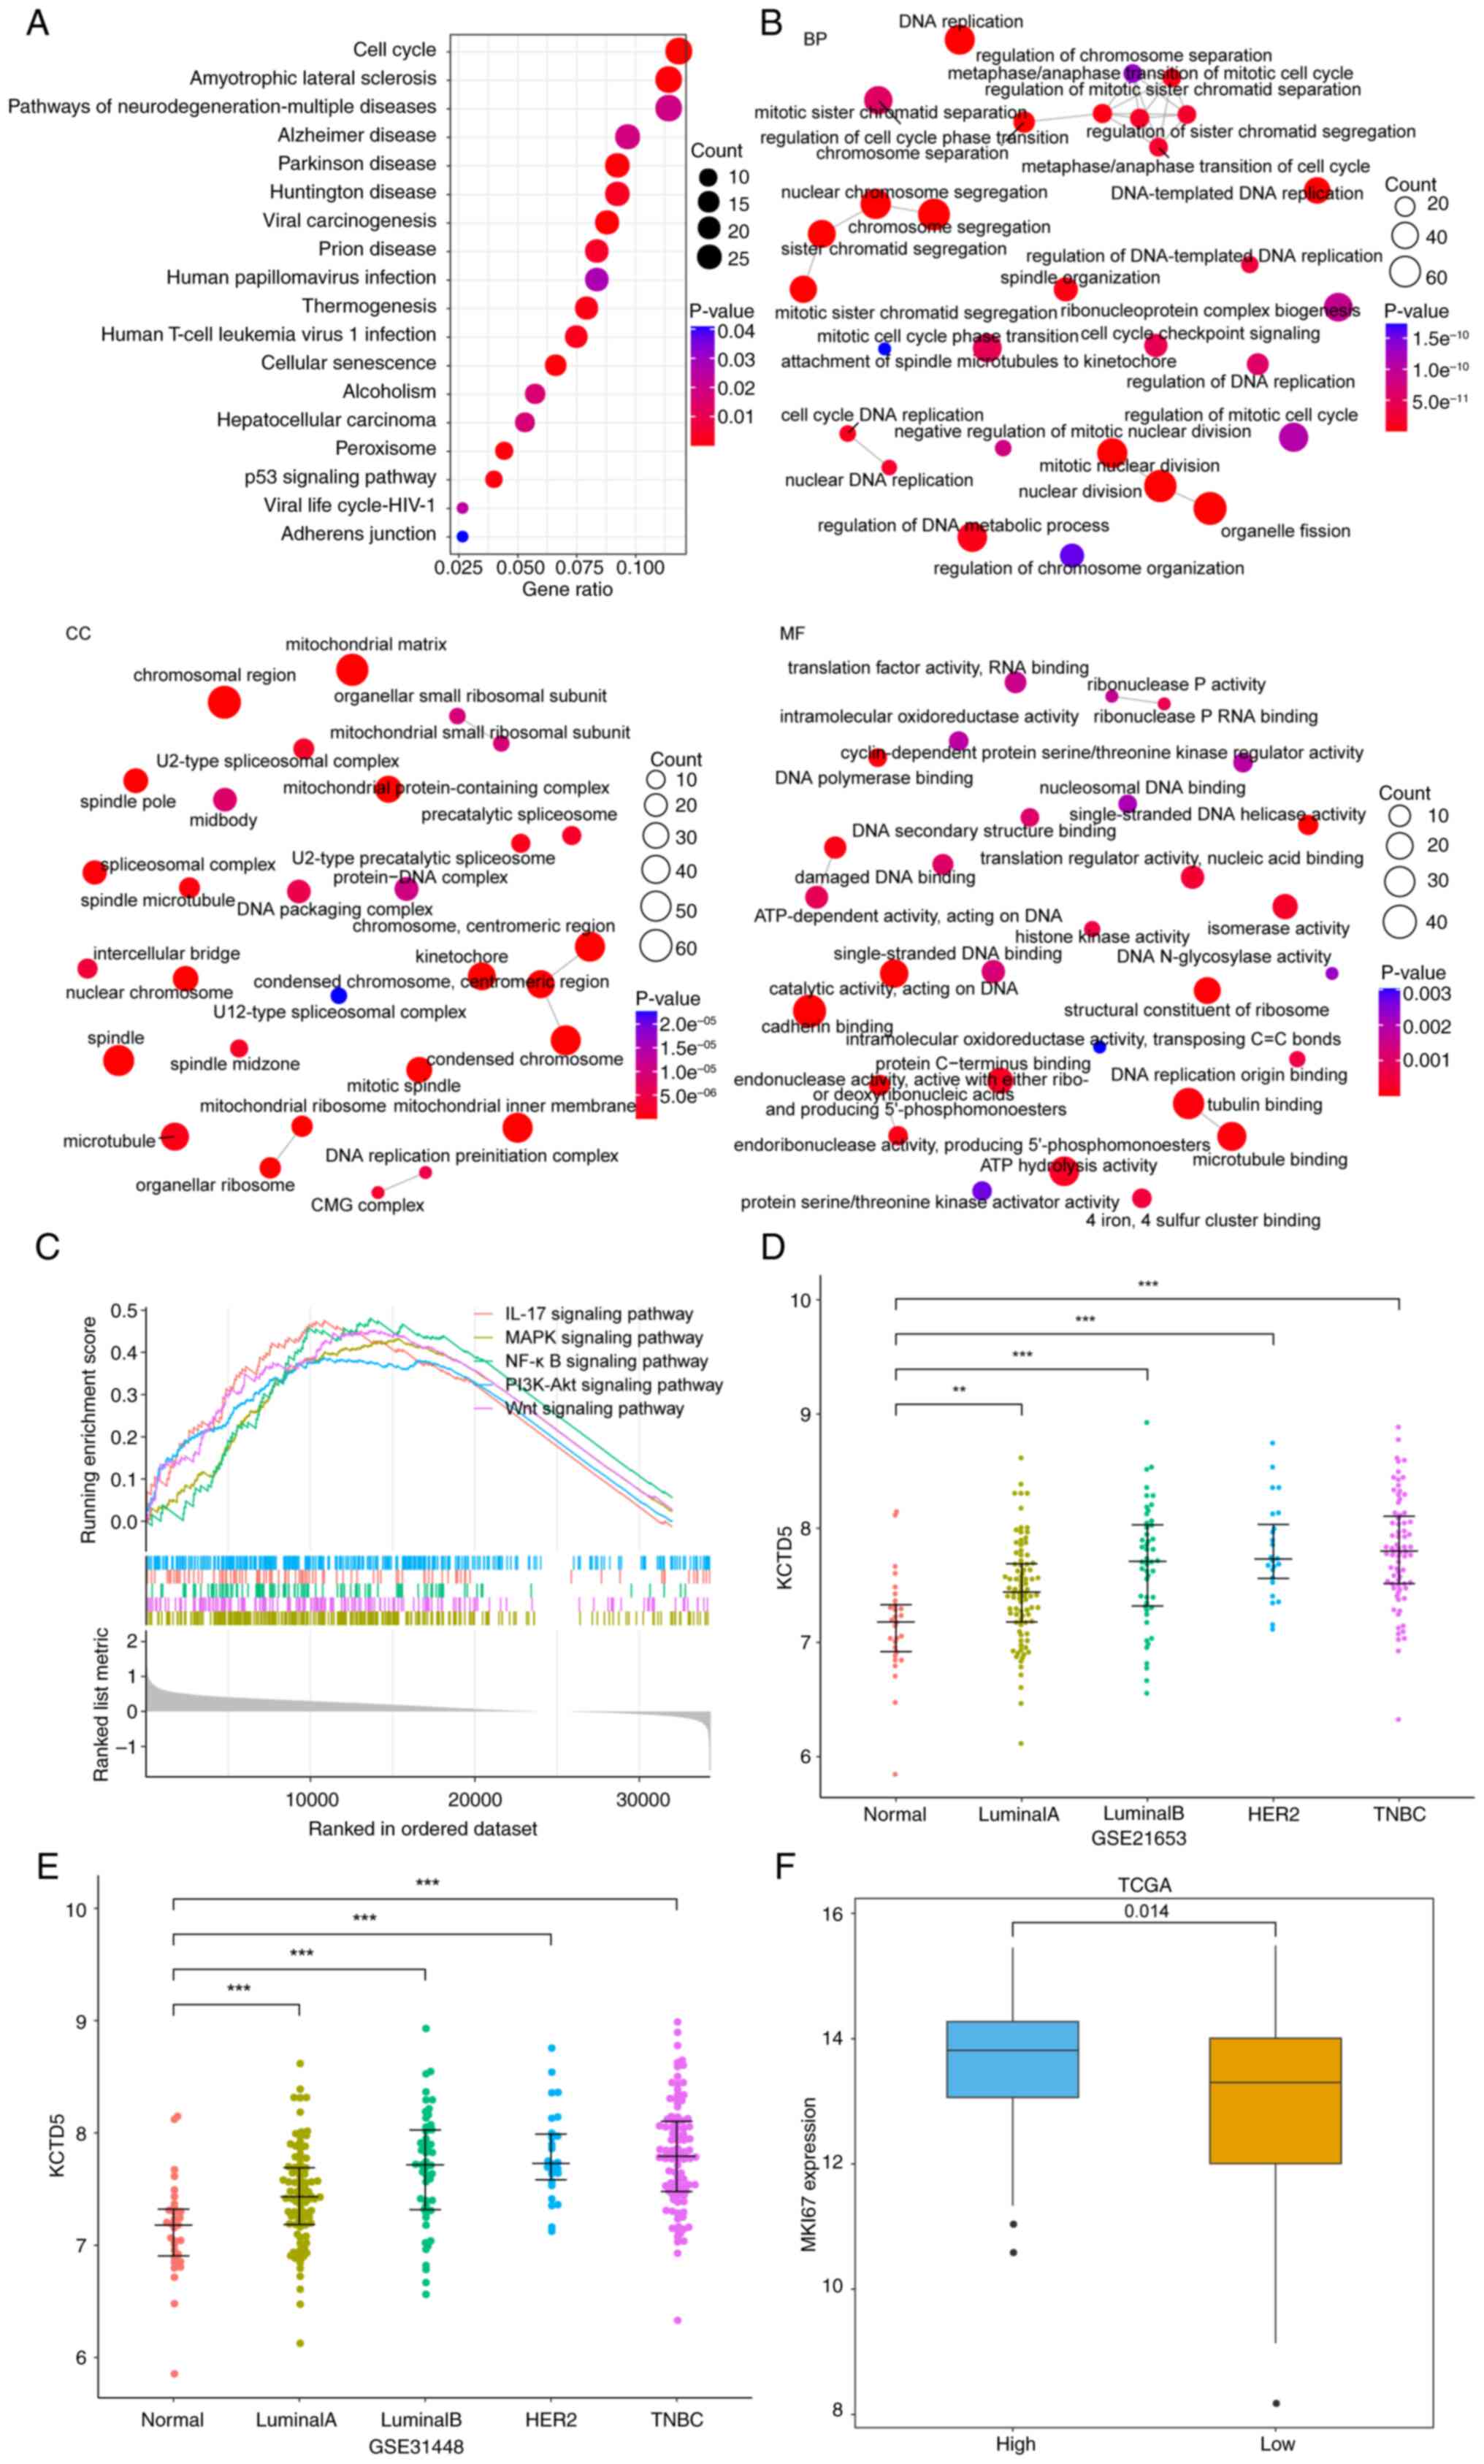 | Figure 4.KCTD5 is associated with malignant
progression in TNBC. Top 10 (A) KEGG pathways and (B) GO functional
enrichment analysis network of upregulated differentially expressed
genes between HEKG and LEKG in TCGA-TNBC. (C) Gene set enrichment
analysis of HEKG and LEKG in TCGA-TNBC. The expression of KCTD5 in
numerous breast cancer subtypes was using (D) GSE21653 and (E)
GSE31488 datasets, and the comparisons were made between different
subtypes and normal samples. (F) Expression of proliferation marker
gene MKI67 in HEKG and LEKG of TCGA-TNBC dataset. **P<0.01 and
***P<0.001 vs. normal samples. BP, biological process; MF,
molecular function; CC, cellular component; TCGA, The Cancer Genome
Atlas; TNBC, triple negative breast cancer; HEKG, high KCTD5
expression group; LEKG, low KCTD5 expression group; KCTD5,
potassium channel tetramerization domain 5; MKI67, marker of
proliferation Ki-67; HER, human epidermal growth factor receptor
2. |
Expression of KCTD5 in a number of breast cancer
subtypes with differential malignancy was assessed using the
GSE21653 and GSE31488 datasets. The results demonstrated that in
both datasets, expression of KCTD5 was significantly higher in
breast cancer subtypes than normal samples, and the expression
median gradually increased with the increase of malignant degree of
subtypes, where the most malignant subtype was TNBC (Fig. 4D and E). Expression of marker of
proliferation Ki-67 (MKI67) was assessed in HEKG and LEKGs using
TCGA datasets, which demonstrated that expression of MKI67 was
significantly higher in HEKG compared with the LEKG (Fig. 4F). Therefore, KCTD5 may promote
tumor cell proliferation and the malignant progression of TNBC.
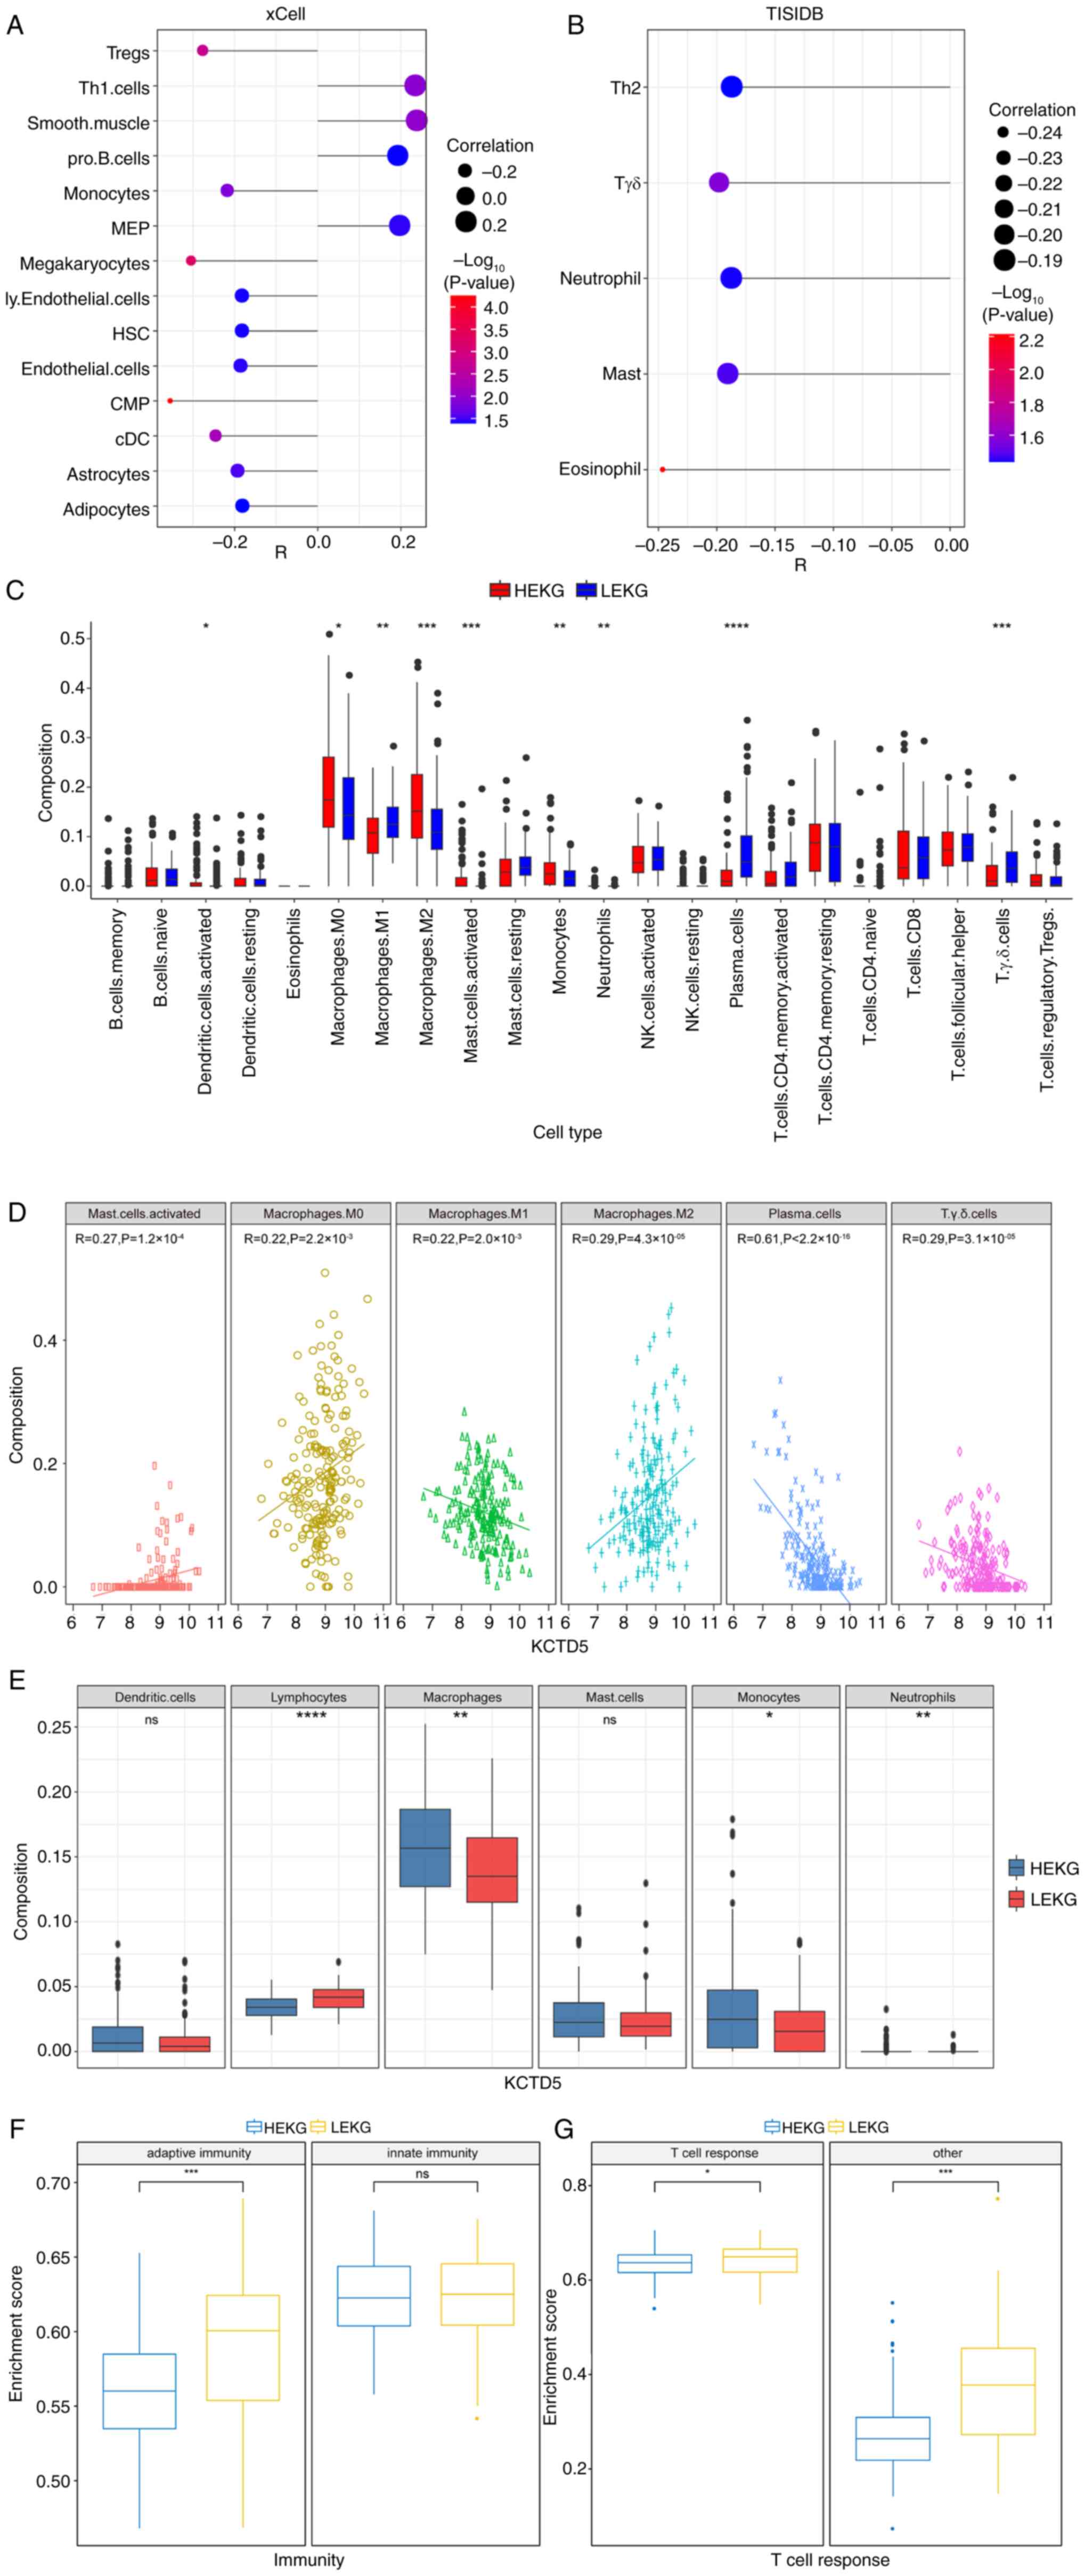
Immune landscape of samples with high
KCTD5 expression
As KCTD5 was identified as a potential driver of
malignant progression in TNBC, the impact of KCTD5 on the immune
landscape and TME in TNBC was assessed. The immune response and TME
are vital for cancer progression and patient response to therapy
(33). Using TCGA database, the
correlation between KCTD5 and abundance of numerous infiltrating
immune cells was analyzed based on two databases, xCell and TISIDB.
In xCell, KCTD5 demonstrated a significant positive association
with ‘Smooth.muscle’, ‘Th1.cells’, megakaryocyte-erythroid
progenitor cells ‘MEP’ and ‘pro.B.cells’ and a significant negative
association with common myeloid progenitor ‘CMP’, ‘megakaryocytes’,
regulatory T cells ‘Tregs’, conventional dendritic cells ‘cDC’,
‘monocytes’, ‘astrocytes’, ‘endothelial.cells’, lymphatic
endothelial cells ‘ly.Endothelial.cells’, hematopoietic stem cells
‘HSC’ and ‘adipocytes’ (Fig. 5A).
In TISIDB tool analysis, KCTD5 demonstrated a significant negative
association with ‘eosinophil’, γδ T cells ‘Tgd’, ‘mast’ cells,
‘neutrophil’ and T helper 2 ‘Th2’ cells (Fig. 5B).
The infiltration of 22 types of immune cell between
HEKG and LEKG groups was evaluated. The results demonstrated a
significantly higher infiltration of ‘activated dendritic cells’,
‘macrophages M0’, ‘macrophages M2’, ‘activated mast cells’,
‘monocytes’, and ‘neutrophils’ in HEKG compared with the LEKG, and
significantly lower infiltration of ‘macrophages M1’, ‘plasma
cells’, and ‘Tgd cells’ in HEKG compared with the LEKG (Fig. 5C). Further analysis of Pearson
correlation was conducted and six of cell types displayed
significant correlation with KCTD5 expression level. KCTD5
expression was significantly negatively correlated with ‘plasma
cells’, ‘macrophages M1’ and ‘Tgd cells’, and significantly
positively associated with ‘activated mast cells’, ‘macrophages M0’
and ‘macrophages M2’ (Fig.
5D).
These 22 immune cells were divided into six
categories: Lymphocytes, macrophages, monocytes, neutrophils,
dendritic cells and mast cells. It was demonstrated that the
infiltration rates of macrophages, monocytes and neutrophils were
significantly higher in the HEKG compared with LEKG, while the
infiltration rate of lymphocytes was significantly higher in LEKG
compared with the HEKG. There was no significant infiltration
difference in dendritic cells or neutrophils (Fig. 5E).
Moreover, single-sample GSEA was performed on TNBC
samples from the METABRIC database to assess activity of immune
cells indicated by enrichment score. Immune cells were divided into
two groups: Innate and adaptive immunity. There was a significant
increase in the enrichment score for adaptive immunity in LEKG
compared with the HEKG, while no significant difference was
demonstrated in innate immunity between groups (Fig. 5F). The adaptive immunity group was
further divided into T cell response and other. LEKG had a
significantly higher enrichment score for T cell and other response
compared with HEKG (Fig. 5G).
TNBC samples with high expression of
KCTD5 exhibit worse clinical outcomes
Finally, survival rate of patients was assessed.
GSE69031, GSE45255, GSE135565 and GSE65194 datasets were merged
after batch effect removal and 163 TNBC samples were selected based
on complete survival information. KM survival analysis was
performed on HEKG and LEKG samples. The OS of patients in HEKG was
significantly shorter compared with LEKG (Fig. 6A). GSE21653 dataset demonstrated
that patients in the HEKG had a significantly shorter disease-free
survival (DFS) compared with LEKG (Fig. 6B). METABRIC database demonstrated
that HEKG had a significantly shorter relapse-free survival (RFS)
compared with the LEKG (Fig.
6C).
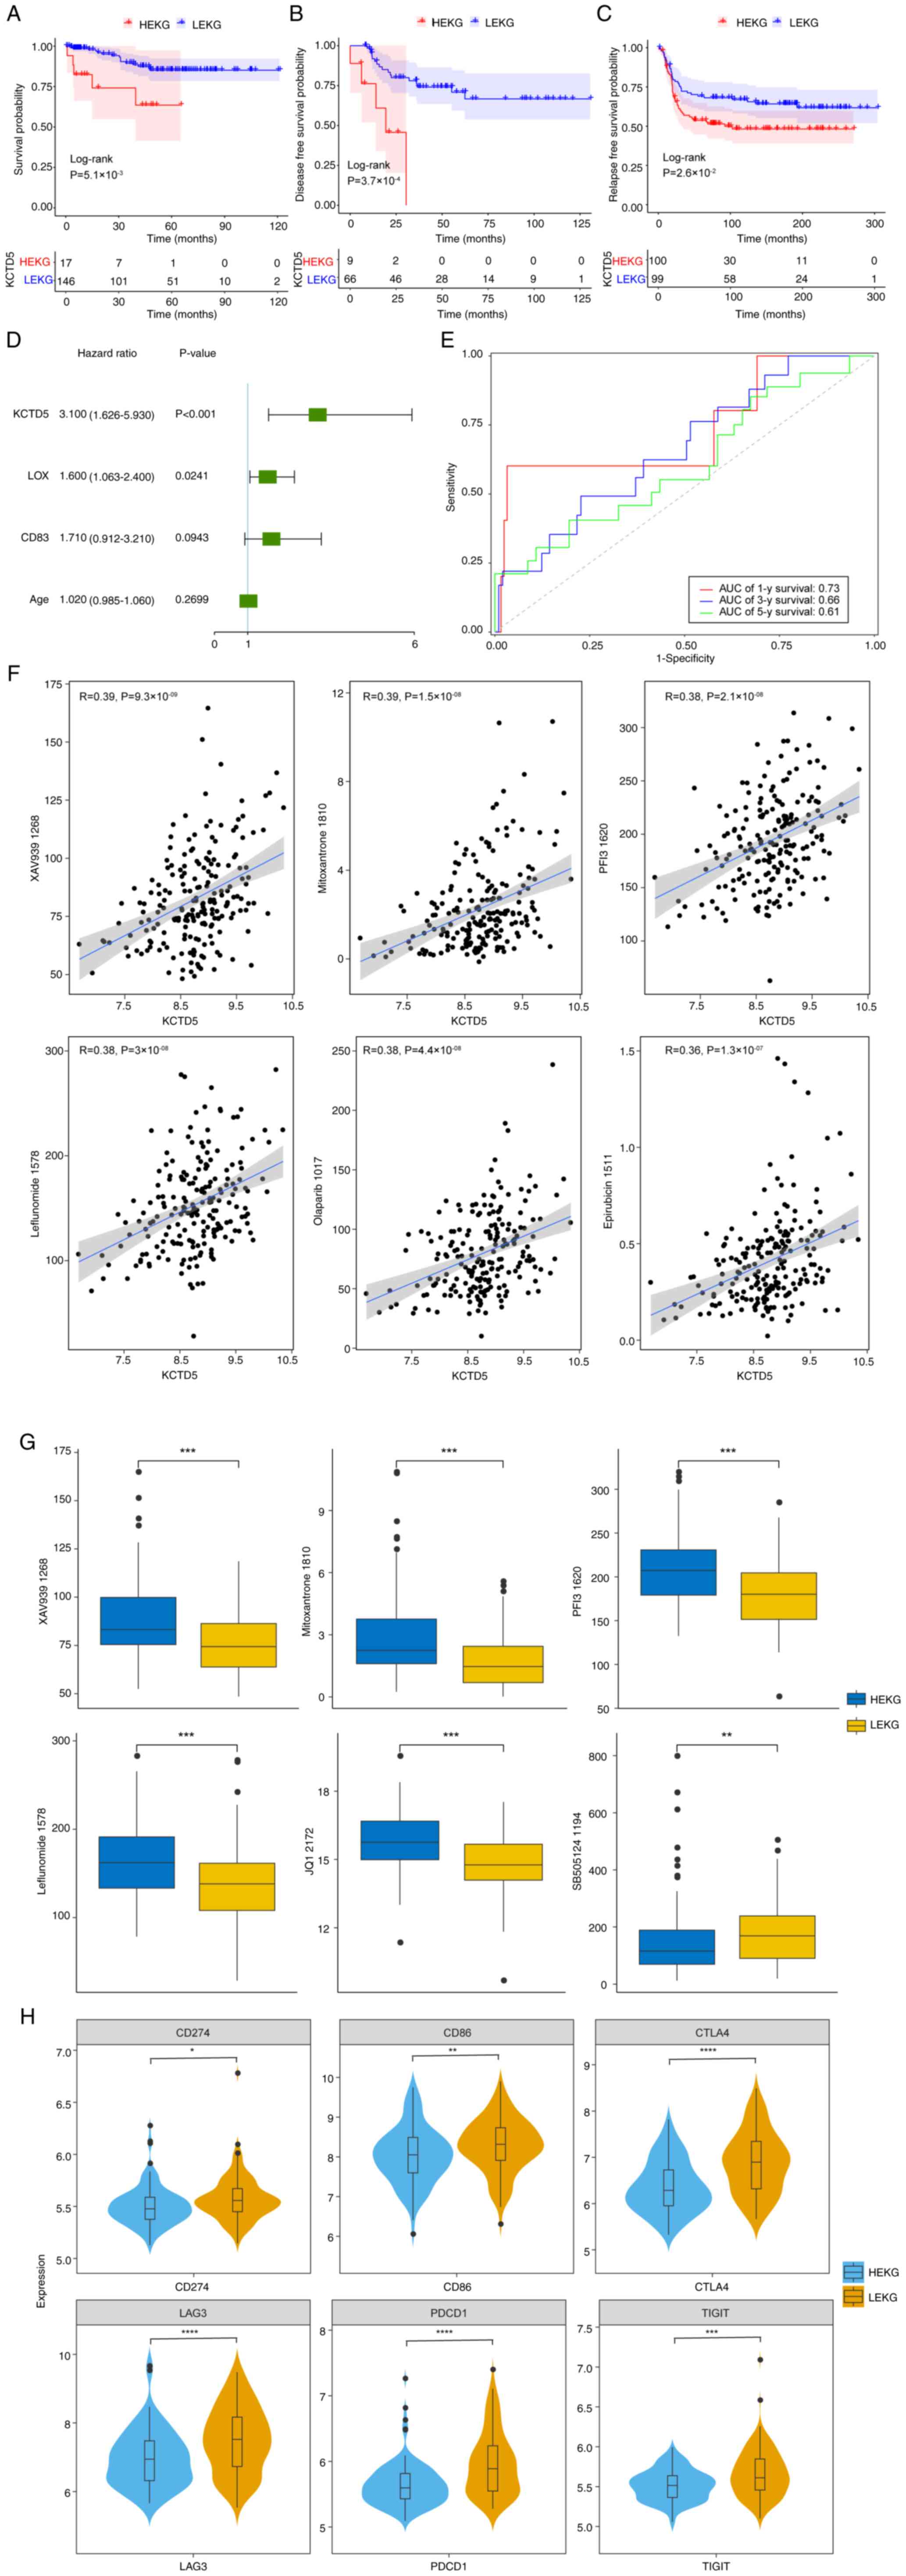 | Figure 6.Survival analysis and clinical
outcomes of TNBC samples. (A) KM curve of merged GSE69031,
GSE45255, GSE135565 and GSE65194. (B) KM disease-free survival
curve based on the GSE21653 dataset. (C) KM relapse-free survival
curve based on METABRIC database. (D) Multivariate Cox regression
analysis of TNBC samples in the merged dataset. (E) Receiver
operating characteristics analysis of KCTD5 expression based on the
merged dataset. (F) Correlation between KCTD5 expression and drugs
using METABRIC dataset. (G) IC50 in HEKG and LEKG in
TNBC samples. (H) Expression of immune checkpoint genes in HEKG and
LEKG based on METABRIC data. *P<0.05, **P<0.01, ***P<0.001
and ****P<0.0001 vs. LEKG. TNBC, triple negative breast cancer;
KM, Kaplan-Meier; METABRIC, Molecular Taxonomy of Breast Cancer
International Consortium; HEKG, high KCTD5 expression group; LEKG,
low KCTD5 expression group; AUC, area under curve; y, year. |
As patients with high KCTD5 expression demonstrated
a shorter OS, DFS and RFS in different datasets, it was determined
whether KCTD5 was an independent indicator for poor prognosis. In
the merged dataset, lysyl Oxidase (LOX), CD83 and age were included
in a multivariate Cox regression analysis, which demonstrated that
KCTD5 and LOX could serve as independent prognostic factors for
patients with TNBC (Fig. 6D).
Time-dependent receiver operating characteristic analysis
demonstrated that the area under curve values for 1, 3 and 5-year
survival were 0.73, 0.66 and 0.61, respectively, suggesting that
KCTD5 could effectively predict prognosis of patients with TNBC
(Fig. 6E).
To identify potential targets for drug development
and select more effective drugs for individual patients, drug
sensitivity was predicted using METABRIC dataset. The correlation
between KCTD5 and drug half-maximal inhibitory concentration
(IC50) was analyzed, demonstrating that KCTD5 was
significantly negatively correlated with BI.2536_1086,
SB505124_1194 and Acetalax_1804 (Table SIV). KCTD5 was also significantly
positively correlated with 160 other drugs including XAV939_1268,
Mitoxantrone_1810, PFI3_1620, Leflunomide_1578, Olaparib_1017, and
Epirubicin_1511 (Fig. 6F; Table SIV). For drugs that demonstrated a
significant correlation, IC50 between HEKG and LEKG in
TNBC samples was compared. IC50 values of XAV939_1268,
Mitoxantrone_1810, PFI3_1620, Leflunomide_1578 and JQ1_2172 were
significantly higher in HEKG compared with LEKG, while
SB505124_1194 was significantly higher in LEKG compared with HEKG
(Fig. 6G).
Furthermore, to identify potential targets for
immunotherapy and personalized treatment, correlation between KCTD5
and immune checkpoints proteins was assessed. The differential
expression of immune checkpoint genes programmed cell death protein
1 (PDCD1), Cytotoxic T-Lymphocyte-Associated Protein 4 (CTLA4),
CD274), Cluster of Differentiation 86 (CD86), Lymphocyte-Activation
Gene 3 (LAG3), T Cell Immunoreceptor with Ig and ITIM Domains
(TIGIT) was assessed based on METABRIC data. Expression levels of
these genes were significantly lower in HEKG compared with LEKG
(Fig. 6H).
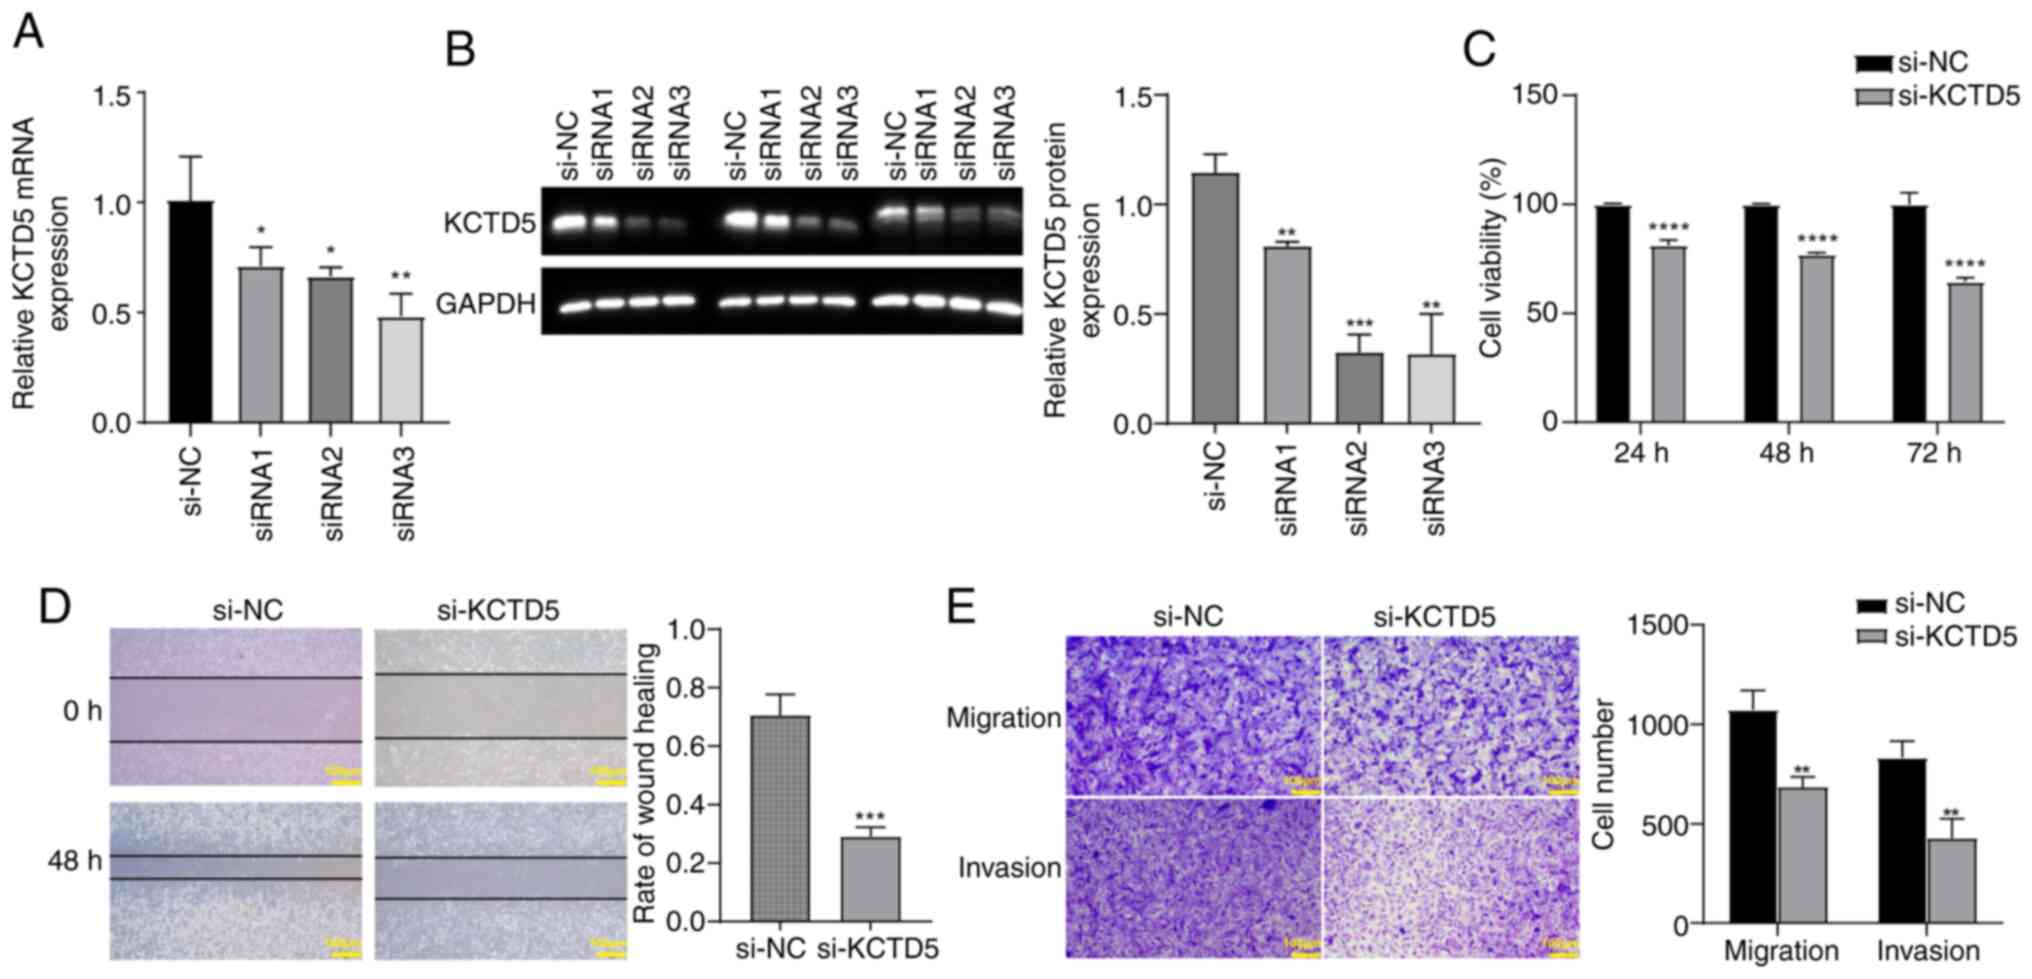
KCTD5 knockdown inhibits viability,
migration and invasion of TNBC cells
To assess the effect of KCTD5 downregulation on TNBC
cells, a KCTD5 knockdown expression model was constructed in
MDA-MB-231 cells. RT-qPCR and WB validated the decreased KCTD5
expression after transfection with siRNA targeting KCTD5. The mRNA
and protein levels of KCTD5 in siRNA1, siRNA2 and siRNA3 groups was
significantly reduced compared with the si-NC (Fig. 7A and B). In subsequent experiments,
si-RNA3 was selected as si-KCTD5. CCK-8 assay demonstrated that
KCTD5 knockdown significantly decreased the viability of MDA-MB-231
cells compared with the si-NC group (Fig. 7C). Wound healing assay demonstrated
that KCTD5 knockdown significantly inhibited migration ability of
MDA-MB-231 cells compared with si-NC group (Fig. 7D). Transwell assays demonstrated
that the migration and invasion abilities of MDA-MB-231 cells were
significantly decreased after KCTD5 knockdown compared with the
si-NC group (Fig. 7E).
Discussion
In the present study, KCTD5 was identified as a
CD8+ T cell-associated hub gene in TNBC. KCTD5 was
significantly upregulated in TNBC and was an indicator of poor
prognosis. KCTD5 promoted malignant progression of TNBC such as
invasion and cell viability and affected the TME and expression of
a number of immune checkpoint genes. These checkpoints serve a role
in regulating the immune response and maintaining self-tolerance
(34). KCTD5 knockdown inhibited
the viability, migration and invasion abilities of a TNBC cell
line. The correlation between drug sensitivity and KCTD5 expression
suggested that KCTD5 expression could be a useful predictor of drug
sensitivity in TNBC, identifying drugs that might be more effective
in patients with high or low KCTD5 expression. Moreover, KCTD5 was
suggested to be an independent indicator of prognosis of patients
with TNBC. Of 26 members of the KCTD protein family, only KCTD5 has
a resolved three-dimensional structure (35), underscoring its potential as a
subject for detailed biological and medicinal research in TNBC.
KCTD5 serves a role in anti-proliferative response (36). Here, expression of the
proliferation marker gene MKI67 was significantly increased in HEKG
compared with the LEKG. Previous studies have reported that KCTD5
is overexpressed in all types of breast cancer (37), is involved in expression of
transient receptor potential melastatin 4 channels and
Ca2+ sensitivity (38)
and serves as a negative regulator of cell migration, which impacts
the likelihood of metastasis (39). KCTD5 has been reported to interact
with E3 ubiquitin ligase (40), a
ubiquitin ligase that promotes degradation of cyclin E (41), which is essential for the G1/S
transition of the cell cycle (42).
To the best of our knowledge, there is limited
research assessing the association between KCTD5 and
CD8+ T cells (43).
Here, adaptive immunity was significantly more activated in LEKG
than HEKG and low expression of KCTD5 was suggested to induce a
relatively stronger T cell response compared to high expression of
KCTD5. A previous study reported that the expression of KCTD5 is
upregulated in peripheral blood lymphocytes stimulated by T cell
receptor (40). In the present
study, KCTD5 expression was positively associated with
CD8+ T cells, which was consistent with the positive
correlation reported between KCTD5 expression and CD8+ T
cells in lung adenocarcinoma (43). This positive correlation seems
contradictory as KCTD5 is associated with a poor prognosis but
CD8+ T cells represent antitumor activity, which is an
indicator of favorable prognosis. One explanation is the
non-uniform distribution of CD8+ T cells within tumor
tissue, which can lead to variability in results due to random
nature of sampling. The TME is complicated, involving numerous
regulators. The infiltration of immune cells varies according to
diseases and different stages. Although KCTD5 is associated with
poor prognosis of TNBC and promotes migration, it is a negative
regulator of metastasis in melanoma mediated by Rac1 and
Ca2+ signaling pathway (39). CD8+ T cells inhibit
metastasis; metastasis poses a challenge in TNBC treatment due to
the aggressive nature of the disease, the lack of targetable
receptors, and the potential for immune evasion and therapy
resistance.
KCTD5 expression was significantly negatively
associated with macrophages M1, plasma cells and Tgd cells and
significantly positively associated with activated mast cells,
macrophages M0 and macrophages M2. When KCTD5 is upregulated in
TNBC, macrophages are prone to polarize to M2 subtype, which is an
anti-inflammatory subtype (44).
Oncogene multiple copies in T cell malignancy 1 (MCT1) exerts a
similar effect on polarization of macrophages in TNBC, namely
activation of MCT-1, which enriches tumor-promoting M2 macrophages
in the TME (45). It is
hypothesized that silencing KCTD5 may inhibit M2 macrophages
recruitment, in a similar manner to CCL2, a potential therapeutic
target gene of TNBC (46).
Furthermore, knockdown of KCTD5 has been reported to
suppress proliferation, migration and invasion of melanoma cells
(39). KCTD5 may serve as a
modulator of cell migration by influencing cell motility and focal
adhesion dynamics, potentially via Rac1 activity and
Ca2+ signaling pathways, which has been reported by
previous studies (39,47,48).
KCTD5 is a cancer marker associated with programmed cell death
(49). KCTD5 knockdown increases
the apoptosis of human lung cancer cell line A549 (49). These findings suggest the potential
value in downregulating KCTD5 in TNBC treatment.
There was no significant difference in
CD8+ T cell infiltration between HEKG and LEKG. This may
be attributed to KCTD5 influencing CD8+ T cell behavior
in an indirect manner, potentially via its effects on the cytokine
environment or by impacting other immune cells that regulate
CD8+ T cell activity, rather than by directly recruiting
or expanding CD8+ T cells. Given the complexity of the
immune system, the association between KCTD5 expression and
CD8+ T cell infiltration may be influenced by a
multitude of interrelated factors. These include the complex
regulatory mechanisms, such as intricate immune cell interactions,
the cytokine signaling networks that mediate communication among
immune cells, the epigenetic changes that can affect gene
expression, and the post-translational modifications that can
modulate protein activity. Moreover, heterogeneity of tumors may
lead to variability in CD8+ T cell infiltration that the
present analysis could not fully assess owing to differences in TME
between patients. Further studies such as in vitro
co-culture experiment, immune cell isolation and transfer
experiments, immunofluorescence and histological analysis are
required to elucidate the precise effects of KCTD5 on
CD8+ T cells in TNBC.
In conclusion, the present study identified
CD8+ T cell-associated hub gene KCTD5, which was
upregulated in TNBC and associated with poor prognosis. Viability,
migration and invasion of TNBC cells was inhibited by KCTD5
knockdown. Furthermore, KCTD5 could influence the TME in TNBC.
These findings suggested that KCTD5 may serve a role in the
pathogenesis of TNBC and may be a potential therapeutic target for
TNBC. Further studies are required to understand the molecular
mechanisms underlying the functions of KCTD5 in TNBC and to
effective therapeutic strategies targeting this protein.
Supplementary Material
Supporting Data
Supporting Data
Supporting Data
Supporting Data
Acknowledgements
Not applicable.
Funding
Funding: No funding was received.
Availability of data and materials
The data generated in the present study may be
requested from the corresponding author.
Authors' contributions
JL and JY conceived the study and analyzed data. JL
wrote the manuscript. JY edited the manuscript. JL and JY confirm
the authenticity of all the raw data. All authors have read and
approved the final manuscript.
Ethics approval and consent to
participate
Not applicable.
Patient consent for publication
Not applicable.
Competing interests
The authors declare that they have no competing
interests.
References
|
1
|
Oze I, Ito H, Kasugai Y, Yamaji T, Kijima
Y, Ugai T, Kasuga Y, Ouellette TK, Taniyama Y, Koyanagi YN, et al:
A personal breast cancer risk stratification model using common
variants and environmental risk factors in japanese females.
Cancers (Basel). 13:37962021. View Article : Google Scholar : PubMed/NCBI
|
|
2
|
Weidle UH and Birzele F: Triple-negative
breast cancer: Identification of circRNAs with efficacy in
preclinical in vivo models. Cancer Genomics Proteomics. 20:117–31.
2023. View Article : Google Scholar : PubMed/NCBI
|
|
3
|
Bergin ART and Loi S: Triple-negative
breast cancer: Recent treatment advances. F1000Res. 8:F1000 Faculty
Rev. –1342. 2019. View Article : Google Scholar : PubMed/NCBI
|
|
4
|
Abdollahi A and Etemadi M: Pathological
characteristics of triple-negative breast cancer at main referral
teaching hospital, April 2014 to April 2015, Tehran, Iran. Int J
Hematol Oncol Stem Cell Res. 10:200–205. 2016.PubMed/NCBI
|
|
5
|
Johnson R, Sabnis N, McConathy WJ and
Lacko AG: The potential role of nanotechnology in therapeutic
approaches for triple negative breast cancer. Pharmaceutics.
5:353–370. 2013. View Article : Google Scholar : PubMed/NCBI
|
|
6
|
Nandini D, Jennifer A and Pradip D:
Therapeutic strategies for metastatic triple-negative breast
cancers: From negative to positive. Pharmaceuticals (Basel).
14:4552021. View Article : Google Scholar : PubMed/NCBI
|
|
7
|
Anderson NM and Simon MC: The tumor
microenvironment. Curr Biol. 30:R921–R925. 2020. View Article : Google Scholar : PubMed/NCBI
|
|
8
|
Raskov H, Orhan A, Christensen JP and
Gögenur I: Cytotoxic CD8+ T cells in cancer and cancer
immunotherapy. Br J Cancer. 124:359–367. 2021. View Article : Google Scholar : PubMed/NCBI
|
|
9
|
Oshi M, Asaoka M, Tokumaru Y, Yan L,
Matsuyama R, Ishikawa T, Endo I and Takabe K: CD8 T cell score as a
prognostic biomarker for triple negative breast cancer. Int J Mol
Sci. 21:69682020. View Article : Google Scholar : PubMed/NCBI
|
|
10
|
Li X, Gruosso T, Zuo D, Omeroglu A,
Meterissian S, Guiot MC, Salazar A, Park M and Levine H:
Infiltration of CD8+ T cells into tumor cell clusters in
triple-negative breast cancer. Proc Natl Acad Sci USA.
116:3678–3687. 2019. View Article : Google Scholar : PubMed/NCBI
|
|
11
|
Provenzano PP, Cuevas C, Chang AE, Goel
VK, Von Hoff DD and Hingorani SR: Enzymatic targeting of the stroma
ablates physical barriers to treatment of pancreatic ductal
adenocarcinoma. Cancer Cell. 21:418–429. 2012. View Article : Google Scholar : PubMed/NCBI
|
|
12
|
Zboralski D, Hoehlig K, Eulberg D,
Fromming A and Vater A: Increasing tumor-infiltrating T cells
through inhibition of CXCL12 with NOX-A12 synergizes with PD-1
blockade. Cancer Immunol Res. 5:950–956. 2017. View Article : Google Scholar : PubMed/NCBI
|
|
13
|
Durgeau A, Virk Y, Corgnac S and
Mami-Chouaib F: Recent advances in targeting CD8 T-cell immunity
for more effective cancer immunotherapy. Front Immunol. 9:142018.
View Article : Google Scholar : PubMed/NCBI
|
|
14
|
Virassamy B, Caramia F, Savas P, Sant S,
Wang J, Christo SN, Byrne A, Clarke K, Brown E, Teo ZL, et al:
Intratumoral CD8+ T cells with a tissue-resident memory
phenotype mediate local immunity and immune checkpoint responses in
breast cancer. Cancer Cell. 41:585–601.e8. 2023. View Article : Google Scholar : PubMed/NCBI
|
|
15
|
Li K, Li T, Feng Z, Huang M, Wei L, Yan Z,
Long M, Hu Q, Wang J, Liu S, et al: CD8+ T cell immunity
blocks the metastasis of carcinogen-exposed breast cancer. Sci Adv.
7:eabd89362021. View Article : Google Scholar : PubMed/NCBI
|
|
16
|
Liu YR, Jiang YZ, Xu XE, Hu X, Yu KD and
Shao ZM: Comprehensive transcriptome profiling reveals multigene
signatures in triple-negative breast cancer. Clin Cancer Res.
22:1653–1662. 2016. View Article : Google Scholar : PubMed/NCBI
|
|
17
|
Komatsu M, Yoshimaru T, Matsuo T, Kiyotani
K, Miyoshi Y, Tanahashi T, Rokutan K, Yamaguchi R, Saito A, Imoto
S, et al: Molecular features of triple negative breast cancer cells
by genome-wide gene expression profiling analysis. Int J Oncol.
42:478–506. 2013. View Article : Google Scholar : PubMed/NCBI
|
|
18
|
Sabatier R, Finetti P, Cervera N,
Lambaudie E, Esterni B, Mamessier E, Tallet A, Chabannon C, Extra
JM, Jacquemier J, et al: A gene expression signature identifies two
prognostic subgroups of basal breast cancer. Breast Cancer Res
Treat. 126:407–420. 2011. View Article : Google Scholar : PubMed/NCBI
|
|
19
|
Sabatier R, Finetti P, Adelaide J, Guille
A, Borg JP, Chaffanet M, Lane L, Birnbaum D and Bertucci F:
Down-regulation of ECRG4, a candidate tumor suppressor gene, in
human breast cancer. PLoS One. 6:e276562011. View Article : Google Scholar : PubMed/NCBI
|
|
20
|
Chin K, DeVries S, Fridlyand J, Spellman
PT, Roydasgupta R, Kuo WL, Lapuk A, Neve RM, Qian Z, Ryder T, et
al: Genomic and transcriptional aberrations linked to breast cancer
pathophysiologies. Cancer Cell. 10:529–541. 2006. View Article : Google Scholar : PubMed/NCBI
|
|
21
|
Nagalla S, Chou JW, Willingham MC, Ruiz J,
Vaughn JP, Dubey P, Lash TL, Hamilton-Dutoit SJ, Bergh J, Sotiriou
C, et al: Interactions between immunity, proliferation and
molecular subtype in breast cancer prognosis. Genome Boil.
14:R342013. View Article : Google Scholar : PubMed/NCBI
|
|
22
|
Kim SK, Ahn SG, Mun JY, Jeong MS, Bae SJ,
Lee JS, Jeong J, Leem SH and Chu IS: Genomic signature of the
standardized uptake value in 18F-fluorodeoxyglucose
positron emission tomography in breast cancer. Cancers (Basel).
12:4972020. View Article : Google Scholar : PubMed/NCBI
|
|
23
|
Maire V, Baldeyron C, Richardson M, Tesson
B, Vincent-Salomon A, Gravier E, Marty-Prouvost B, De Koning L,
Rigaill G, Dumont A, et al: TTK/hMPS1 is an attractive therapeutic
target for triple-negative breast cancer. PLoS One. 8:e637122013.
View Article : Google Scholar : PubMed/NCBI
|
|
24
|
Langfelder P and Horvath S: WGCNA: An R
package for weighted correlation network analysis. BMC
Bioinformatics. 9:5592008. View Article : Google Scholar : PubMed/NCBI
|
|
25
|
Ritchie ME, Phipson B, Wu D, Hu Y, Law CW,
Shi W and Smyth GK: limma powers differential expression analyses
for RNA-sequencing and microarray studies. Nucleic Acids Res.
43:e472015. View Article : Google Scholar : PubMed/NCBI
|
|
26
|
Yu G, Wang LG, Han Y and He QY:
clusterProfiler: An R package for comparing biological themes among
gene clusters. OMICS. 16:284–287. 2012. View Article : Google Scholar : PubMed/NCBI
|
|
27
|
Szklarczyk D, Gable AL, Lyon D, Junge A,
Wyder S, Huerta-Cepas J, Simonovic M, Doncheva NT, Morris JH, Bork
P, et al: STRING v11: Protein-protein association networks with
increased coverage, supporting functional discovery in genome-wide
experimental datasets. Nucleic Acids Res. 47(D1): D607–D613. 2019.
View Article : Google Scholar : PubMed/NCBI
|
|
28
|
Shannon P, Markiel A, Ozier O, Baliga NS,
Wang JT, Ramage D, Amin N, Schwikowski B and Ideker T: Cytoscape: A
software environment for integrated models of biomolecular
interaction networks. Genome Res. 13:2498–2504. 2003. View Article : Google Scholar : PubMed/NCBI
|
|
29
|
Chin CH, Chen SH, Wu HH, Ho CW, Ko MT and
Lin CY: cytoHubba: Identifying hub objects and sub-networks from
complex interactome. BMC Syst Biol. 8 (Suppl 4):S112014. View Article : Google Scholar : PubMed/NCBI
|
|
30
|
Newman AM, Liu CL, Green MR, Gentles AJ,
Feng W, Xu Y, Hoang CD, Diehn M and Alizadeh AA: Robust enumeration
of cell subsets from tissue expression profiles. Nat Methods.
12:453–457. 2015. View Article : Google Scholar : PubMed/NCBI
|
|
31
|
Li J, Yao J and Qi L: Identification of
TUBB2A as a cancer-immunity cycle-related therapeutic target in
triple-negative breast cancer. Mol Biotechnol. Sep 24–2023.(Epub
ahead of print). View Article : Google Scholar
|
|
32
|
Li L and Li S: miR-205-5p inhibits cell
migration and invasion in prostatic carcinoma by targeting ZEB1.
Oncol Lett. 16:1715–1721. 2018.PubMed/NCBI
|
|
33
|
Goenka A, Khan F, Verma B, Sinha P, Dmello
CC, Jogalekar MP, Gangadaran P and Ahn BC: Tumor microenvironment
signaling and therapeutics in cancer progression. Cancer Commun
(Lond). 43:525–561. 2023. View Article : Google Scholar : PubMed/NCBI
|
|
34
|
Meng L, Wu H, Wu J, Ding P, He J, Sang M
and Liu L: Mechanisms of immune checkpoint inhibitors: Insights
into the regulation of circular RNAS involved in cancer hallmarks.
Cell Death Dis. 15:32024. View Article : Google Scholar : PubMed/NCBI
|
|
35
|
Angrisani A, Di Fiore A, De Smaele E and
Moretti M: The emerging role of the KCTD proteins in cancer. Cell
Commun Signal. 19:562021. View Article : Google Scholar : PubMed/NCBI
|
|
36
|
He H, Peng Y, Fan S, Chen Y, Zheng X and
Li C: Cullin3/KCTD5 induces monoubiquitination of ΔNp63α and
impairs its activity. FEBS Lett. 592:2334–2340. 2018. View Article : Google Scholar : PubMed/NCBI
|
|
37
|
Coppola L, Baselice S, Messina F,
Giannatiempo R, Farina A, Vitagliano L, Smaldone G and Salvatore M:
KCTD15 is overexpressed in her2+ positive breast cancer patients
and its silencing attenuates proliferation in SKBR3 cell line.
Diagnostics (Basel). 12:5912022. View Article : Google Scholar : PubMed/NCBI
|
|
38
|
Rivas J, Diaz N, Silva I, Morales D,
Lavanderos B, Álvarez A, Saldias MP, Pulgar E, Cruz P, Maureira D,
et al: KCTD5, a novel TRPM4-regulatory protein required for cell
migration as a new predictor for breast cancer prognosis. FASEB J.
34:7847–7865. 2020. View Article : Google Scholar : PubMed/NCBI
|
|
39
|
Canales J, Cruz P, Diaz N, Riquelme D,
Leiva-Salcedo E and Cerda O: K+ channel tetramerization
domain 5 (KCTD5) protein regulates cell migration, focal adhesion
dynamics and spreading through modulation of Ca2+
signaling and Rac1 activity. Cells. 9:22732020. View Article : Google Scholar : PubMed/NCBI
|
|
40
|
Bayón Y, Trinidad AG, de la Puerta ML, Del
Carmen Rodriguez M, Bogetz J, Rojas A, De Pereda JM, Rahmouni S,
Williams S, Matsuzawa SI, et al: KCTD5, a putative substrate
adaptor for cullin3 ubiquitin ligases. FEBS J. 275:3900–3910. 2008.
View Article : Google Scholar : PubMed/NCBI
|
|
41
|
Davidge B, Rebola KGO, Agbor LN, Sigmund
CD and Singer JD: Cul3 regulates cyclin E1 protein abundance via a
degron located within the N-terminal region of cyclin E. J Cell
Sci. 132:jcs2330492019. View Article : Google Scholar : PubMed/NCBI
|
|
42
|
Ohtsubo M, Theodoras AM, Schumacher J,
Roberts JM and Pagano M: Human cyclin E, a nuclear protein
essential for the G1-to-S phase transition. Mol Cell Biol.
15:2612–2624. 1995. View Article : Google Scholar : PubMed/NCBI
|
|
43
|
Shi YX, Zhang WD, Dai PH, Deng J and Tan
LH: Comprehensive analysis of KCTD family genes associated with
hypoxic microenvironment and immune infiltration in lung
adenocarcinoma. Sci Rep. 12:99382022. View Article : Google Scholar : PubMed/NCBI
|
|
44
|
Martinez FO and Gordon S: The M1 and M2
paradigm of macrophage activation: Time for reassessment.
F1000Prime Rep. 6:132014. View
Article : Google Scholar : PubMed/NCBI
|
|
45
|
Weng YS, Tseng HY, Chen YA, Shen PC, Al
Haq AT, Chen LM, Tung YC and Hsu HL: MCT-1/miR-34a/IL-6/IL-6R
signaling axis promotes EMT progression, cancer stemness and M2
macrophage polarization in triple-negative breast cancer. Mol
Cancer. 18:422019. View Article : Google Scholar : PubMed/NCBI
|
|
46
|
Fang WB, Yao M, Brummer G, Acevedo D,
Alhakamy N, Berkland C and Cheng N: Targeted gene silencing of CCL2
inhibits triple negative breast cancer progression by blocking
cancer stem cell renewal and M2 macrophage recruitment. Oncotarget.
7:49349–49367. 2016. View Article : Google Scholar : PubMed/NCBI
|
|
47
|
Nguyen LK, Kholodenko BN and von
Kriegsheim A: Rac1 and RhoA: Networks, loops and bistability. Small
GTPases. 9:316–321. 2018. View Article : Google Scholar : PubMed/NCBI
|
|
48
|
Glading A, Lauffenburger DA and Wells A:
Cutting to the chase: Calpain proteases in cell motility. Trends
Cell Biol. 12:46–54. 2002. View Article : Google Scholar : PubMed/NCBI
|
|
49
|
Shi YX, Yan JH, Liu W and Deng J:
Identifies KCTD5 as a novel cancer biomarker associated with
programmed cell death and chemotherapy drug sensitivity. BMC
Cancer. 23:4082023. View Article : Google Scholar : PubMed/NCBI
|