Introduction
Alzheimer's disease (AD), a form of dementia, is one
of the most prevalent neurodegenerative diseases, which imposes a
heavy economic burden on societies around the world (1). The number of people with dementia
worldwide is forecast to increase from 57.4 million cases in 2019
to 152.8 million by 2050, according to the latest global dementia
data (2). The main pathological
symptoms of AD include senile plaques (SP), neurofibrillary tangle
(NFTs) and neuronal loss. Numerous studies have explored the
pathogenesis of AD and reported that the main pathogenetic
mechanisms of AD with important implications for clinical
management are amyloid-β (Aβ) protein plaque-associated
neurodegeneration, neuronal death and loss of synaptic plasticity,
neuroprogenitor degeneration based on NFTs, mitochondrial
dysfunction and the gene mutation hypothesis (e.g., mutations in
the presenilin 1 and 2 genes can make people more susceptible to
AD) (3,4). Due to the association between these
pathogenic mechanisms, some researchers have proposed that several
mechanisms may be involved in the development of AD (5). One of the major areas of research in
this field is to investigate these mechanisms to predict the risk
of AD (6). Another area of
research is the study of the genome as a predictor of AD risk. It
has been shown that the accumulation of dysregulated epigenetic
mechanisms during aging may contribute to the development of AD,
and it is evident that the genome provides important insights into
the molecular mechanisms of AD and is a powerful tool for
predicting the risk of the disease (7). Therefore, it is necessary to develop
an AD risk prediction model based on the exploration of molecular
mechanisms.
Cuproptosis is an essential element that plays an
important role in several metabolic processes in the brain
(8,9). Excessive cuproptosis in the brain of
patients with AD exacerbates oxidative damage and increases the
formation of amyloid plaques and NFTs (10,11).
The neurotoxic effect of cuproptosis is closely related to the
inherent redox properties of Cu2+. Cu2+
overload promotes cuproptosis (12), and Cu2+ and cuproptosis
are closely related to mitochondrial functions (13,14).
Cuproptosis, as a newly discovered independent mode of cell death
characterized by cuproptosis-dependent and mitochondrial
respiratory regulation, can greatly affect mitochondrial functions
(15,16). However, numerous studies have
concluded that mitochondrial dysfunction-induced oxidative stress
and abnormalities in energy metabolism account for a major
pathogenic mechanism of AD (17,18).
Bioinformatics have recently become increasingly important for
exploring the association between cuproptosis and AD, and
cuproptosis-related genes (CRGs) are commonly used for immune
infiltration analysis and the development of diagnostic models
(19). Moreover, nonlinearity,
fault tolerance and real-time operation are among the advantages of
machine learning algorithms that make them suitable for complex
applications (20). Therefore,
machine learning tools are widely used in AD exact calculations
(21).
There are relatively few studies exploring the
potential association between cuproptosis and AD from the
perspective of bioinformatics to develop a prognostic risk model.
Therefore, the present study aims to investigate the association
between CRGs and AD and develop a machine learning-based prognostic
risk model for AD. Another objective of the study is to develop a
cellular model with okadaic acid (OA)-treated SH-SY5Y cells to
validate the expression of the resulting CRGs by the
Aβ25-35 dementia model in simulated rats to propose a
new approach to the diagnosis and prognosis of AD.
Materials and methods
Data collection
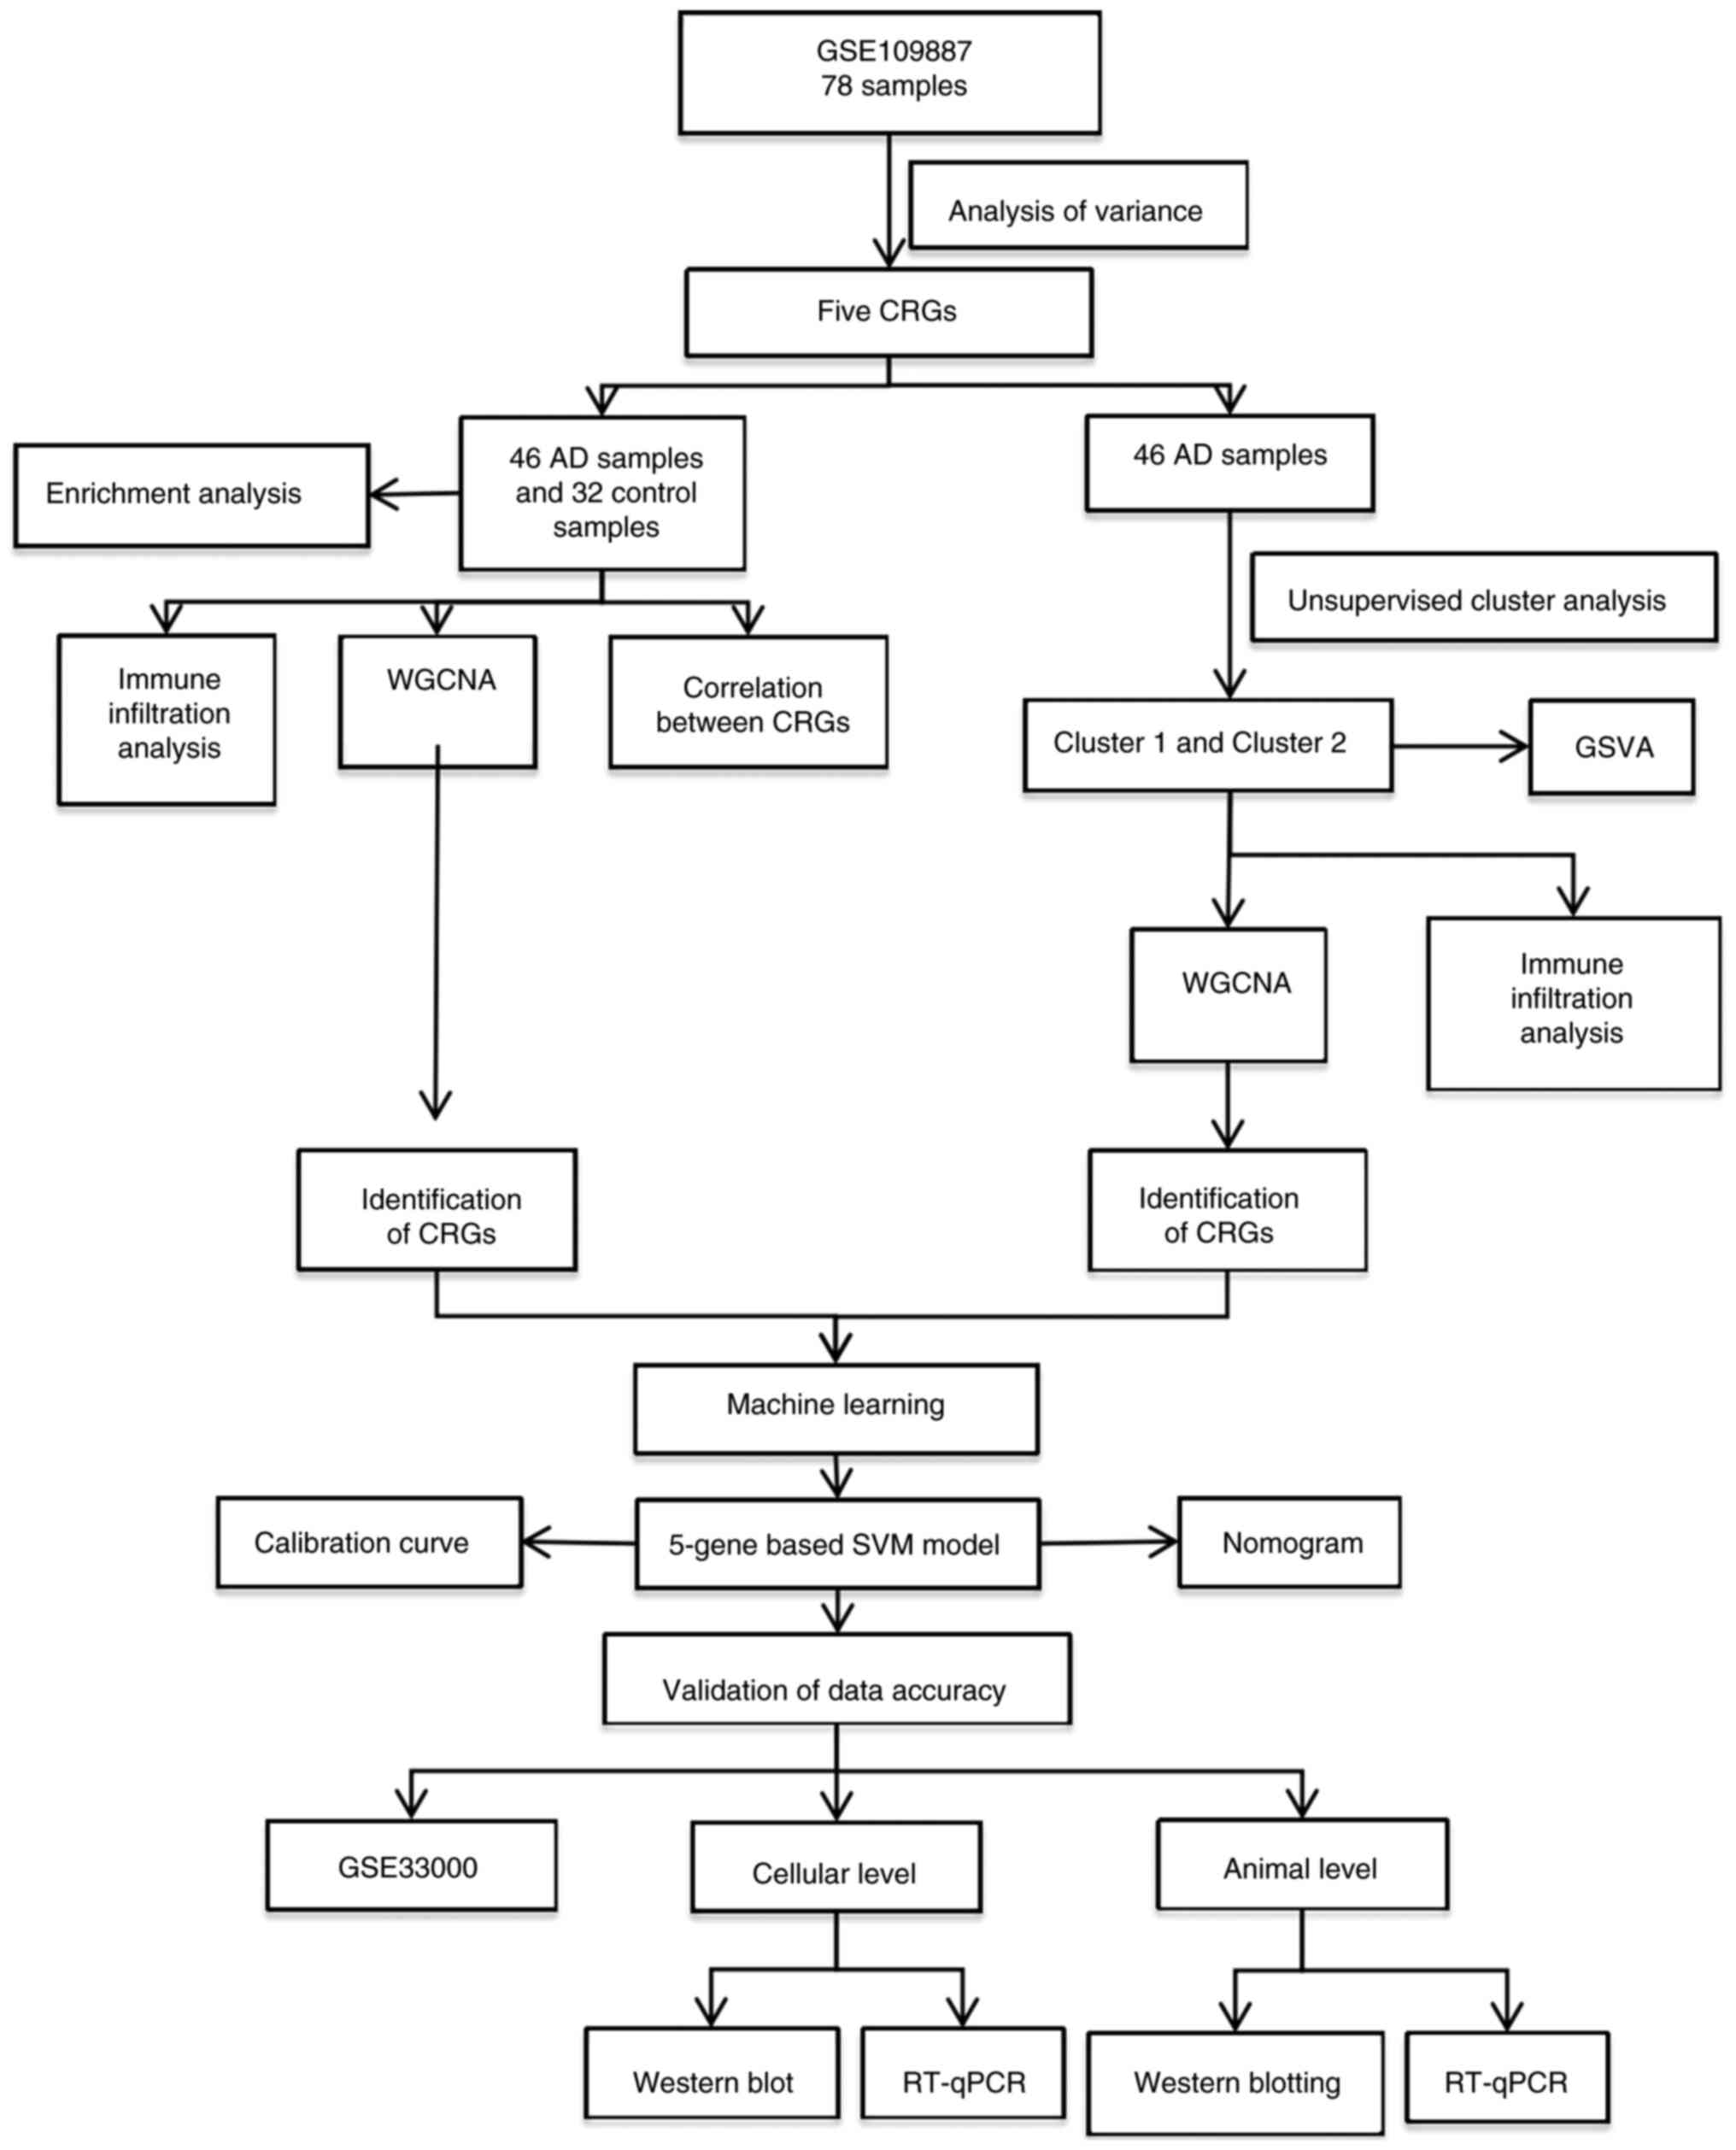
The detailed flow chart of the research process is
shown in Fig. 1. The gene
expression datasets used in the present study are accessible via
the Gene Expression Omnibus (GEO) public database (https://www.ncbi.nlm.nih.gov/geo/). This includes
the GSE109887 dataset based on the GPL10904 platform, which
contains 46 AD samples and 32 control samples (all from human
temporal regression samples) (22), and the GSE33000 dataset based on
the GPL10558 platform, which contains 310 AD samples and 157
control prefrontal cortex samples (23). A total of 16 CRGs were obtained
from the Kyoto Encyclopedia of Genes and Genomes (KEGG) public
website (https://www.genome.jp/kegg/)
(24).
Differential expression analysis and
data processing
Data analysis was performed on the aforementioned
datasets in R 4.2.1 (https://www.r-project.org/). The sva R package was
used to remove batch effects and the limma R package was employed
for differential expression analysis (25,26).
All datasets were then normalized in the preprocessCore R package,
and differential expression analysis was performed in the limma R
package. The threshold for differentially expressed genes (DEGs)
was set at |log-fold change (FC)|>1 and P<0.05. The screened
differential genes were presented using heatmaps and volcano plots,
produced using the R packages ggplot2 and pheatmap.
Enrichment analysis of core
cuproptosis genes
Gene Ontology (GO) and KEGG pathway analyses were
performed on all DEGs as well as five cuproptosis-related hub genes
in the ClusterProfiler R package (https://www.bioconductor.org/packages/release/bioc/html/clusterProfiler.html)
to identify the relevant pathways and biological functions
influenced by DEGs. P<0.05 was considered to indicate a
statistically significant difference.
Evaluation of immune cell
infiltration
The relative abundance of 22 types of immune cells
in each sample was estimated based on gene expression data in the
CIBERSORT R package (27). The
results of the association between CRGs and infiltrating immune
cells were presented using the ‘ggplot2’ R package.
Unsupervised cluster analysis of AD
samples
To assess the evolution of AD, the AD samples were
divided into several clusters using the K-means algorithm with
1,000 iterations. After which, unsupervised cluster analysis was
performed using the ConsensusClusterPlus R package (version 2.60)
(https://www.bioconductor.org/packages/release/bioc/html/ConsensusClusterPlus.html).
Weighted gene co-expression network
analysis (WGCNA)
The WGCNA R package (version 1.72–5; http://cran.r-project.org/web/packages/WGCNA/index.html)
was employed to develop co-expression networks and modules in
healthy individuals and patients with AD to identify key gene
modules associated with AD. The top 50% of genes with the highest
variance were applied to subsequent WGCNA analyses to ensure the
accuracy of qualitative results. A total of 10 co-expression
modules with different colors were obtained using a dynamic cutting
algorithm. A heatmap of the topological overlap matrix (TOM) was
also presented, in which gene dendrograms and module colors were
generated based on gene dissimilarity. The global gene expression
profiles in each module were represented by module signature genes.
Then an appropriate set of genes for each module was filtered by an
algorithm to intersect with the set of differential genes to show
the association.
Gene set variation analysis
(GSVA)
GSVA was performed in the ‘GSVA’ R package to
elucidate the signaling pathways that are differentially enriched
between different groups of CRGs (28). The files ‘c2.cp. Kegg.v7.4.symbols’
and ‘c5.go.bp.v7.5.1.symbols’ were obtained from the MSigDB web
database (https://www.gsea-msigdb.org/gsea/msigdb/index.jsp) for
further GSVA analysis. The ‘limma’ R package was utilized to
compare the GSVA scores between different clusters of CRGs to
identify the differentially expressed pathways and biological
functions.
Nomogram model development and
validation
A nomogram model was developed for the clinical
diagnosis of AD in the RMS R package (https://hbiostat.org/r/rms/). The ‘DALEX’ software
package (https://modeloriented.github.io/DALEX/) was employed
to plot the residual distributions of each model in the test
dataset. Each predictor gene received a score based on the level of
gene expression for each patient's clinical trait, where the ‘total
score’ represents the sum of the scores of the predictors. The risk
of disease is assessed based on the score given to each predictive
gene, and the sum forms the scoring system. Calibration curves and
decision curve analysis (DCA) were used to estimate the predictive
power of the nomogram model.
Machine learning and prognostic
modeling
Models such as the Random Forest Model (RF), Support
Vector Machine Model (SVM), Generalized Linear Model (GLM) and
Extreme Gradient Boosting (XGB) were developed using the DEGs of
two different clusters of CRGs and the intersecting genes of AD.
The best machine learning model was identified based on the highest
ROC values of the aforementioned models. Accordingly, the SVM and
the first five important variables were considered the key
predictive genes associated with AD. Finally, the diagnostic value
of the model was validated by assessing its accuracy based on the
GSE33000 dataset.
Animals and the construction of AD
models
A total of 30 male Sprague-Dawley rats, (SPF-grade;
8 months old; 220–240 g), were purchased from Beijing Vital River
Laboratory Animal Technology Co., Ltd. The rats were housed and
given ad libitum access to the crop cobalt 60 maintenance
rat food diet (Zhiyuan Biomedical Technology Co., Ltd.) and water,
modeled, and administered in an SPF-grade laboratory at the Animal
Experimentation Center of Youjiang Medical University For
Nationalities (Baise, China). The SPF-grade laboratory was equipped
with a 12/12 h alternating light and dark barrier system, and its
ambient temperature and relative humidity were 25°C and 60–70%,
respectively. Rats were housed until they reached 12 months of age
for brain stereotactic injection experiment. The present study
received ethical approval for the use of experimental animals from
Youjiang Medical University For Nationalities (Baise, China;
approval no. 2023040101), and all relevant guidelines were followed
throughout the experiment.
The rats were randomly divided into the model,
saline and normal control groups (n=10). After weighing, the
animals were anesthetized with 2% isoflurane (cat. no. hsc-454-5;
Shenzhen Reward Life Technology Co., Ltd.) using a Reward R500
general-purpose small animal anesthesia machine. After which, the
rats were placed on a sterile surgical table, and their head was
fixed with a stereotaxic apparatus to monitor the respiratory rate.
If the respiratory rate remained stable, a stereotaxic injection
was performed after the head of the rat was fixed appropriately.
Animals in the model group were treated with 1 µl
Aβ25-35 (Glpbio Technology, Inc.; cat. no. GP10082) on
each side of the hippocampus (29,30),
whereas those in the saline group were injected with an equal
amount of normal saline into each side of the hippocampus. Each rat
was administered the injection for a period of 5 min. Following
this, the needle was left in situ for a further 5 min to
prevent the drug from spilling out and evaporating, thereby
achieving a less than optimal modelling effect. Those in the normal
control group received no surgical treatment. In addition, 100,000
U/g/day of penicillin was injected into each animal for 7 days
after surgery to prevent postoperative infections.
Morris water maze (MWM) test
The MWM test was performed using the DigBehv-MG
model (Shanghai Jiliang Software Technology Co., Ltd.) (31). The localization and navigation test
lasted for 4 days, and each rat was trained 4 times per day. The
animals were submerged from the entry point that faced the pool
wall, and the time it took to find the platform within 1 min was
recorded (escape latency). If a subject failed to find the platform
within 1 min, the rat was guided with a glass rod to stand on the
platform and remain there for 10 sec to achieve the training
purpose; the escape latency for that subject was considered to be 1
min. A total of 2 days after the localization and navigation tests,
the platform in the pool was removed and the furthest quadrant of
the original platform was taken as the entry point. After which,
the rats in each group (the model, saline and normal control
groups) were submerged in the water while facing the wall from the
entry point, and the escape latency was recorded within 1 min.
Moreover, the subjects were submerged in the water from the entry
point toward the wall of the pool, and the swimming time and the
number of times that the rats crossed the original platform within
1 min were recorded. All subjects were acclimatized overnight
before the experiments.
RNA extraction and RT-qPCR to verify
the differential expression of CRG mRNA in the AD rat model
On the second day of the MWM test, the animals were
anaesthetized [anesthesia was induced at a low concentration (2%)
of isoflurane and then increased to a high concentration (5%)] for
euthanasia. Prior to euthanasia, it was essential to check the
functioning of the gas anesthesia device (Shenzhen Reward Life
Technology Co. cat. no. R550IP; Shenzhen Reward Life Technology
Co., Ltd.). This was achieved by connecting the system, which
consists of the pressure gauge, pressure reducer and controller, to
the euthanasia box. The controller power and CO2
cylinder switch must then be activated. It is essential that no
CO2 is injected into the euthanasia box before the
animal is introduced. Once the aforementioned checks were
completed, the rats were placed in the euthanasia box.
CO2 was infused into the box at a rate of 30% vol/min
until the box was 100% filled with CO2 for a period of 2
min. Before terminating procedure, it was ensured that the animal
was still, not breathing and the pupils were dilated. Once these
conditions were met, the CO2 cylinder was switched off
and the animal was observed for a further 11 min. If the animal did
not regain consciousness during this period, it was considered to
have been successfully euthanized.
The rat hippocampus tissue samples were weighed and
stored at −80°C. To extract RNA from the brain tissue samples, 30
mg of weighed brain tissue samples were taken from each group.
After which, centrifuge tubes were filled with the appropriate
amount of TRIZOL® reagent (Thermo Fisher Scientific,
Inc.; cat. no. 15596026) to extract the total RNA samples based on
the mass of the weighed brain tissue samples. The Third Generation
Variable Speed Tissue Mill (Tiangen Biotech Co., Ltd.) was used to
grind the brain tissue samples in the centrifuge tubes until the
brain tissue was completely dissolved in the TRIZOL®
reagent. After which, the samples were left on ice for 5 min for
subsequent experimentation. RNA was reverse-transcribed into cDNA
using the ToloScript All-in-one RT EasyMix for qPCR Kit (cat. no.
22107; Tolo Biotech Co., Ltd.). The results were analyzed in a
Light Cycle 96 real-time fluorescence PCR instrument (Roche Applied
Science) using the SYBR Green qPCR Mix Kit (cat. no. 22204-1; Tolo
Biotech Co., Ltd.). Thermocycling conditions were as follows:
Pre-templating at 94°C for 3 min; followed by 25 cycles at 94°C for
30 sec, 50°C for 30 sec and 72°C for 1 min; and a final extension
step at 72°C for 5 min. The mRNA expression of the genes related to
cuproptosis was determined in a Light Cycle 96 real-time
fluorescence quantitative PCR instrument (Roche Applied Science).
GAPDH was the endogenous control gene, and the primers used for
amplification are displayed in Table
I. The results were quantified using the 2−ΔΔCq
method (32).
 | Table I.Primer sequences used for
RT-qPCR. |
Table I.
Primer sequences used for
RT-qPCR.
| Gene name | Primer sequences
(5′-3′) |
|---|
| GAPDH | F:
GACATGCCGCCTGGAGAAAC |
| GAPDH | R:
AGCCCAGGATGCCCTTTAGT |
| DLD | F:
CATTTCAATCGGCTGTCTCA |
| DLD | R:
CAAGCATGTTCCTCCTAGTGTT |
| GLS | F:
CTGAACGAGAAAGTGGAGACCGAA |
| GLS | R:
TGGGCAGAAACCGCCATTAG |
| PDHB | F:
GCATTTGAACTTCCCACAGA |
| PDHB | R:
TTCCCTCCTTAGACAATACAGC |
| DBT | F:
ACGTGTGCTCTGTGGGTTATC |
| DBT | R:
GCTGTCAAACTGAGACACCG |
| FDX1 | F:
TGGTGAAACGCTAACGACCA |
| FDX1 | R:
CAAGCCAAAGTCCCCTCACA |
Protein extraction and western
blotting verification of the differential expression of CRGs in a
rat model of AD
A total of 50 mg brain tissue was taken from each
group. The Third Generation Variable Speed Tissue Mill (Tiangen
Biotech Co., Ltd.) was used to grind the brain tissue samples in
centrifuge tubes until they were completely dissolved in the RIPA
lysis buffer (cat. no. PC101; Epizyme Biotech Co., Ltd.). The
samples were then lysed on ice for 30 min, and centrifuged at
12,000 × g for 30 min at 4°C to remove the supernatant. The steps
were performed according to the mass of the sample. The protein
concentration was determined by the BCA protein assay. Separation
gels were prepared according to the molecular weight of the target
protein. The samples were boiled in 4X protein uploading buffer for
5 min and protein samples (20 µg/lane) were separated by SDS-PAGE
on 10% gels. The upper gel was electrophoresed at 80 V for 30 min,
while the lower gel was electrophoresed at 120 V for 90 min. A
current of 250 mA was applied for 80 min for the membrane transfer
process. After the transfer was completed, the nitrocellulose
membrane was sealed with protein-free rapid closure solution (1X)
(cat. no. PS108P; Epizyme Biotech Co., Ltd.) for 20 min at room
temperature, and was washed three times with 20X TBS-1% Tween-20
(TBST) buffer (50+950 ml purified water; 10 min/wash).
Subsequently, the membrane was incubated overnight at 4°C with the
following primary antibodies: Anti-GAPDH (36 kDa; 1:5,000;
Proteintech; cat. no. 0494-1-AP), anti-renal glutaminase A/highly
activated glutaminase isoform C [glutaminase (GLS); 65 kDa;
1:5,000; cat. no. 12855-1-AP; Proteintech Group, Inc.],
anti-dihydrolipoamide dehydrogenase (DLD; 56 kDa; 1:5,000; cat. no.
16431-1-AP; Proteintech Group, Inc.), anti-pyruvate dehydrogenase
E1 subunit β (PDHB; 34 kDa; 1:5,000; cat. no. 14744-1-AP;
Proteintech Group, Inc.) and anti-dihydrolipoamide branched chain
transacylase E2 (DBT; 53 kDa; 1:3,000; cat. no. 12451-1-AP;
Proteintech Group, Inc.). After which, the membrane was washed
three times with TBST for 10 min each time. The HRP-conjugated
Affinipure Goat Anti-Rabbit IgG(H+L) (cat. no. SA00001-2;
Proteintech Group, Inc.) was incubated with the sample at a
dilution ratio of 1:5,000 for 1 h at room temperature, and then the
sample was washed three times with TBST for 10 min each time. Each
membrane was placed in a fully automated chemiluminescence gel
imager for color development after 200 µl of the ultrasensitive
luminescence solution (A: B formulated at 1:1; Monad Biotech, Co.,
Ltd.; cat. no. PW30701S) was prepared. GAPDH was selected as the
endogenous control protein. Western blot semi-quantification was
performed using ImageJ (v. 1.54d; National Institutes of
Health).
STR identification statement for
SH-SY5Y cells
The genomic DNA of the SH-SY5Y cell line was
sequenced, and the STR results showed good typing results for the
cell line. Furthermore, no cross contamination of human cells was
found in this cell line as seen in the STR typing results.
Moreover, the DNA typing result of this cell line 100% matched with
the cell typing result of SH-SY5Y in the cell bank.
Cell culture and AD model
development
SH-SY5Y cells were purchased from Wuhan Pronocell
Life Science Technology Co., Ltd., and OA for AD cell modelling was
purchased from MedChemExpress (cat. no. 209266-80-8) (33). SH-SY5Y cells were incubated in a
cell culture containing 5% CO2 at 37°C. The complete
medium used for the culture of the cells was a combination of
Dulbecco Modified Eagle medium with F-12 (Gibco; Thermo Fisher
Scientific, Inc.), 14% Sigma Australia Fetal Bovine Serum
(Sigma-Aldrich; Merck KGaA) and a 1% penicillin-streptomycin
(Beijing Solarbio Science & Technology Co., Ltd.) solution
mixture. The cells in the control group were cultured to 85–90%
density in complete medium without drugs and then used for
experiments. The cells in the DMSO group were first cultured to
85–90% density in complete medium without drugs, and then cultured
in complete medium containing a low concentration of DMSO
[consistent with the concentration of DMSO contained in the AD
group (0.000625% DMSO/ml of medium)] for 24 h and then used for
experiments. The cells in the AD group were first cultured to
85–90% density in complete medium without drugs, and then cultured
in complete medium containing OA concentration of 25 nM for 24 h
and then used for experiments. The OA was dissolved with DMSO to
formulate 40 µmol/l OA mother liquor, and 20 µl OA mother liquor
was taken and mixed with 180 µl 10% DMSO (diluted in enzyme-free
sterile water) to formulate 4 µmol/l OA working solution, which was
stored at 4°C. Using the aforementioned complete medium, SH-SY5Y
cells were diluted to a density of 1×10⁵ ml and 200
µl/well cell suspension was inoculated in 96-well plates. Each well
received a full medium supplemented with OA solutions at
concentrations of 0, 10, 20, 40 and 80 nmol/l after 24 h at 37°C
and 5% CO2, and there were four replicates for each
concentration.
To compare the effects of different OA
concentrations on the proliferation of SH-SY5Y cells after 24 h,
CCK-8 reagent (20 µl; cat. no. C6005M; Suzhou Youyi Landi
Biotechnology Co., Ltd.) was added to each well and incubated for 2
h in 5% CO2 at 37°C. The absorbance values at 450 nm
were measured using a BIOBASE-EL10A enzyme marker (BIOBASE Group)
(34). The experiment was
conducted three times, and the optimal drug concentration of 25 nM
for OA-induced AD in the cell model was found by monitoring the
cell growth under a fluorescence microscope and calculating the
absorbance values. The viability of cells in response to an optimal
OA concentration of 25 nM was also measured using the CCK-8 assay.
First, the cells were seeded into a 96-well plate and incubated for
24 h, after which, the medium was changed in each well (one group
was treated with complete medium only and the other was treated
with complete medium containing 25 nM OA) for 24 h. Subsequently,
the cells were incubated with CCK-8 reagent for 2 h. The
experimental incubation conditions were all performed in an
atmosphere containing 5% CO2 at 37°C. This assay was
repeated three times in four replicates.
RNA extraction and RT-qPCR to verify
the differential expression of CRG mRNA in SH-SY5Y cells
Total RNA samples were extracted by adding
TRIZOL® reagent to the cell samples of the model group,
which were induced with 25 nM of OA, cell samples from the DMSO
group cultured with the same concentration of DMSO as OA in the
model group, and cell samples of the control group, which received
no treatment. The subsequent RT-qPCR protocol was the same as
aforementioned in the animal studies. GAPDH was selected as the
endogenous control gene, and the primers used for amplification are
displayed in Table II.
| Table II.Primer sequence for RT-qPCR. |
Table II.
Primer sequence for RT-qPCR.
| Gene names | Primer sequences
(5′-3′) |
|---|
| GAPDH | F:
GAAGGCTGGGGCTCATTT |
| GAPDH | R:
CAGGAGGCATTGCTGATGAT |
| DLD | F:
GTGATTTACACACACCCTGA |
| DLD | R:
GTCTGTCGATTTCTGCCCAA |
| GLS | F:
CTGAGCCCTGAAGCAGTTCG |
| GLS | R:
AGGAGACCAGCACATCATACCC |
| PDHB | F:
GTGTCTGGCTTGGTGCGGAG |
| PDHB | R:
ACCTTGTATGCCCCATCATACTG |
| DBT | F:
CCATTGCATTTGCTCGTGGA |
| DBT | R:
ACCCTGCTCAGTATCCATTGC |
| FDX1 | F:
CTTGTTCAACCTGTCACCTCATCT |
| FDX1 | R:
CAGCCACTGTTTCAGGCACTC |
Protein extraction and western
blotting verification of differential expression of CRGs in SH-SY5Y
cells
Western blotting was performed to assess the
expression of proteins in different groups of cells (control group
and AD group), with GAPDH as the endogenous reference protein. The
culture flasks were washed with pre-cooled PBS, the cells were
collected using a cell spatula and centrifuged in a 15-ml tube at
1,200 rpm for 5 min. The centrifuge tube was filled with RIPA lysis
buffer, protein phosphatase inhibitor mixture and protease
inhibitor (100:1:1) and lysed on ice for 30 min. The subsequent
western blotting protocol was the same as aforementioned in the
animal studies.
Statistical analysis
The data were processed and statistically analyzed
in R software version 4.2.1, ImageJ 1.54d, SPSS version 25 (IBM
Corporation), and GraphPad Prism version 9.0 (Dotmatics). Unpaired
Student's t-test was used to determine the differences between the
two experimental groups, whereas one- or two-way analyses of
variance (ANOVA) were used to compare differences between three or
more groups. Tukey's post hoc test was used after one-way ANOVA and
Bonferroni post hoc test was used after two-way ANOVA. All data
were presented as mean ± SD. P<0.05 was considered a indicate a
statistically significant difference.
Results
Identification of DEGs
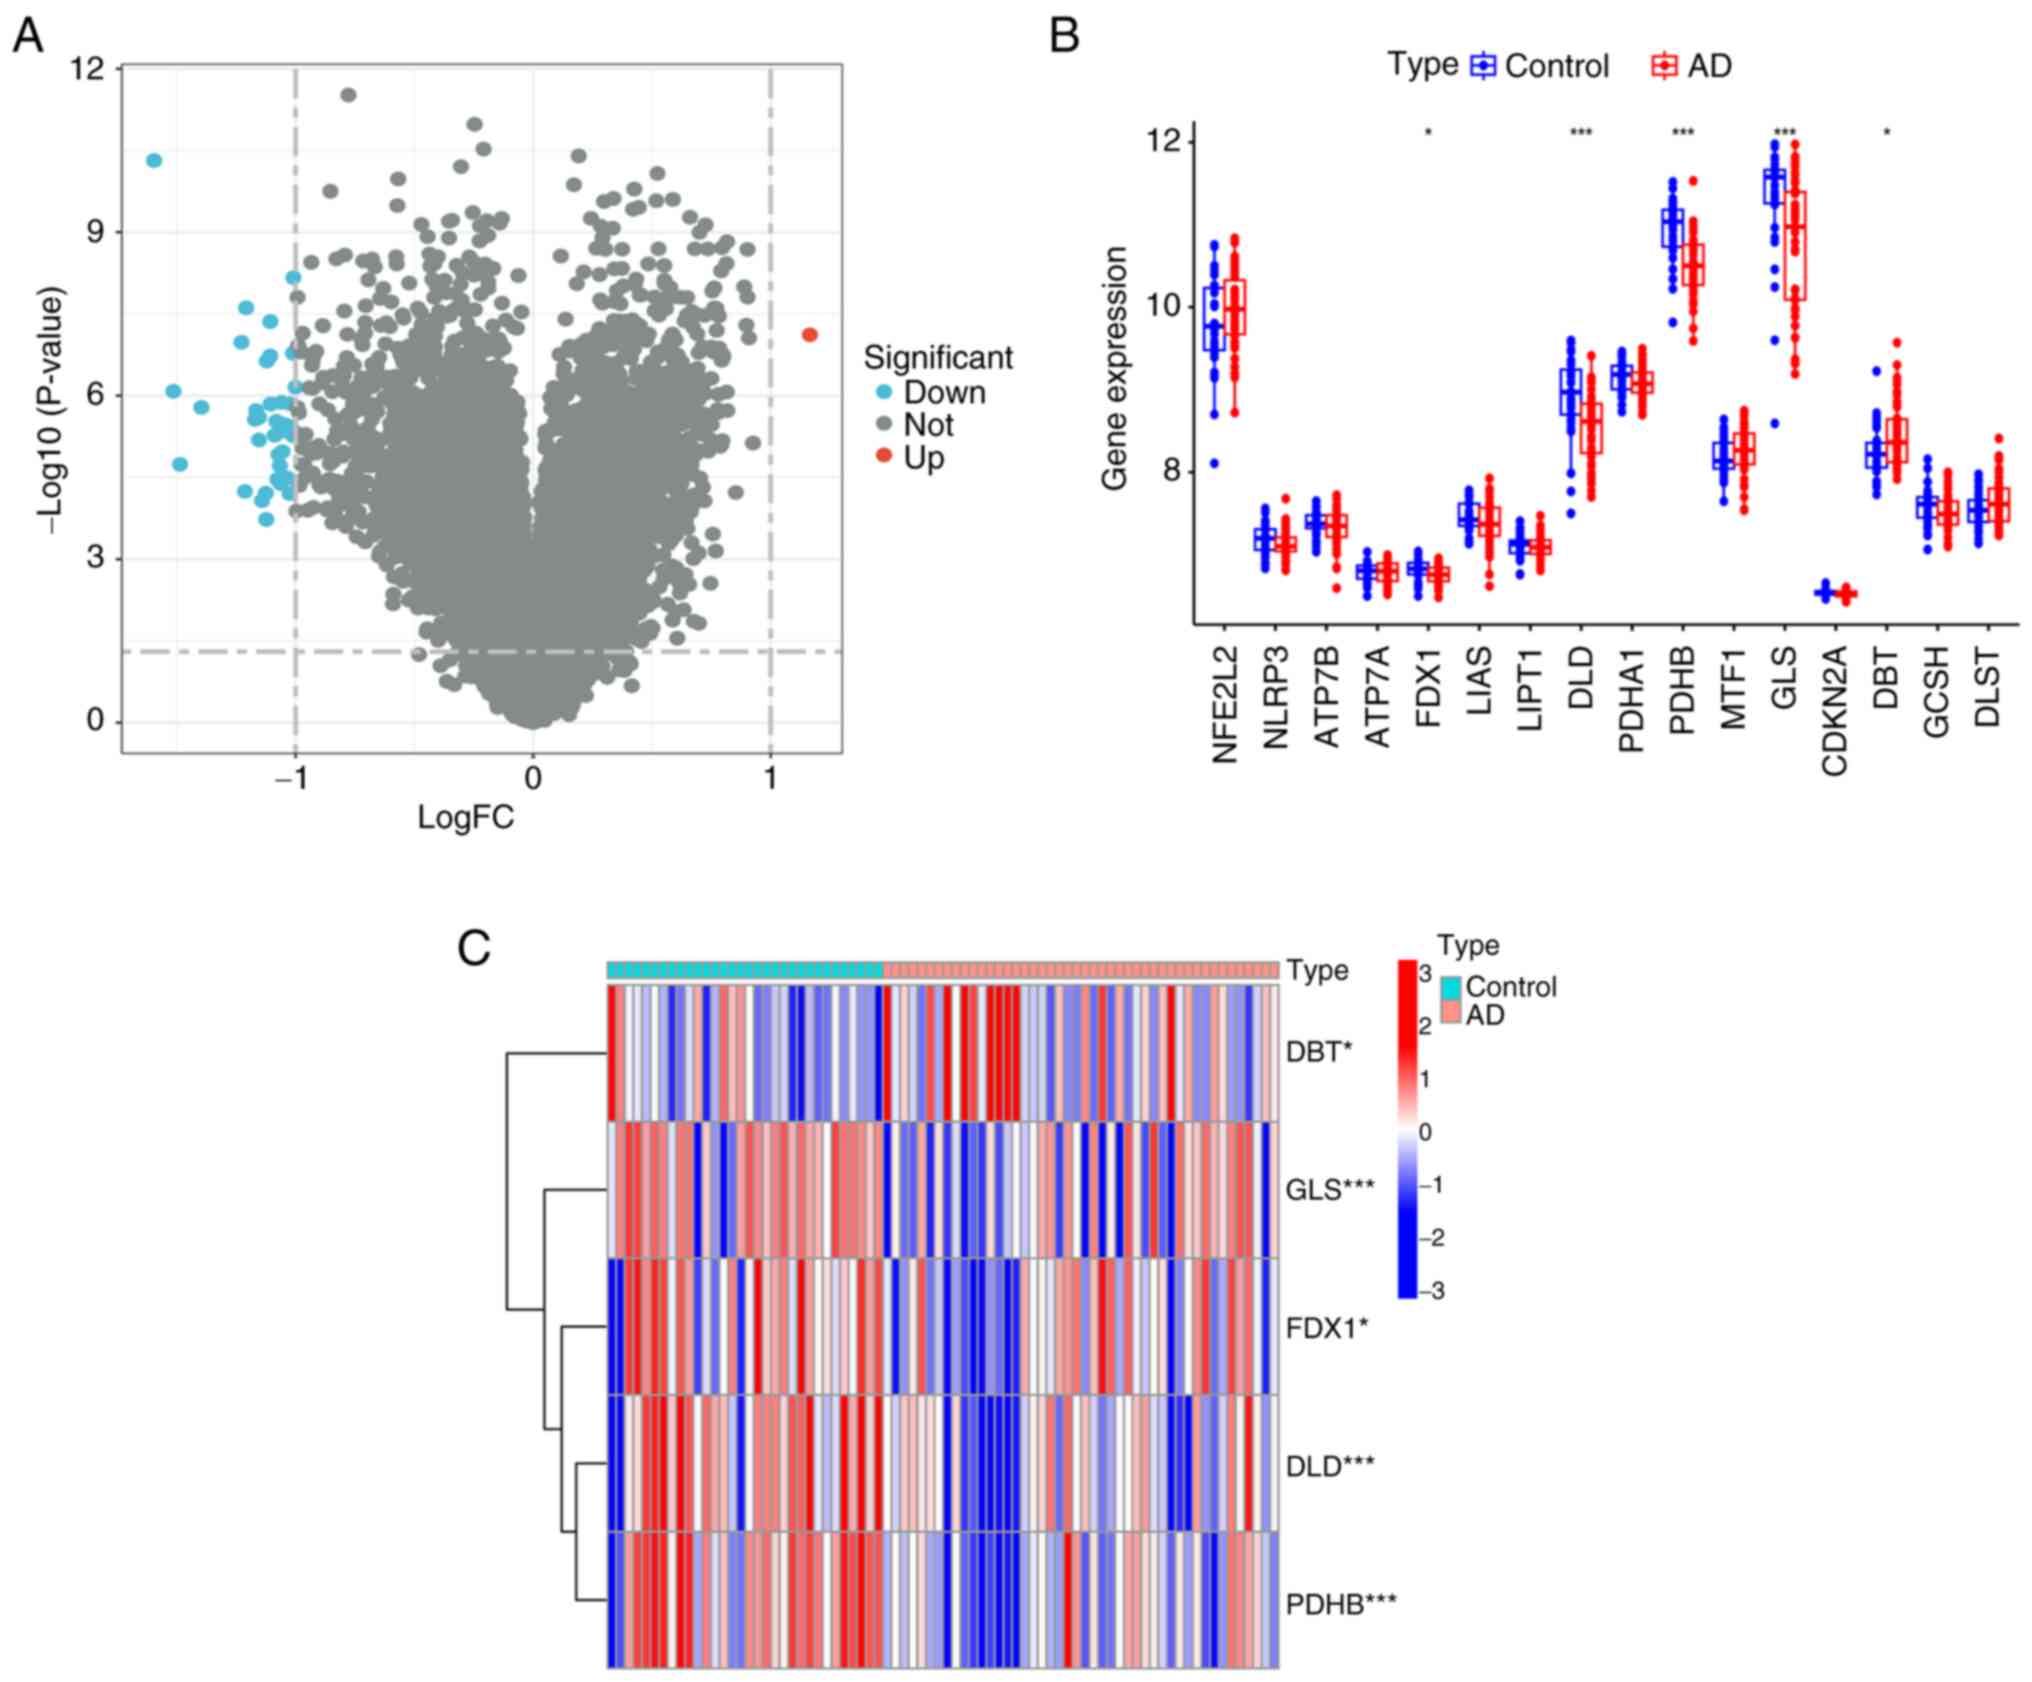
The present study analyzed gene expression array
data from 78 human-derived temporal regression samples from the GEO
database. Fig. 2A presents a
volcano plot showing the 78 DEGs after screening, including one
upregulated and four downregulated expressed genes (Fig. 2B). Fig. 2C shows a heatmap of the five
differentially expressed related genes. Characterized genes were
screened by differential expression analysis.
Biological function analysis of
cuproptosis-related core genes
The obtained differentially expressed CRGs underwent
GO analysis. Regarding biological processes, the differentially
expressed CRGs were mainly enriched in the ‘cellular amino acid
catabolic process’, while the cellular components they were mainly
enriched in were the ‘mitochondrial matrix’ and ‘oxidoreductase
complex’. In terms of molecular function, the differentially
expressed CRGs were enriched in the ‘oxidoreductase activity,
acting on the aldehyde or oxo group of donors, NAD or NADP as
acceptor’ and ‘oxidoreductase activity, acting on the aldehyde or
oxo group of donors’ (Fig. 3A).
According to the KEGG enrichment analysis, the differentially
expressed CRGs were mainly involved in ‘lipoic acid metabolism’,
‘citrate cycle (TCA cycle)’, ‘propanoate metabolism’, ‘pyruvate
metabolism’, ‘valine, leucine and isoleucine degradation’,
‘glycolysis/gluconeogenesis’ and ‘carbon metabolism’ (Fig. 3B).
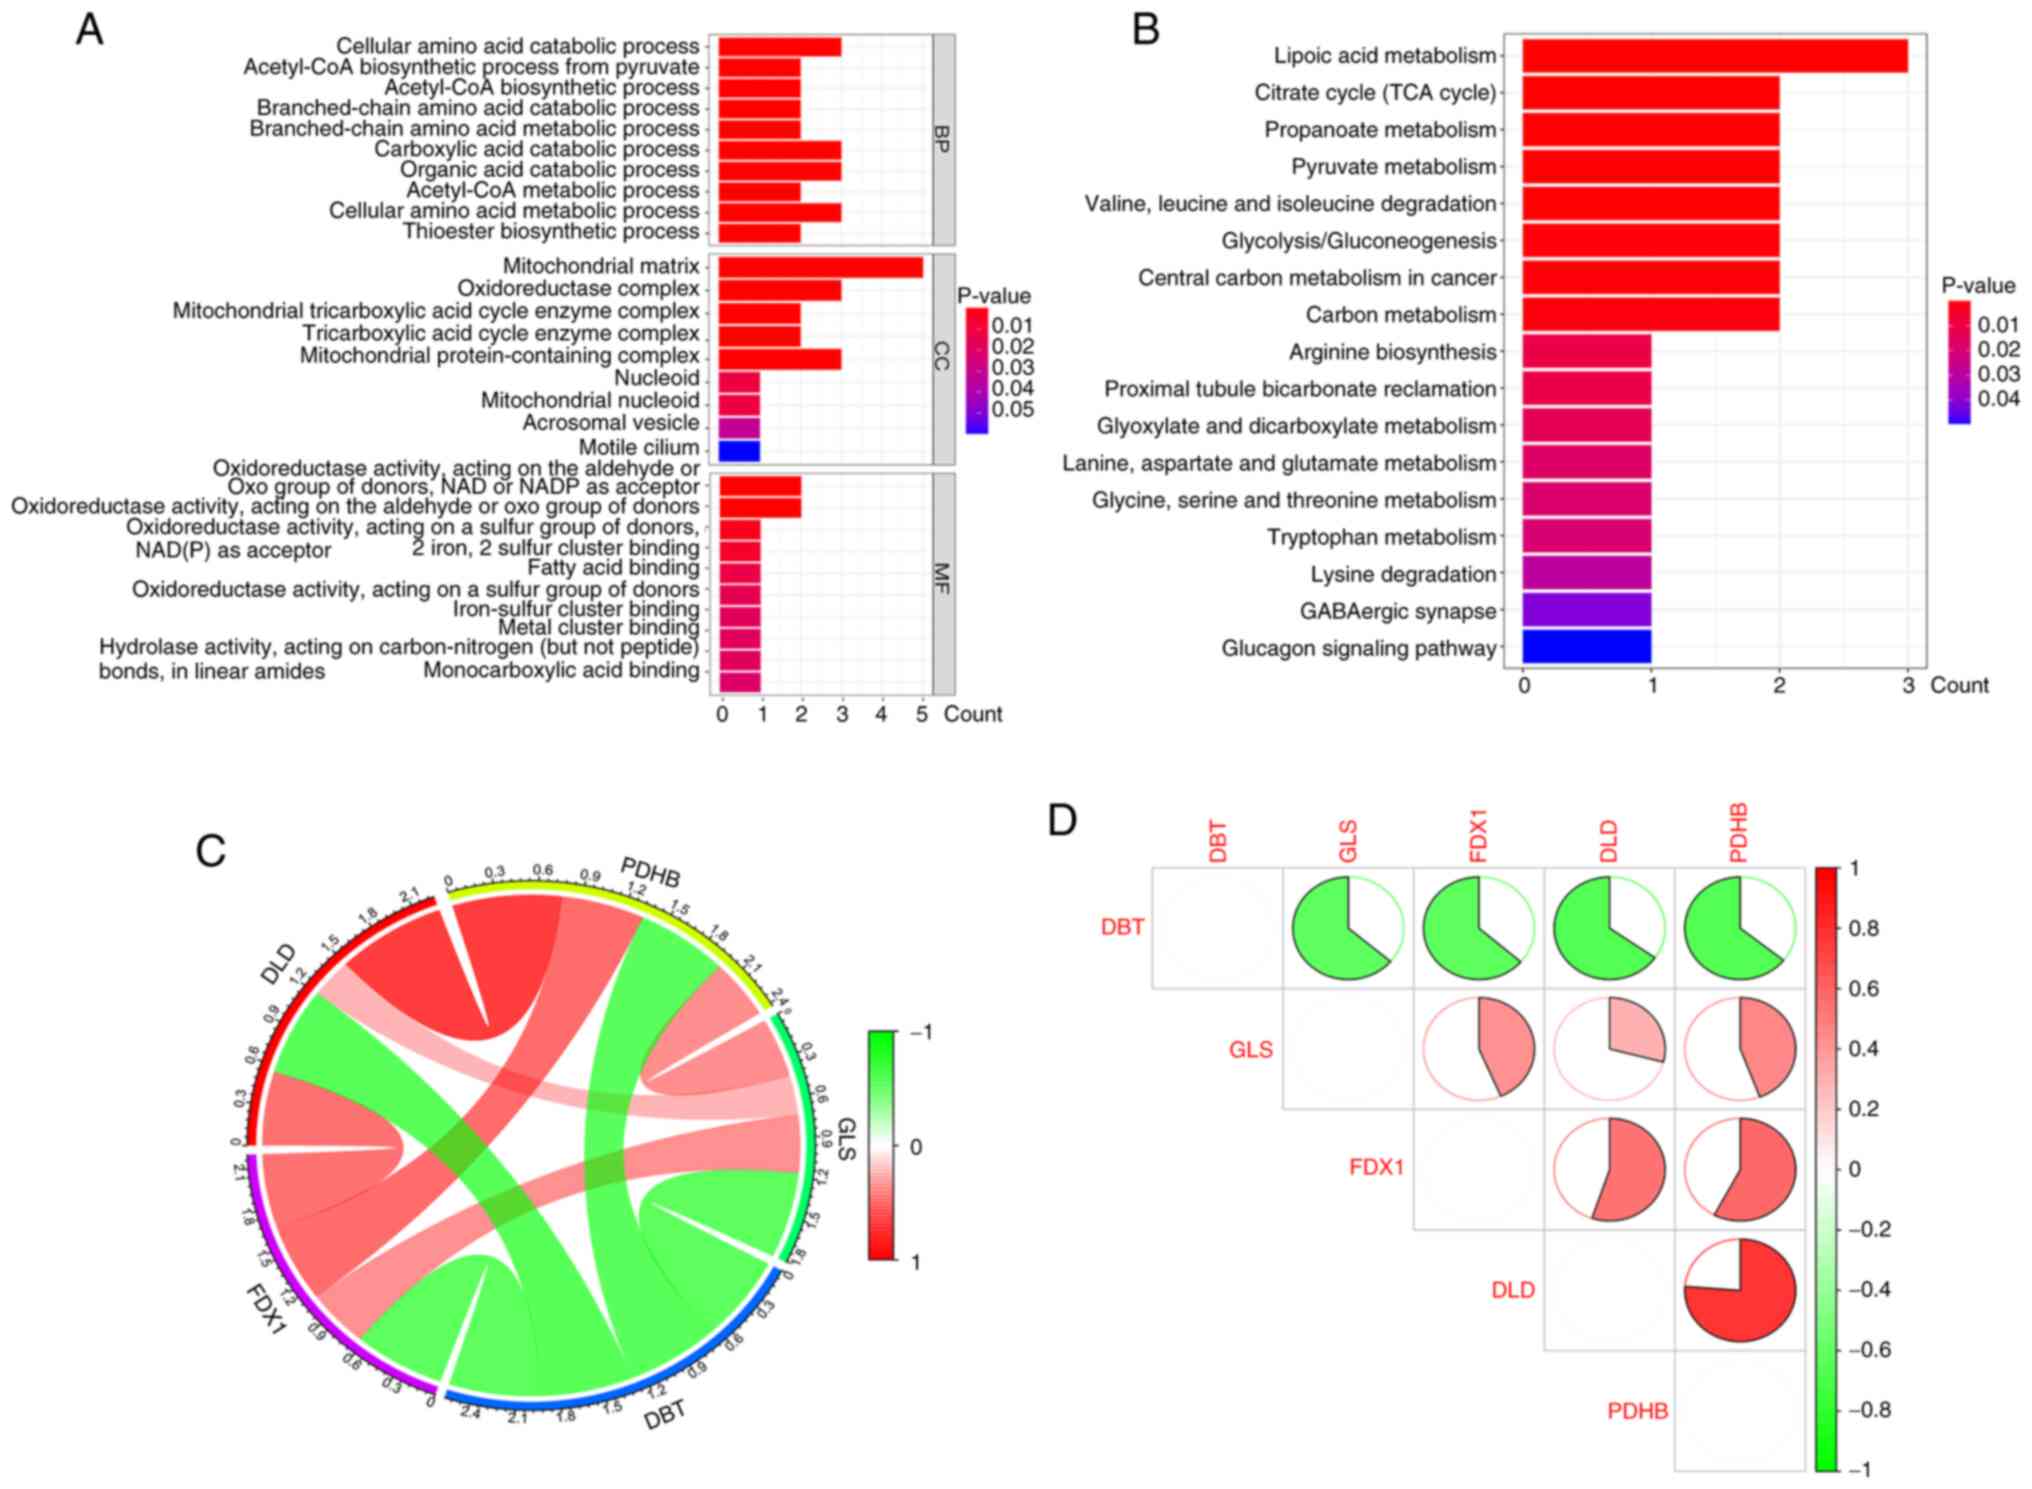 | Figure 3.GO and KEGG pathway enrichment
analysis and correlation analysis of CRGs in AD. (A) Results of GO
enrichment analysis of CRGs are shown by bar graph display. (B)
KEGG pathway enrichment results are shown as bar graphs. (C) Pie
chart of gene correlation of five CRGs. (D) Correlation analysis of
the five differentially expressed CRGs. Green and red colors
indicate negative and positive correlations, respectively.
Correlation coefficients are labeled with the area of pie charts.
GO, Gene Ontology; KEGG, Kyoto Encyclopedia of Genes and Genomes;
CRG, core cuproptosis genes; DLD, dihydrolipoamide dehydrogenase;
FDX1, ferredoxin 1; GLS, glutaminase; PDHB, pyruvate dehydrogenase
E1 subunit β; DBT, dihydrolipoamide branched chain transacylase E2;
AD, Alzheimer's disease. |
Correlation analysis of
cuproptosis-related core genes
Subsequently, enrichment and correlation analyses
were performed on the obtained CRGs to explore whether they play a
relevant role in the development of AD. The results of the
enrichment analysis, GO analysis and KEGG analysis indicated that
several genes, such as PDHB and DLD, showed synergistic effects,
but DBT and the remaining four genes showed significant
antagonistic effects (Fig. 3C). In
addition, further investigation of the correlation patterns of
these CRGs revealed that both DBT and DLD were significantly
correlated with other modulators (Fig.
3D).
Immune infiltration cell analysis of
cuproptosis-related core genes
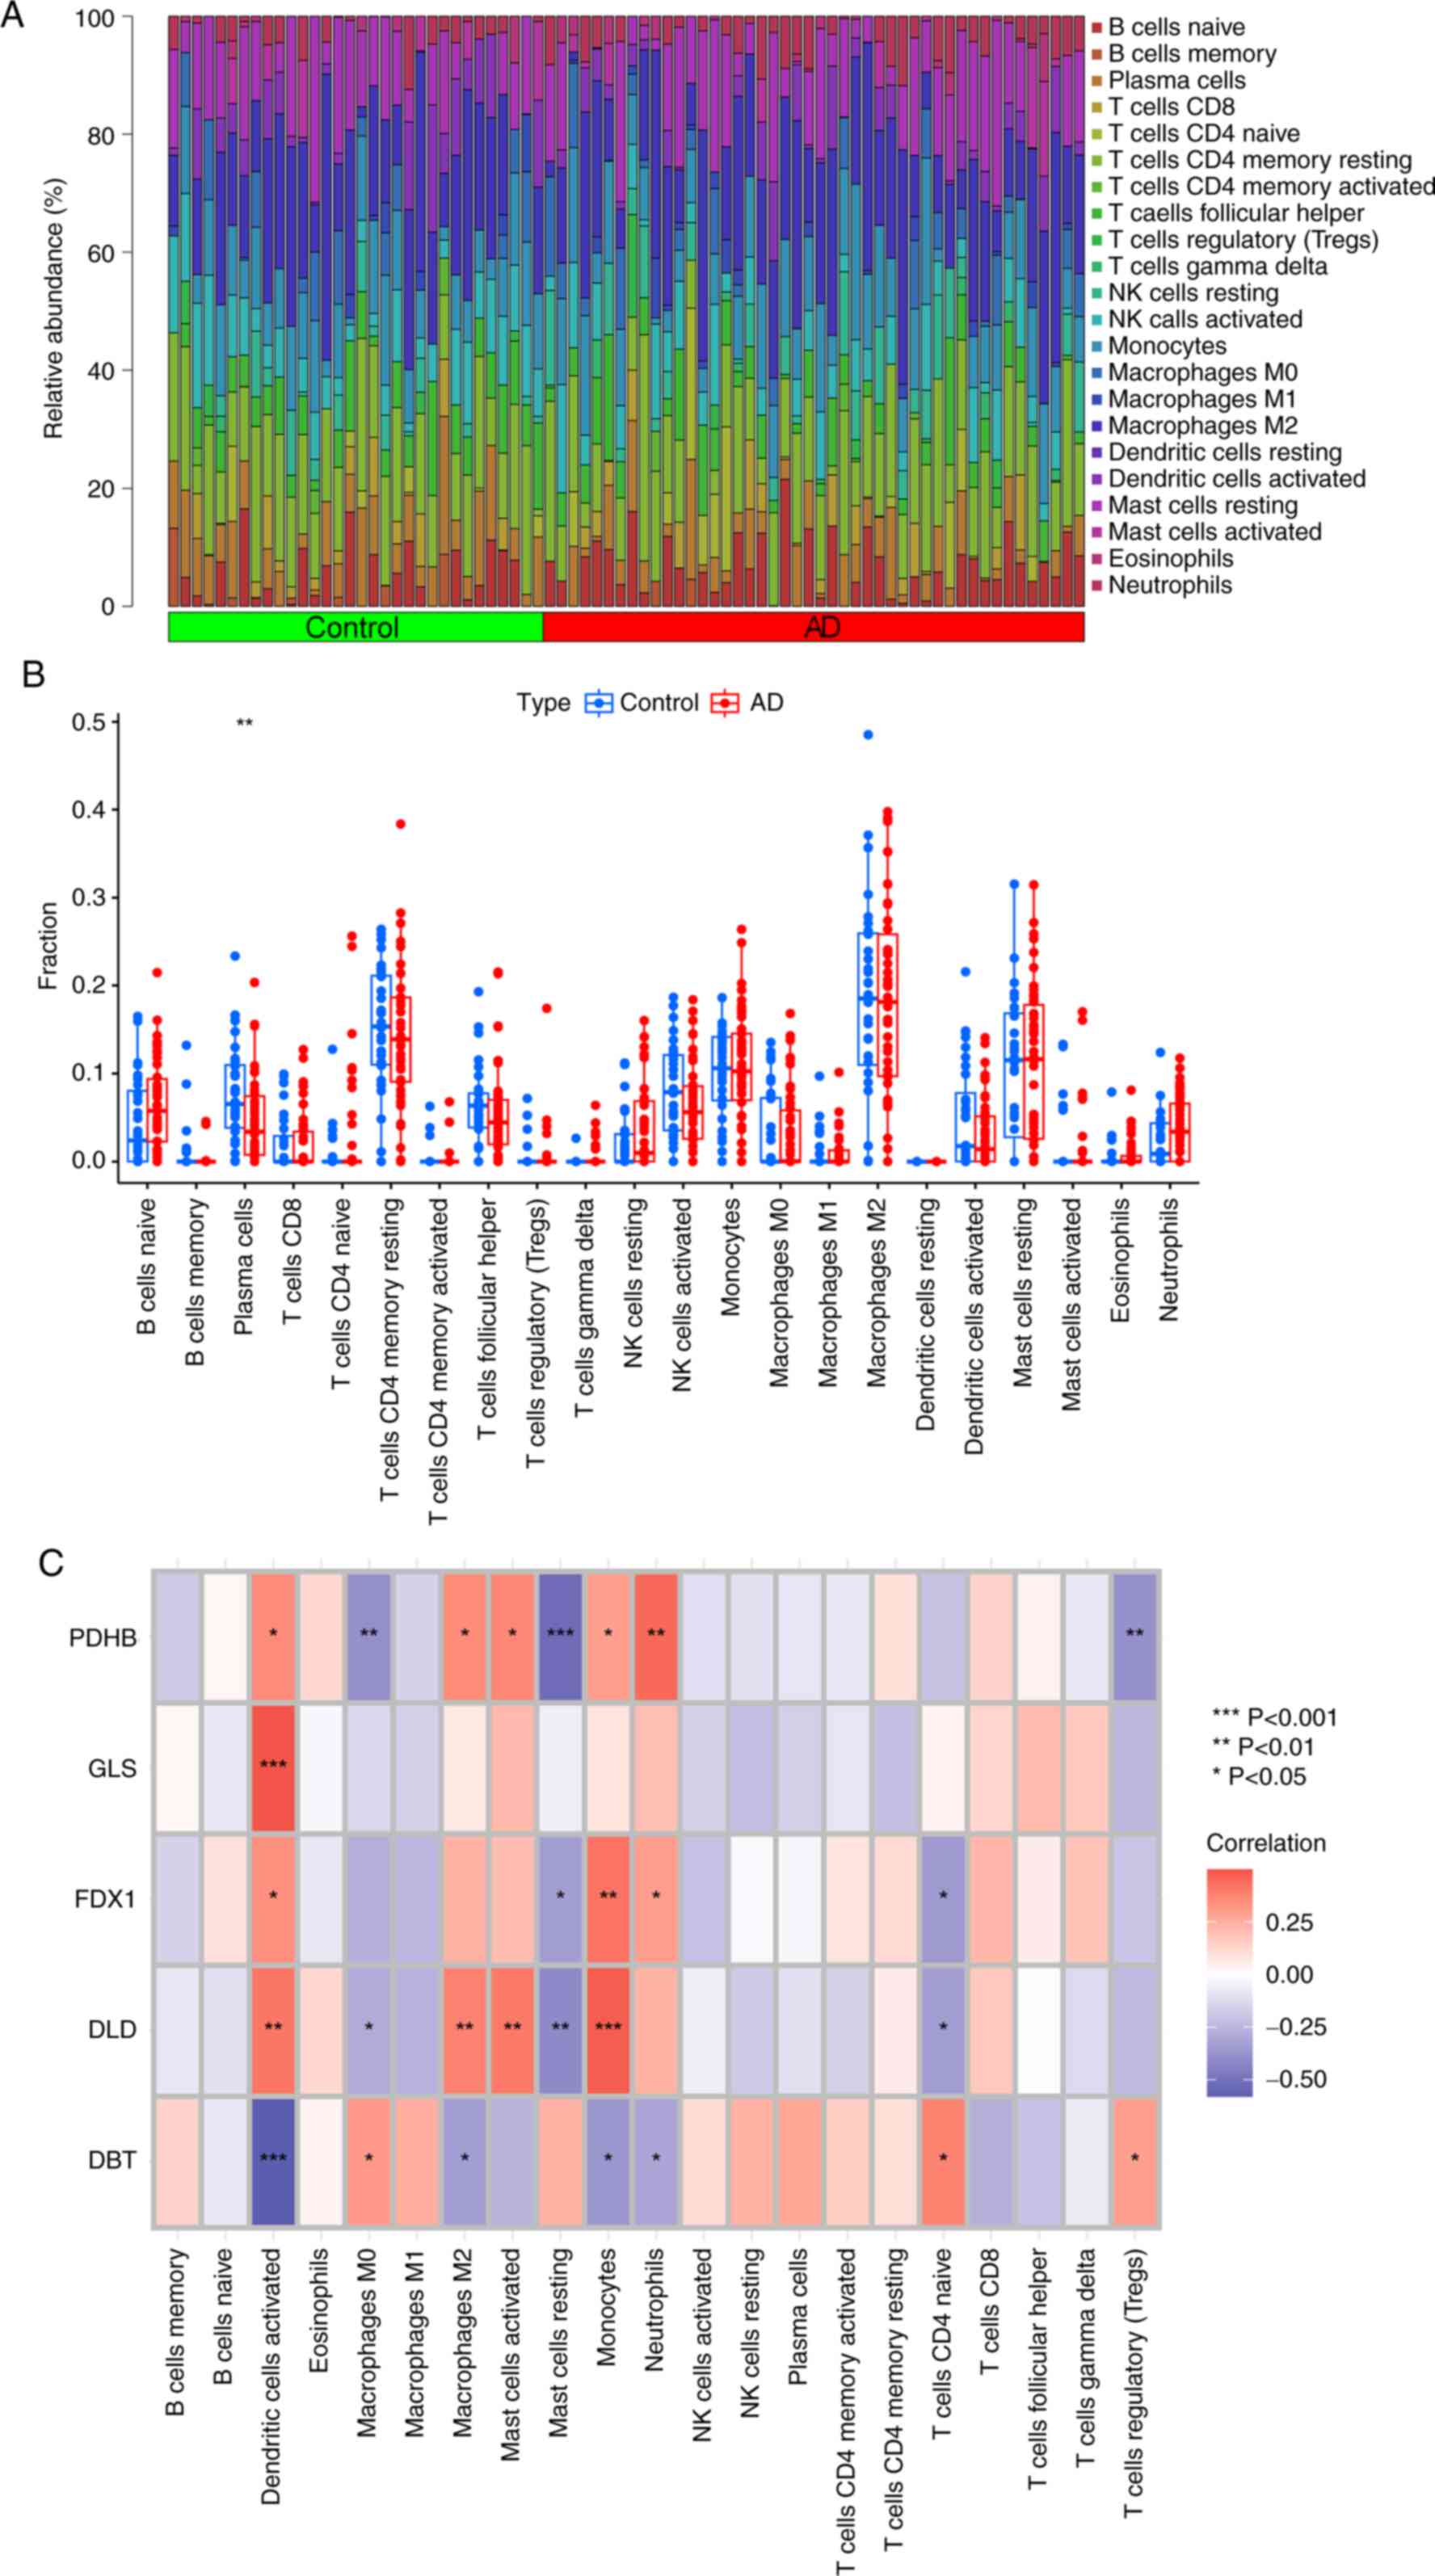
Immune infiltration analysis was performed based on
the CIBERSORT algorithm, and the results showed differences between
patients with AD and healthy individuals in the proportion of 22
infiltrating immune cell types. The heatmap shows the distribution
of the 22 infiltrating immune cell types (Fig. 4A). The results showed that patients
with AD had higher levels of immune infiltration of naive B cells,
CD8 T cells, resting natural killer (NK) cells, monocytes, M1
macrophages, resting mast cells, eosinophils and neutrophils
compared with in the control patients. By contrast, plasma cells,
CD4 memory resting T cells, follicular helper T cells, activated NK
cells, M0 macrophages, M2 macrophages and activated dendritic cells
exhibited lower infiltration levels in patients with AD (Fig. 4B). The correlation between the five
differentially expressed CRGs and infiltrating immune cells
demonstrated that DLD was positively correlated with
dendritic-activated cells, M2 macrophages and mast-activated
monocytes. Moreover, GLS showed a positive correlation with
dendritic-activated cells (Fig.
4C). These results suggest that CRGs may be a key factor in
regulating the molecular and immune infiltration status in patients
with AD.
Characterization of epithelial cell
aggregation in patients with AD
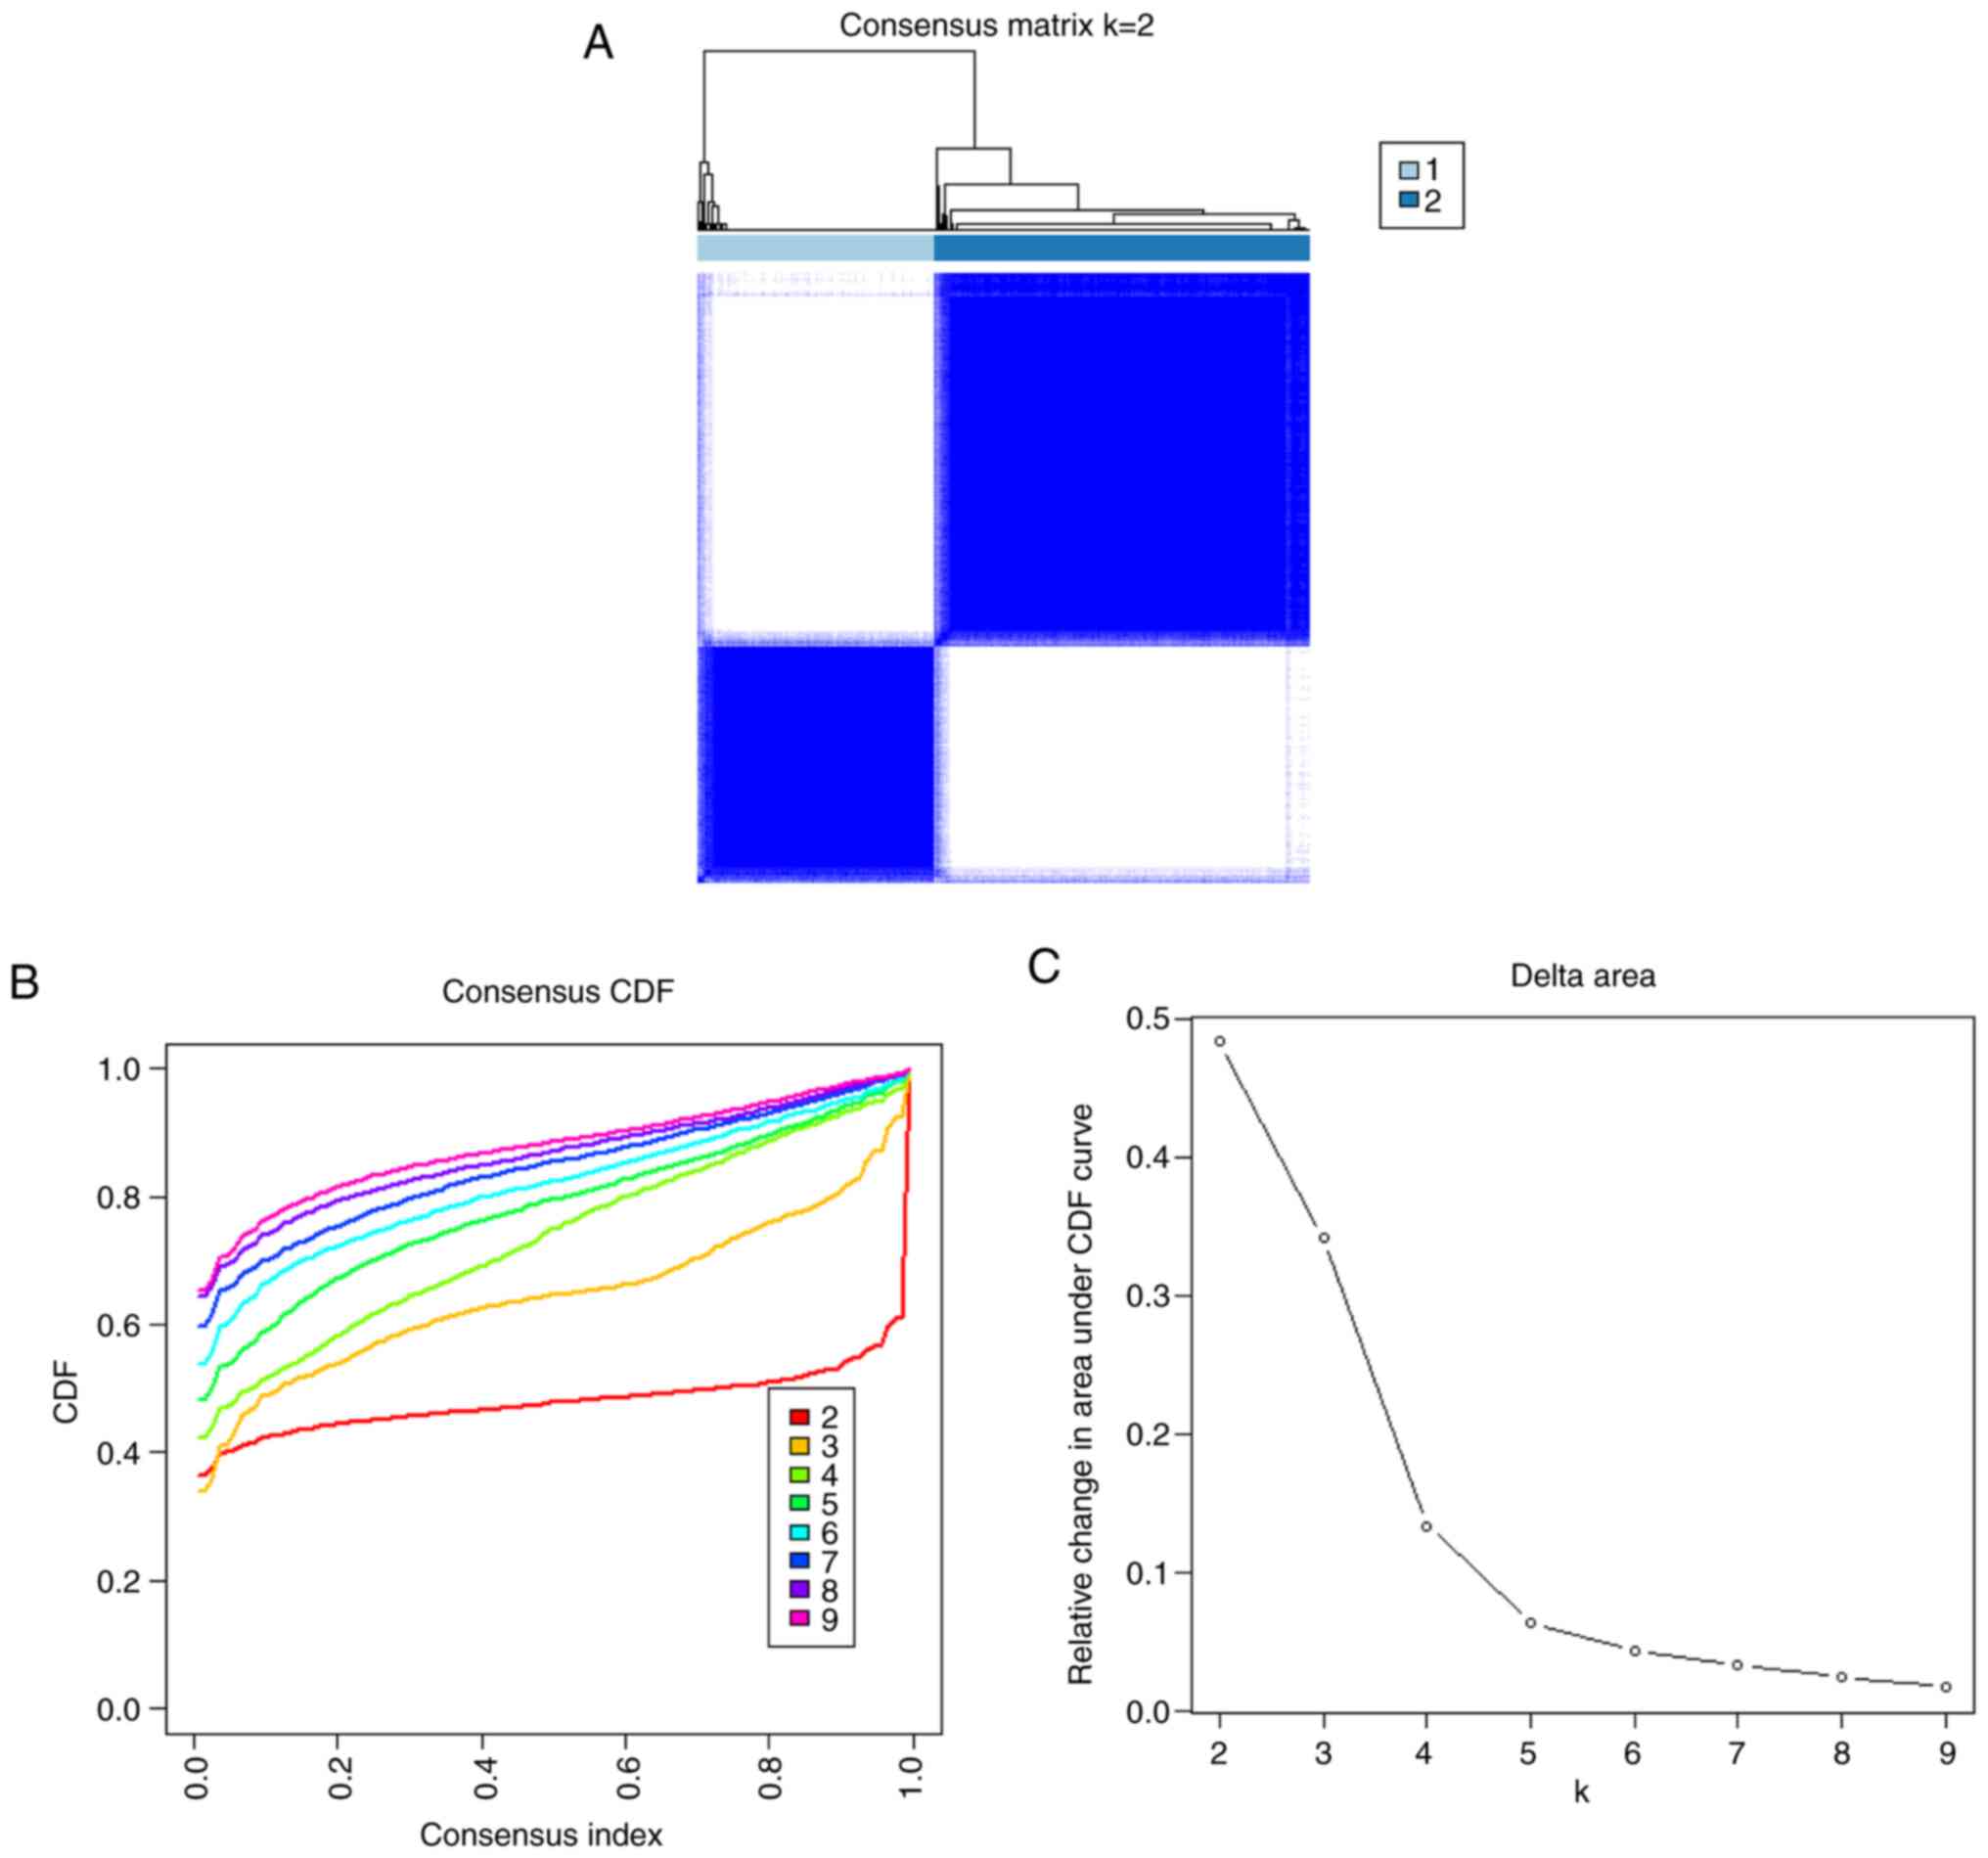
To elucidate the expression patterns associated with
cuproptosis in AD, 78 samples were grouped based on the expression
profiles of the five CRGs using a consistent clustering algorithm.
The number of clusters was most stable when the k-value was set to
2 (k=2) and the cumulative distribution function (CDF) curves
fluctuated within the smallest range of the common index (0.2–0.6;
Fig. 5A). When the k-value was
2–9, the area under the CDF curve exhibited a difference between
the two CDF curves (k and k-I; Fig.
5B). Clustering the k-values ranging 2–9 showed a concordance
score of >0.9 across subtypes only when the k-value was equal to
2 (Fig. 5C). The results show that
the consistency scoring of each subtype is satisfied only for
k=2.
Characterization of differentiation
and immune infiltration of regulatory factors in two clusters of
cuproptosis
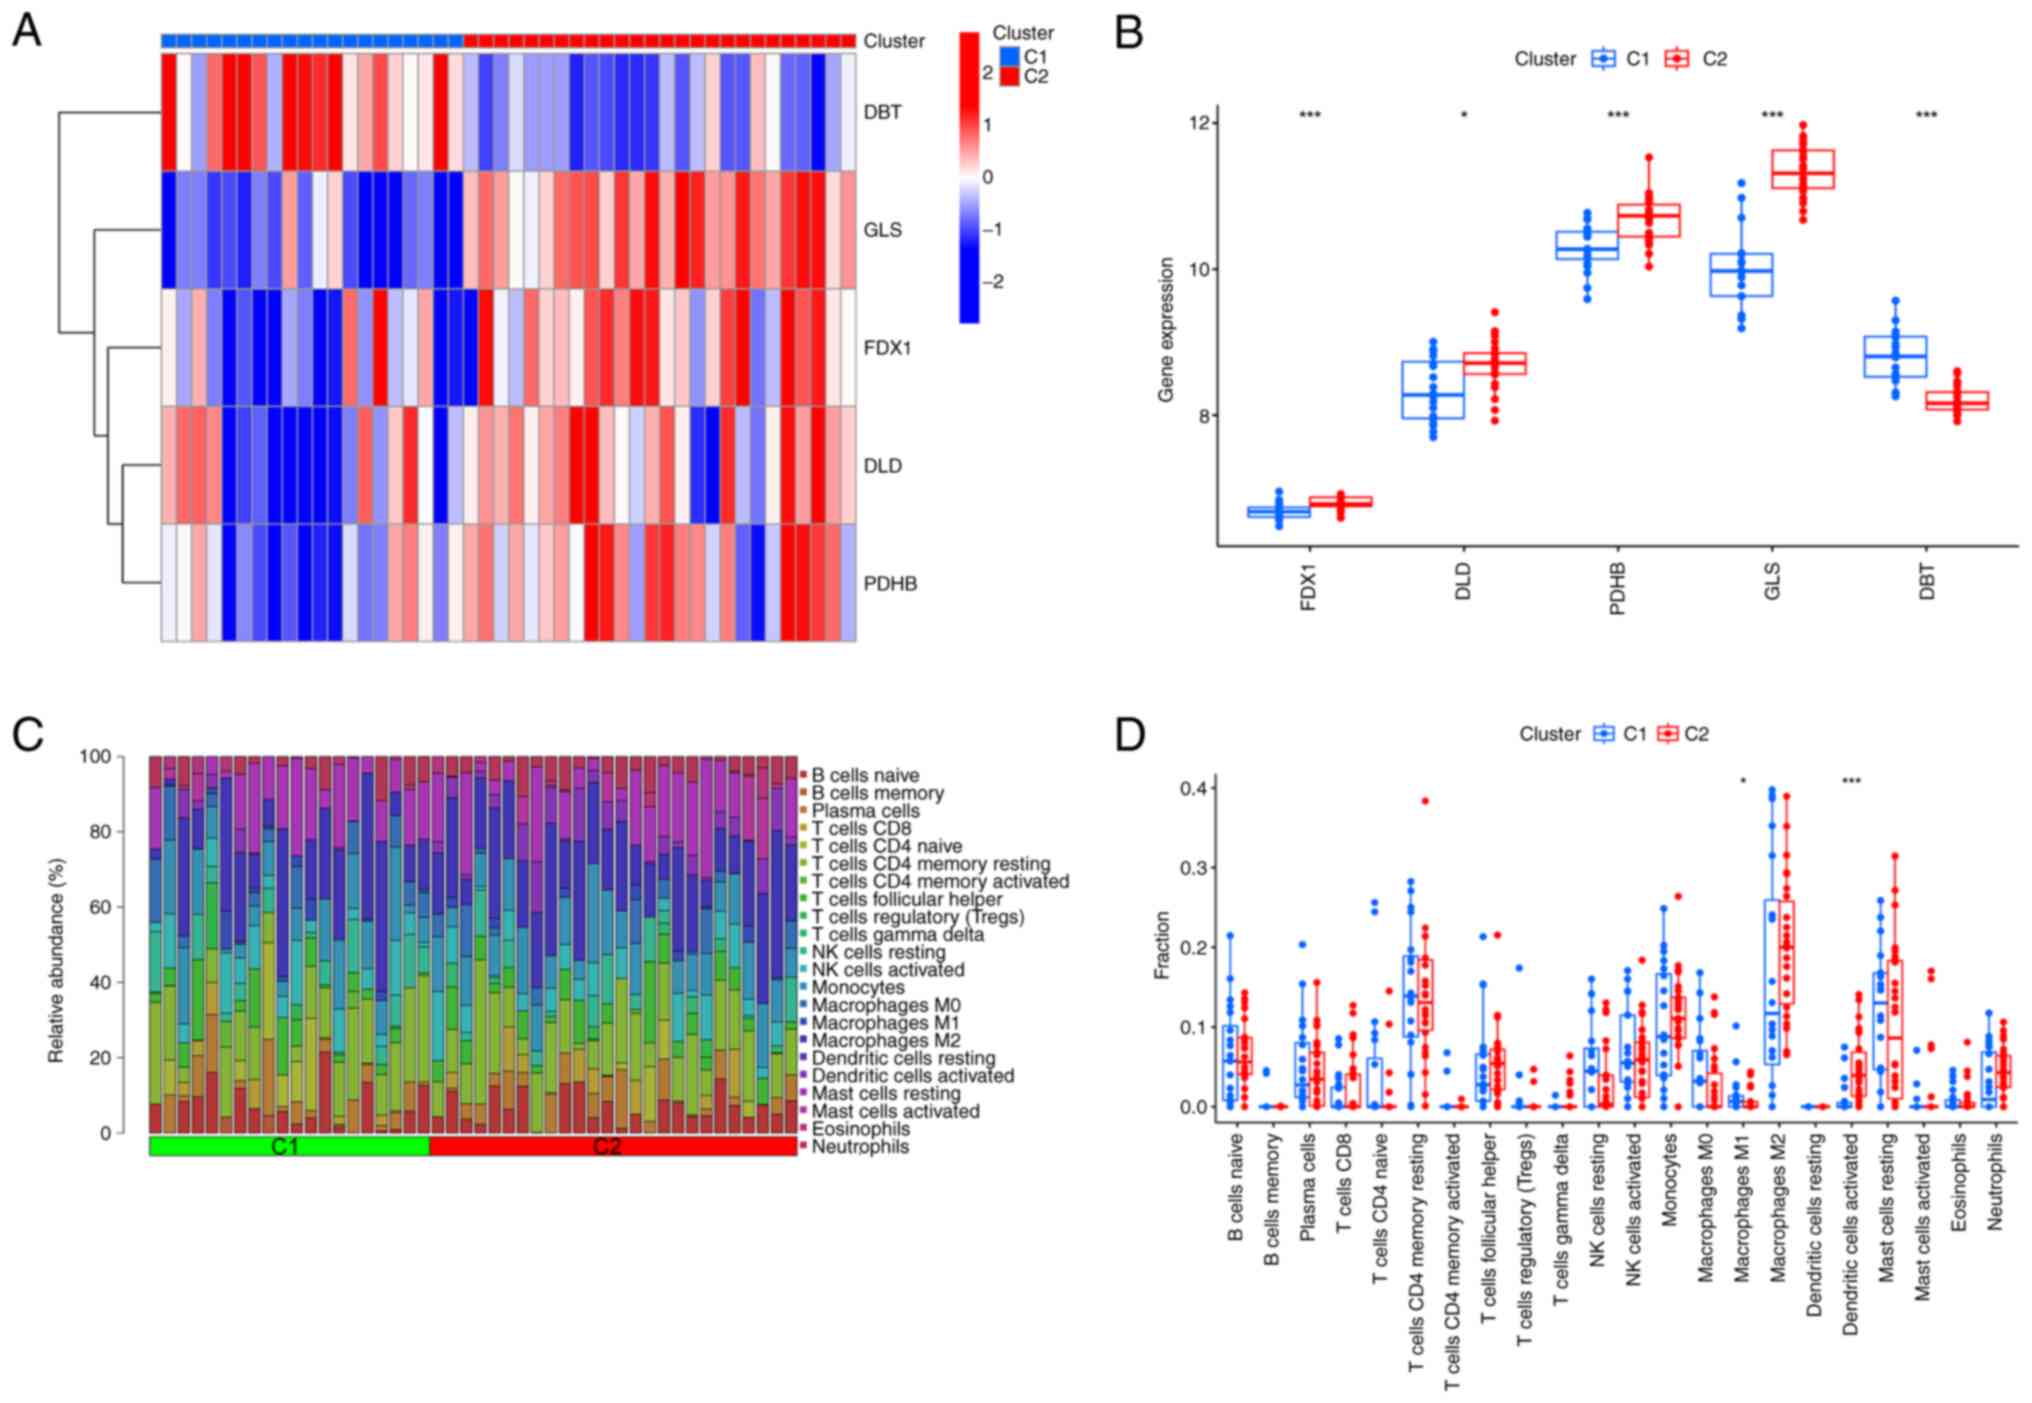
Combined with the heatmap of the shared matrix, 78
patients with AD were grouped into two clusters, including cluster
1 (n=46) and cluster 2 (n=32). To compare the molecular features of
the clusters, the expression differences of the five CRGs between
cluster 1 and 2 were first assessed (Fig. 6A). Different expression profiles of
CRGs were observed between the two cuproptosis intoxication
patterns, with cluster 1 exhibiting high expression levels of DBT
and cluster 2 characterized by increased expression of DLD, FDX1,
GLS and PDHB (Fig. 6B). The immune
infiltration analysis revealed a difference between the clusters in
the immune infiltration profile (Fig.
6C). The percentage of macrophage M1 was higher in cluster 1,
whereas the percentage of dendritic activated cells was higher in
cluster 2 (Fig. 6D). The results
showed that the correlation between CRGs and immune cells was also
increased after splitting into two clusters.
Development of a co-expression
networks
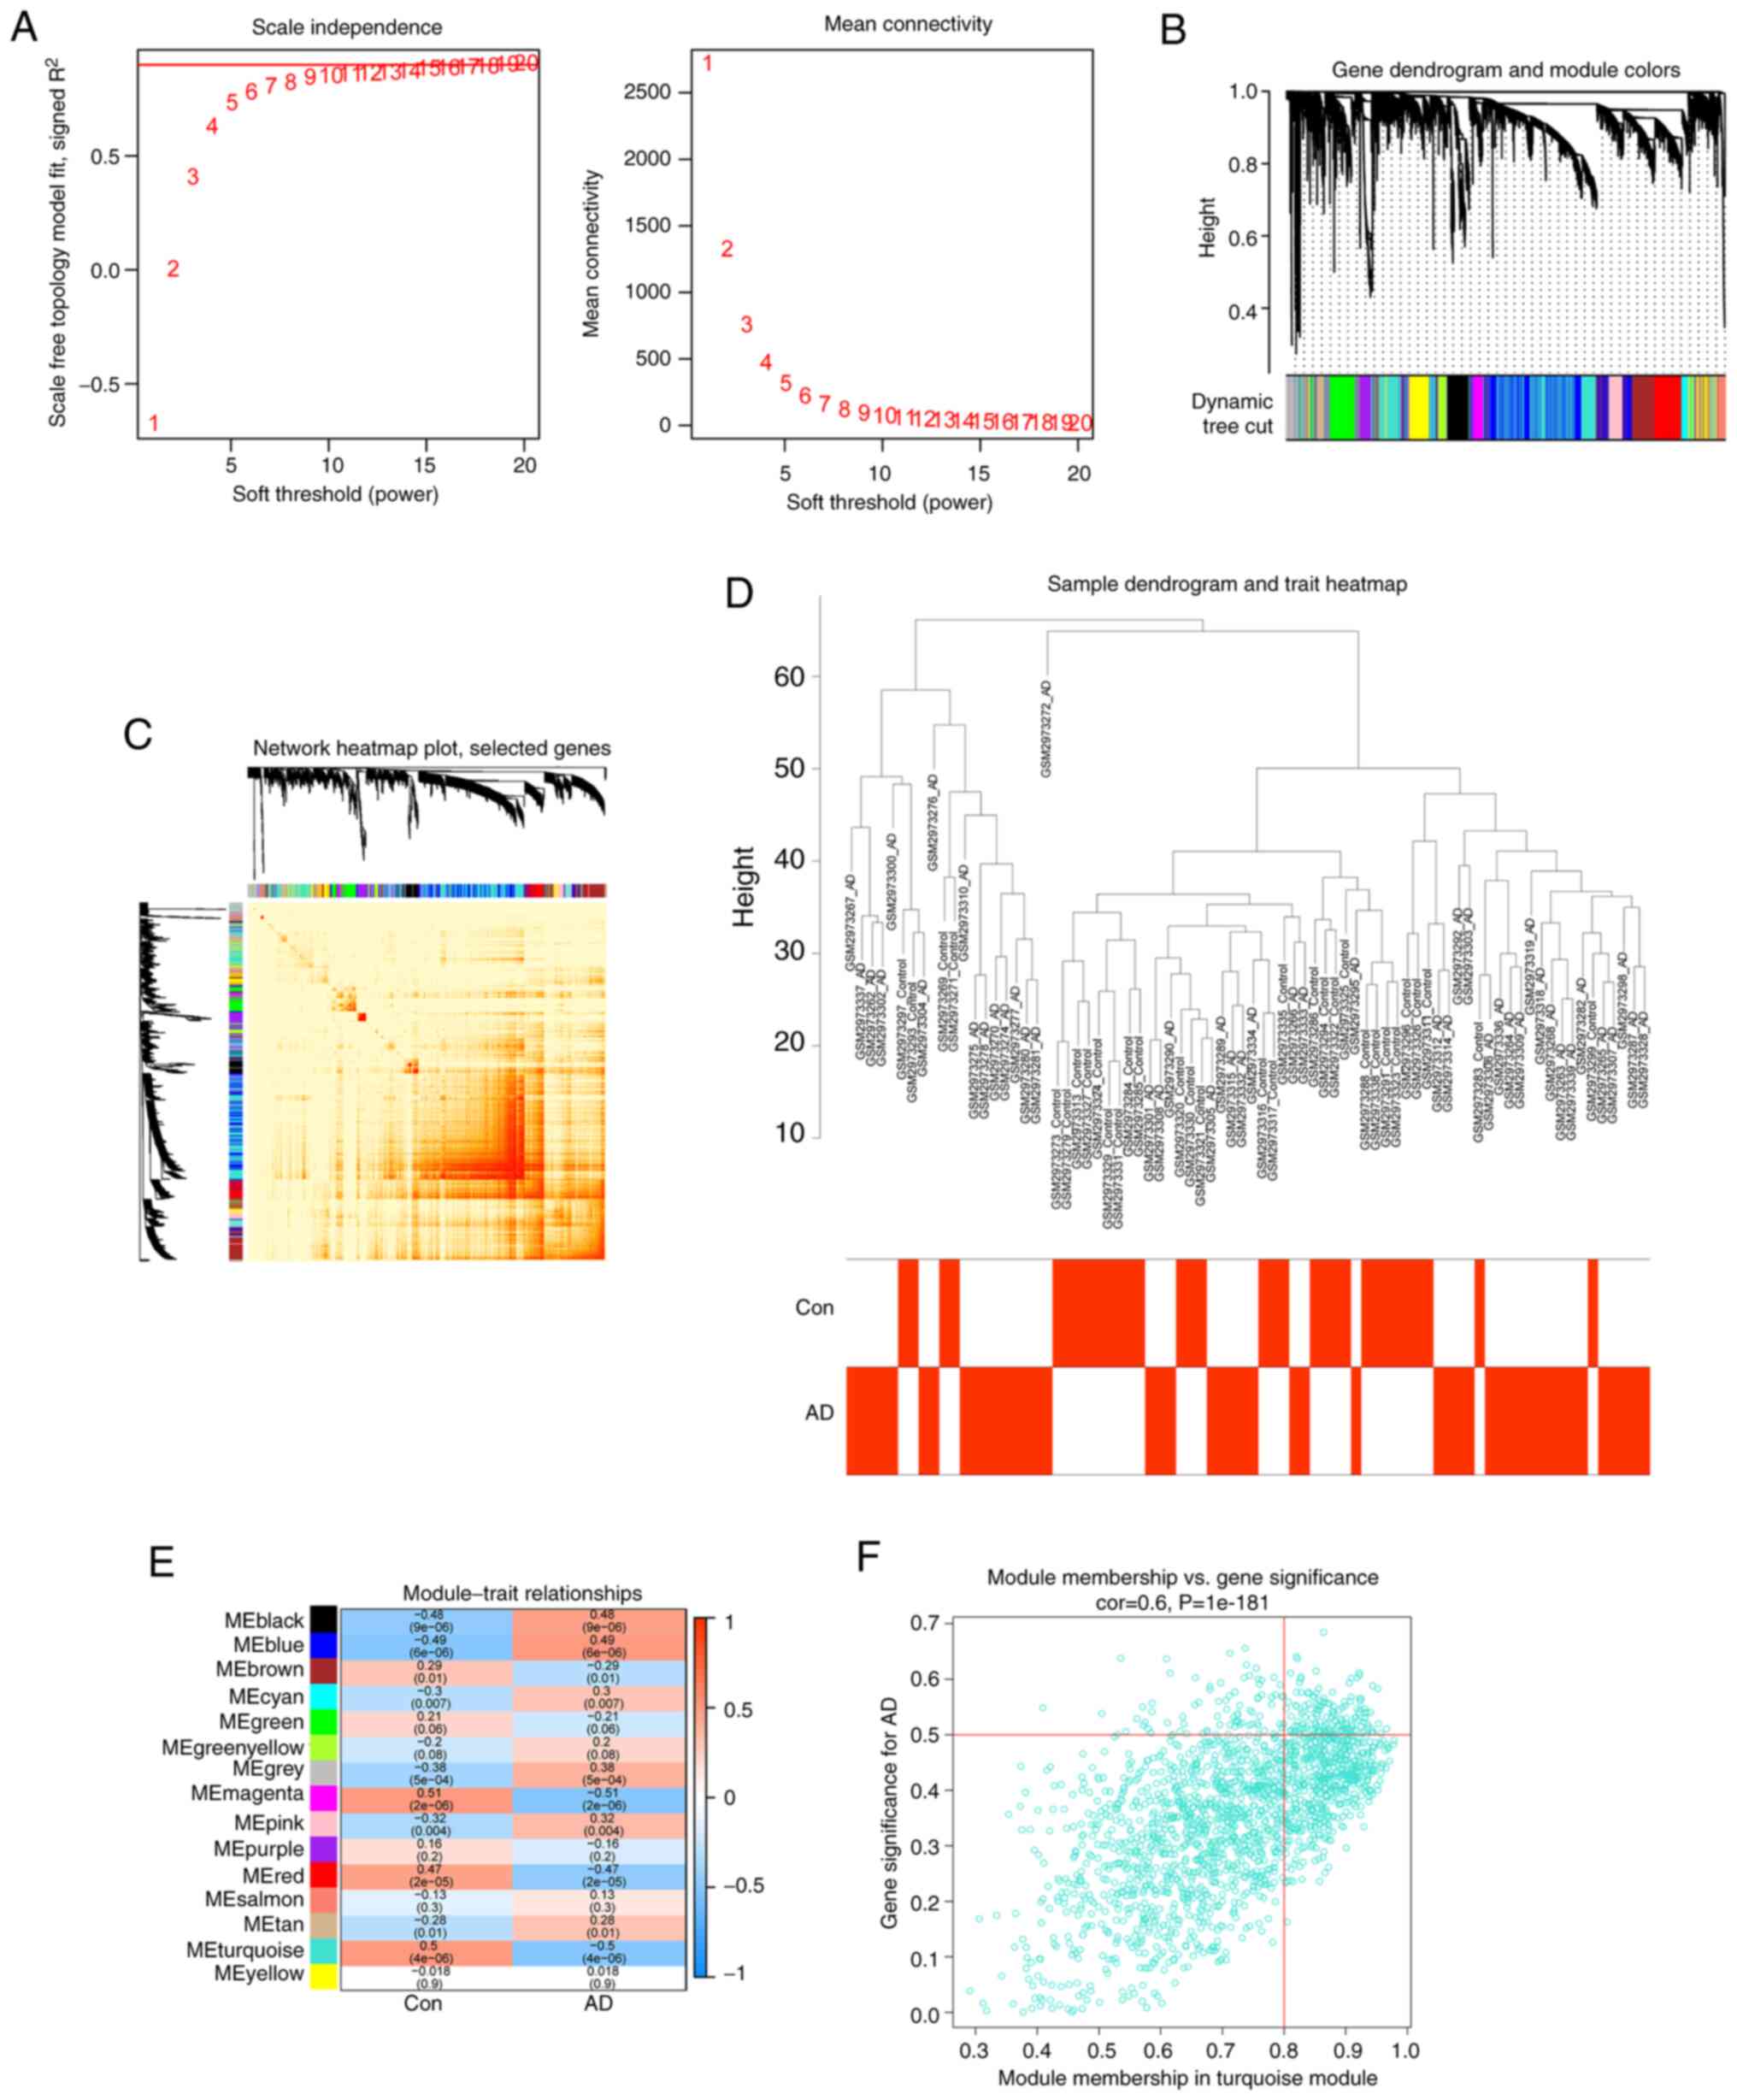
The WGCNA algorithm was used to develop
co-expression networks and modules in healthy individuals and
patients with AD to identify key gene modules associated with AD.
After calculating the variance of each gene expression in
GSE109887, the top 25% of genes with the highest variance were
selected for further analysis. Co-expressed gene modules were
identified when the value of soft power was set to 11 and the
scale-free R2 was equal to 0.5 (Fig.
7A). A total of 10 gene modules with different colors were
obtained using the dynamic cutting algorithm, and then a heatmap of
the TOM was created (Fig. 7B-D).
These genes were then used in each of the ten color modules in turn
to examine the degree of similarity and proximity of
module-clinical feature co-expression in the control and AD groups.
By analyzing the similarity and adjacency of the co-expression of
the clinical features of the module (control and AD), it was found
that the turquoise module had the strongest relationship with AD,
and had a strong correlation with AD with P=4e−06 in the
AD group (Fig. 7E). In addition, a
positive association was observed between the turquoise module and
module-associated genes (Fig.
7F).
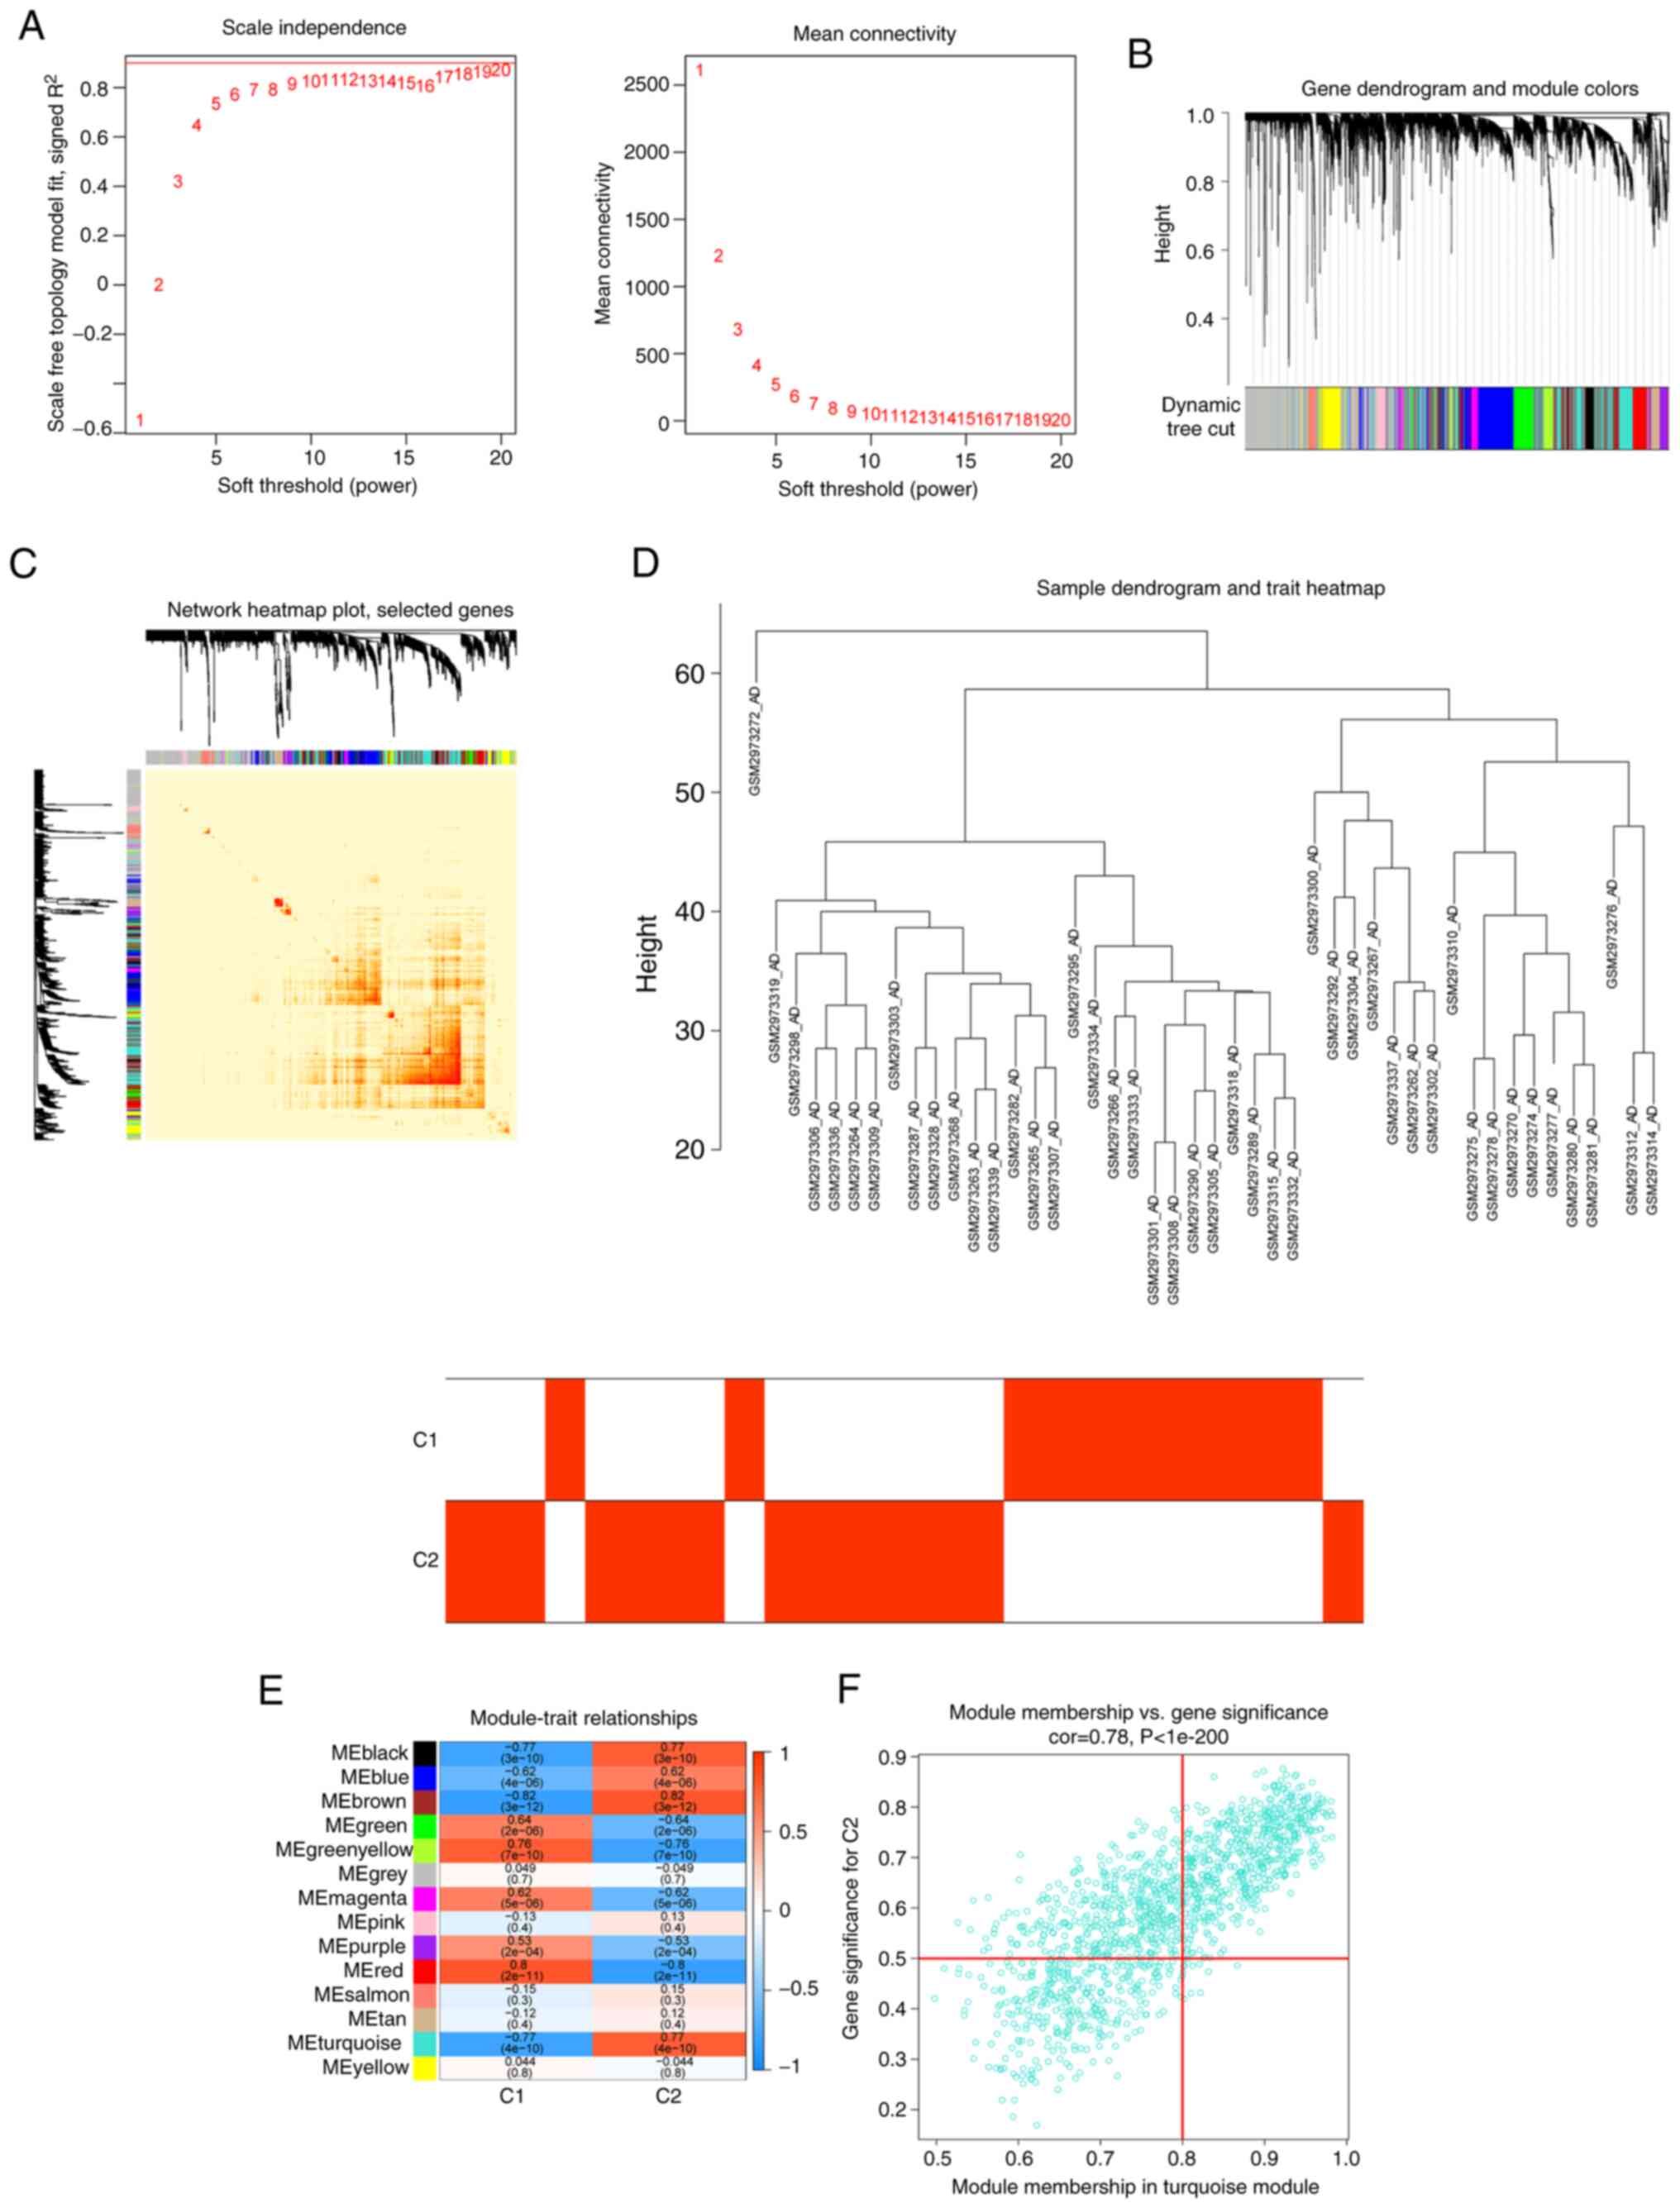
A similar approach was also employed to further
analyze the DEGs between the two cuproptosis clusters. β=19 and
R2=0.8 were screened as the most suitable soft threshold parameters
for developing the scale-free network (Fig. 8A). The heatmaps demonstrated the
TOM of all module-related genes (Fig.
8B-D). An analysis of the relationship between modules and
clinical features (clusters 1 and 2) revealed a strong correlation
between turquoise modules and AD clusters (Fig. 8E). The correlation analysis also
showed a significant association between the turquoise module genes
and selected modules (Fig.
8F).
Identification of specific genes and
GSEA
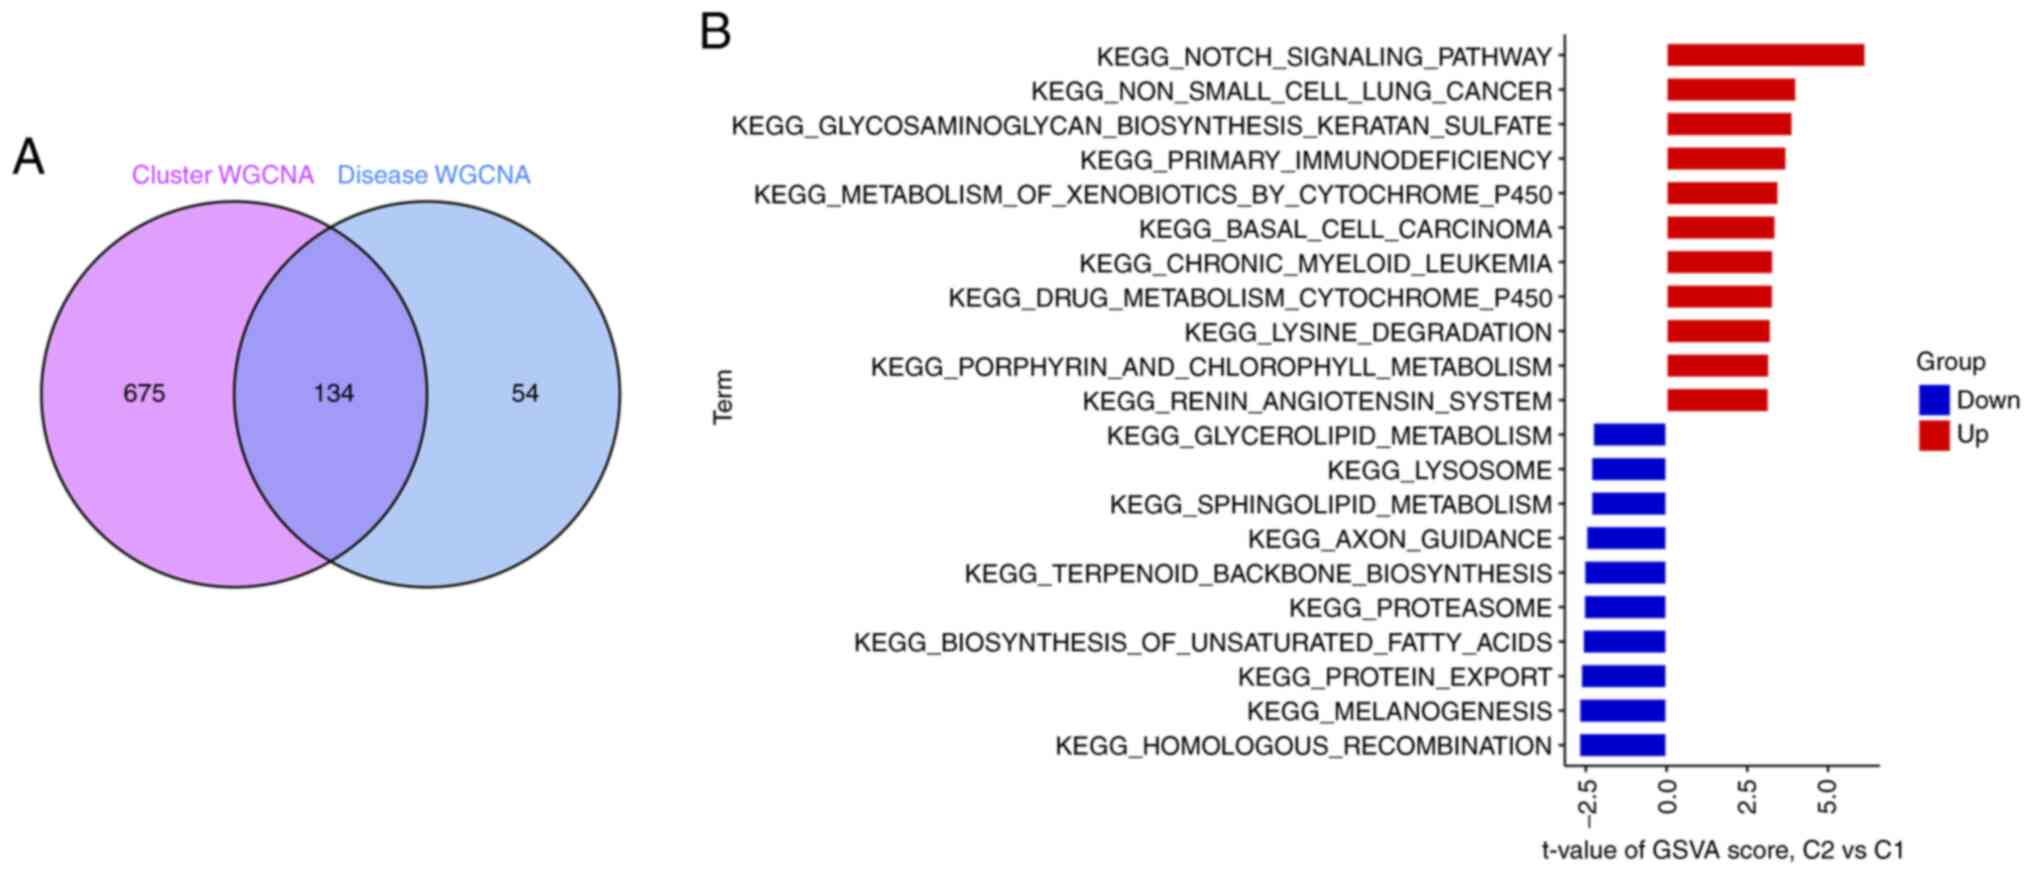
A total of 134 related genes were identified by
analyzing the crossover between the modular genes associated with
AD (Fig. 9A). GSVA analysis was
used to further investigate the functional differences between the
two clusters in terms of cluster-specific DEGs. Cluster 1 was found
to be enhanced in non-small cell lung cancer, glycosaminoglycan
biosynthesis of keratan sulfate, basal cell carcinoma, Kegel's
chronic granulocytic leukemia, primary immunodeficiency, drug
metabolism of cytochrome P450, isobiotic metabolism by cytochrome
P450 and Notch signaling activity (Fig. 9B). Thus, AD may be associated with
various immune responses and metabolism.
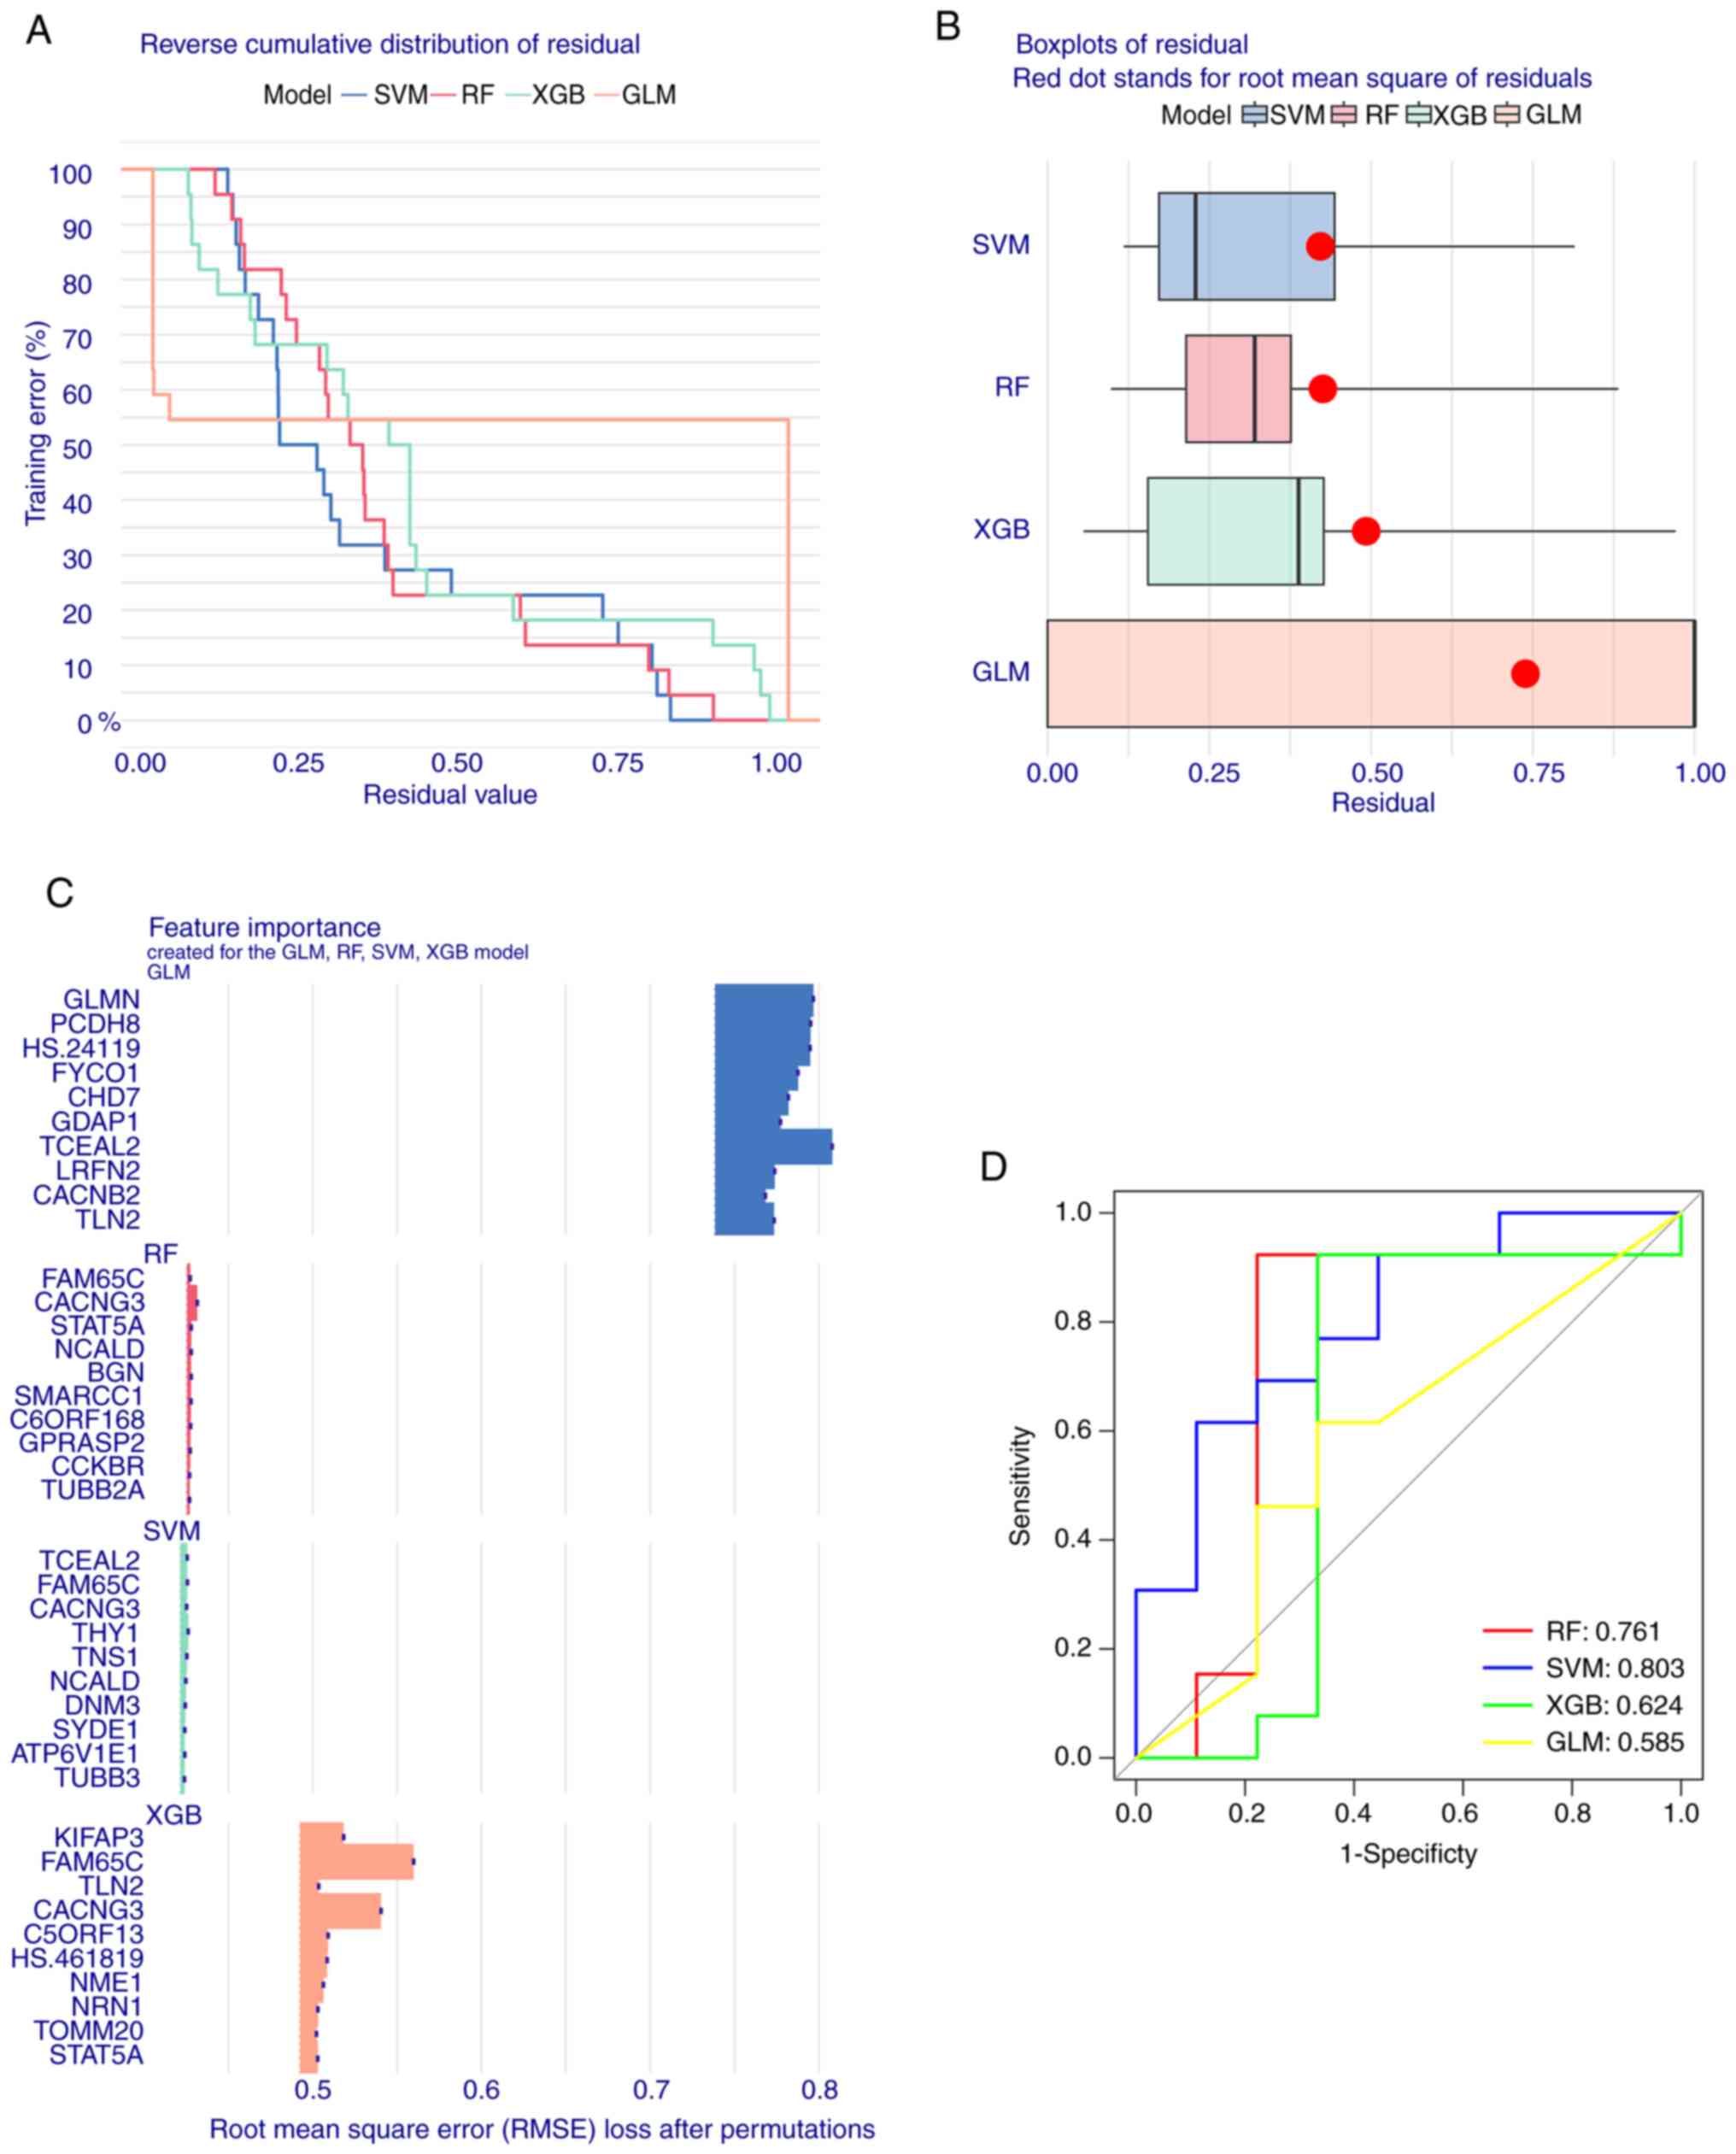
Development and evaluation of machine
learning models
To identify specific genes with high diagnostic
value, four validated machine learning models were developed based
on the intersection of 134 cluster-specific DEGs and AD DEGs. These
four models were RF, SVM, GLM and XGB. The SVM and RF models
presented relatively low residuals (Fig. 10A and B). The top 15 significant
feature variables of each model were then ranked based on the root
mean square error (Fig. 10C). The
discriminative performance of the four machine learning algorithms
in the test dataset was evaluated by calculating the subject
operating characteristic The discriminative performance of the four
machine learning algorithms on the test dataset was evaluated by
calculating the receiver operating characteristic (ROC) based on
5-fold cross-validation. The SVM showed the highest area under the
ROC curve (AUC). The AUC of other models was as follows: GLM=0.585,
SVM=0.803, RF=0.761 and XGB=0.624 (Fig. 10D). Combined with these results,
the SVM was shown to distinguish well between patients belonging to
different clusters. Finally, the top five SVM variables (CACNG3,
TNS1, TCEAL2, FAM65C NPTN, and THY1) were selected as predictor
genes for further analysis.
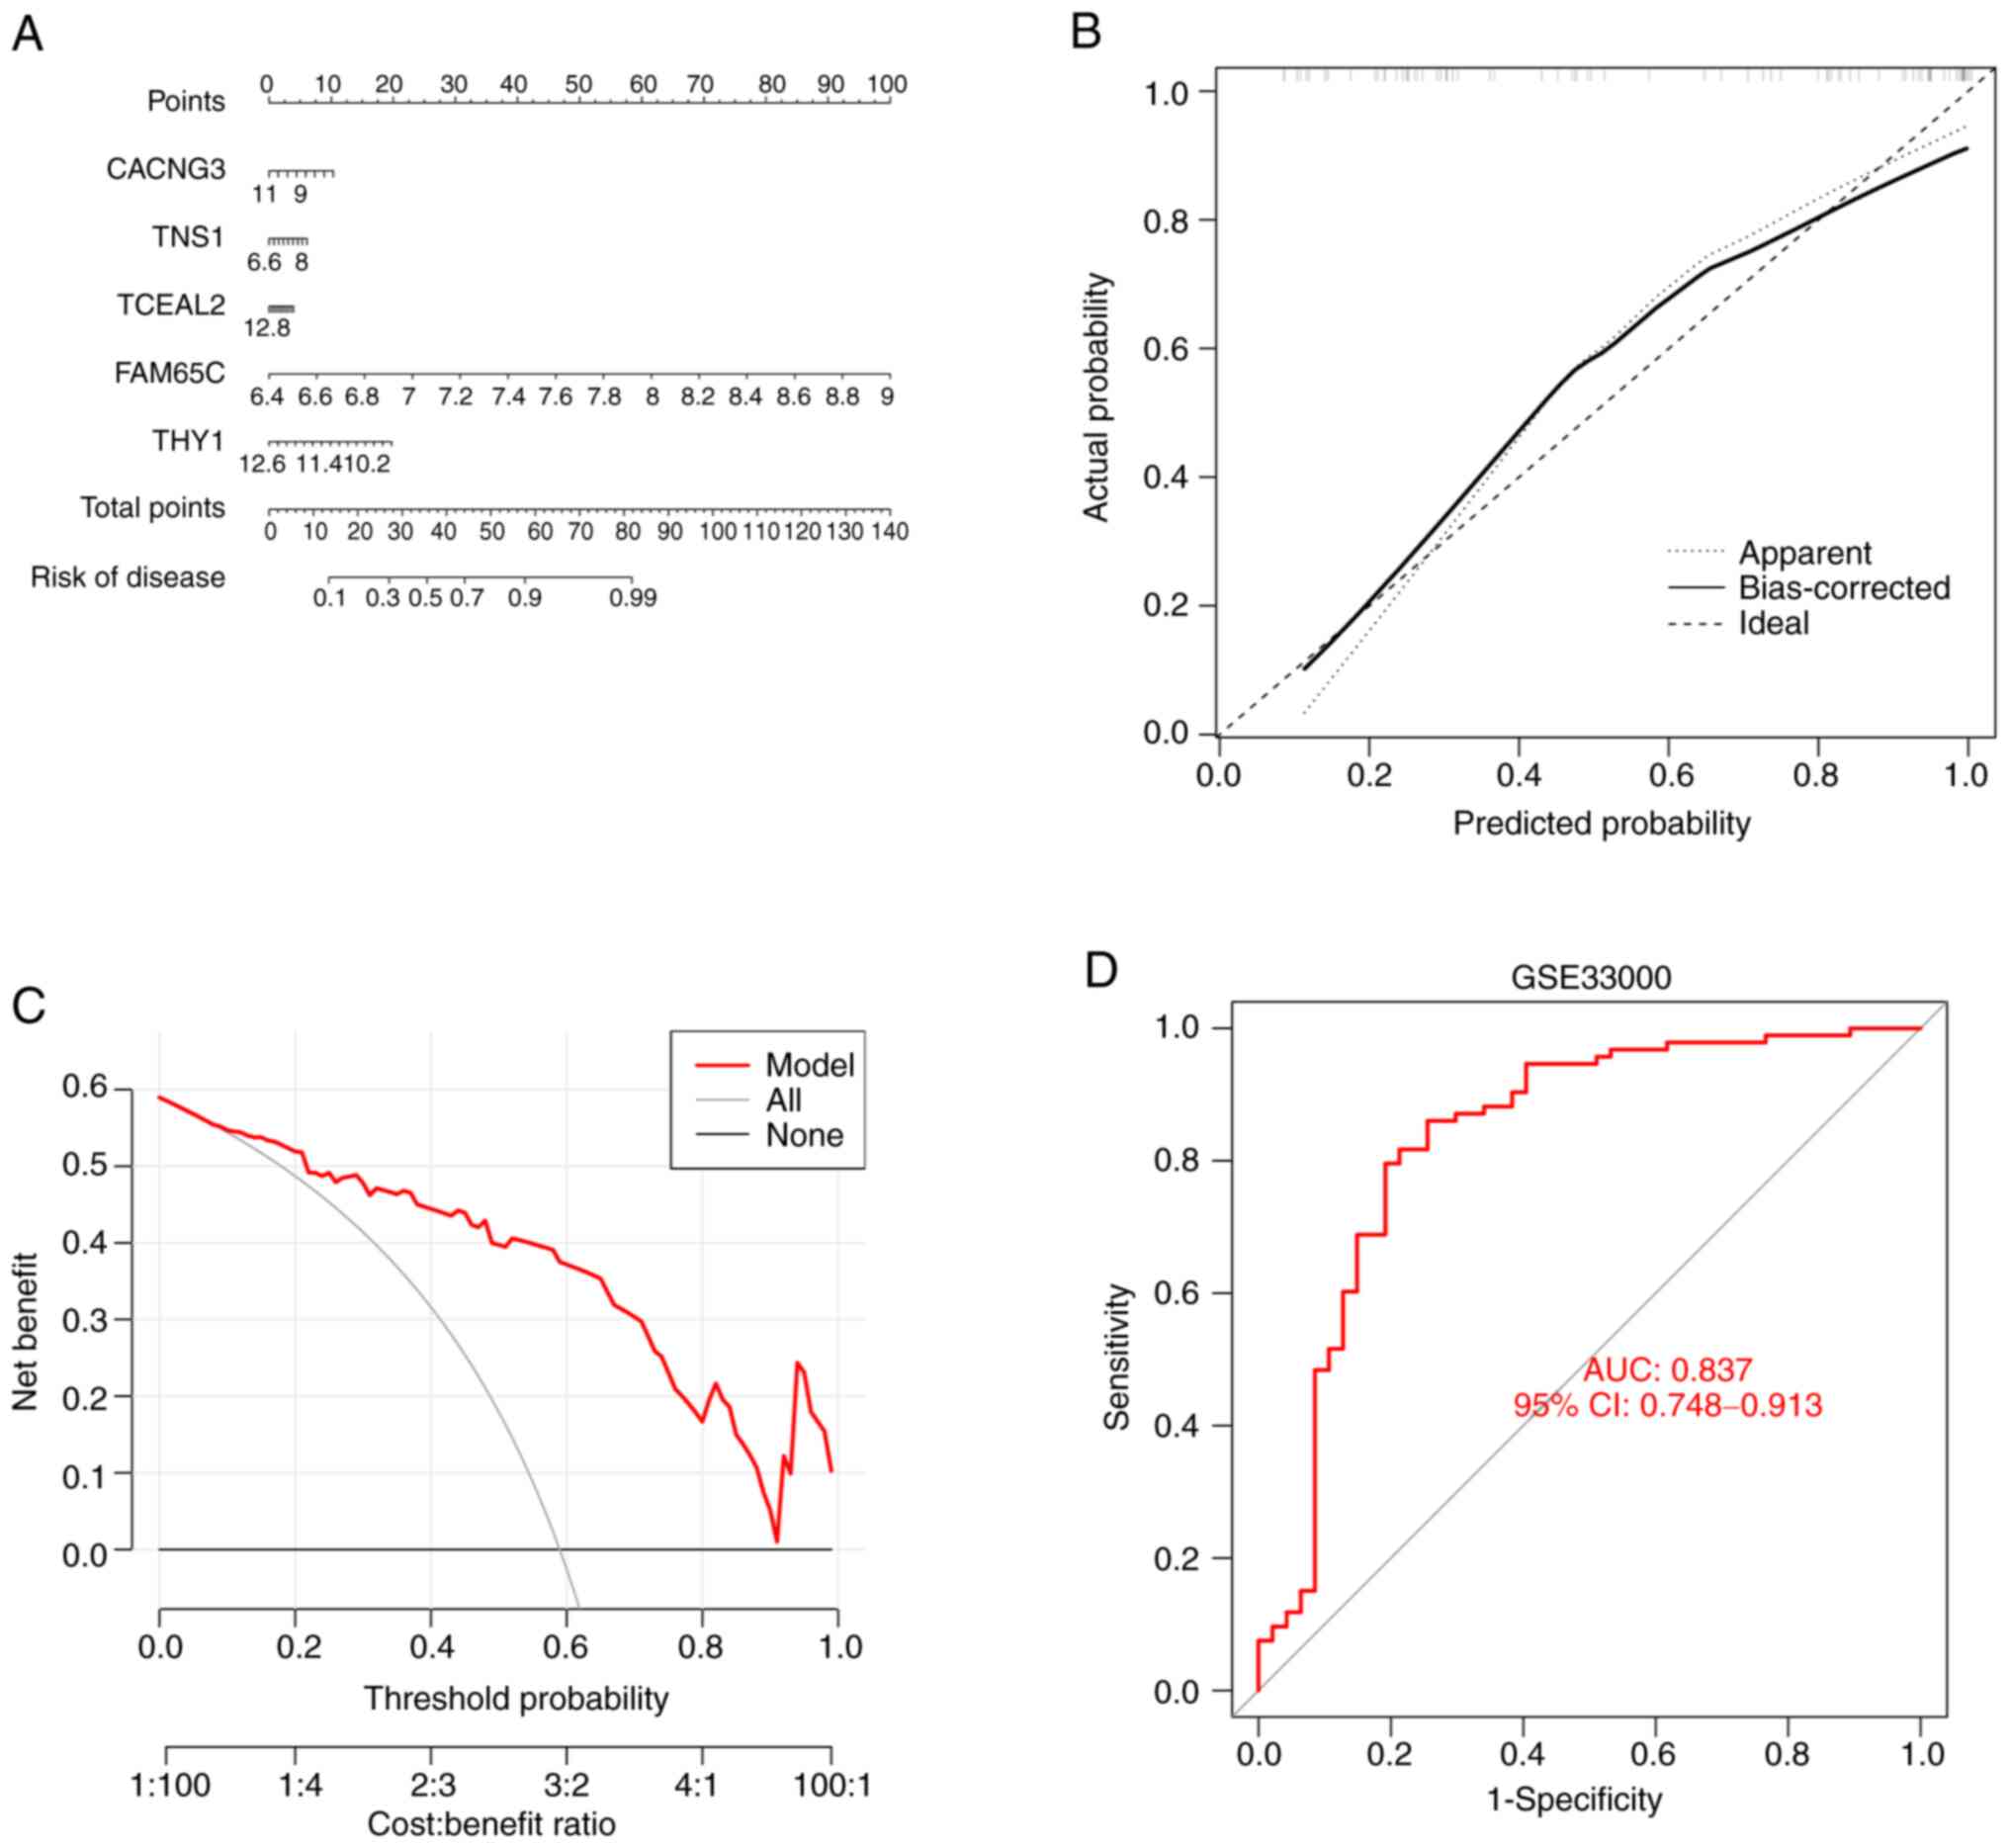
Nomogram construction and validation
of predictive modeling accuracy
A nomogram was developed to estimate the risk of
cuproptosis in 78 patients with AD to further generalize the RF
model to clinical applications (Fig.
11A). Correction curves and DCA were then employed to evaluate
the predictive efficiency of the nomogram model. The calibration
curve showed that there was a small error difference between the
actual AD aggregation risk and the predicted risk (Fig. 11B). As the calibration curve of
the nomogram confirmed its high accuracy, it can be used as a basis
for clinical decisions (Fig.
11C). The gene prediction model developed in the present study
was validated on two external tissue datasets, and the ROC curves
showed that it performed well in the GSE33000 dataset, with an AUC
of 0.837 (Fig. 11D). These
results suggest the diagnostic power of the prediction model.
Characterization of CRG expression in
animal models of AD
After the MWM confirmed the modeling of the AD model
group, hippocampal tissue was collected for RT-qPCR and western
blotting experiments to verify CRG expression. No animals perished
during the MWM after modeling ten rats in each group, and the
analysis revealed that five modeling attempts were successful for
the model group (n=5). The MWM was used to test the effect of
Aβ25-35 on cognitive function in SD rats. Fig. 12A shows the distance traveled by
each group of rats in the MWM. The 4-day hidden platform experiment
showed that rats in the AD group (treated with Aβ25-35)
had lower mean swimming speeds and longer escape latencies than the
control and saline groups (Fig. 12B
and C). The spatial exploration experiment also indicated that
the rats in the model group traversed the platform less frequently
than those in the control and saline groups (Fig. 12D). These results suggest that the
memory function was impaired in the AD group. The RT-qPCR results
showed that the relative expression of DLD, FDX1, GLS, and PDHB
mRNA in the model group was lower than that in the control and
saline groups, whereas the expression level of DBT mRNA in the
model group was higher than that of the other two groups (Fig. 12E). Furthermore, the relative
expression level of DLD, GLS, and PDHB proteins showed a reduction
and that of DBT showed an increase in the model group compared with
those in the control and saline groups (Fig. 12F and G). These results indicated
that the expression of DLD, FDX1, GLS, and PDHB was downregulated
and the expression of DBT was upregulated in the AD model group,
which supports the bioinformatic analysis results.
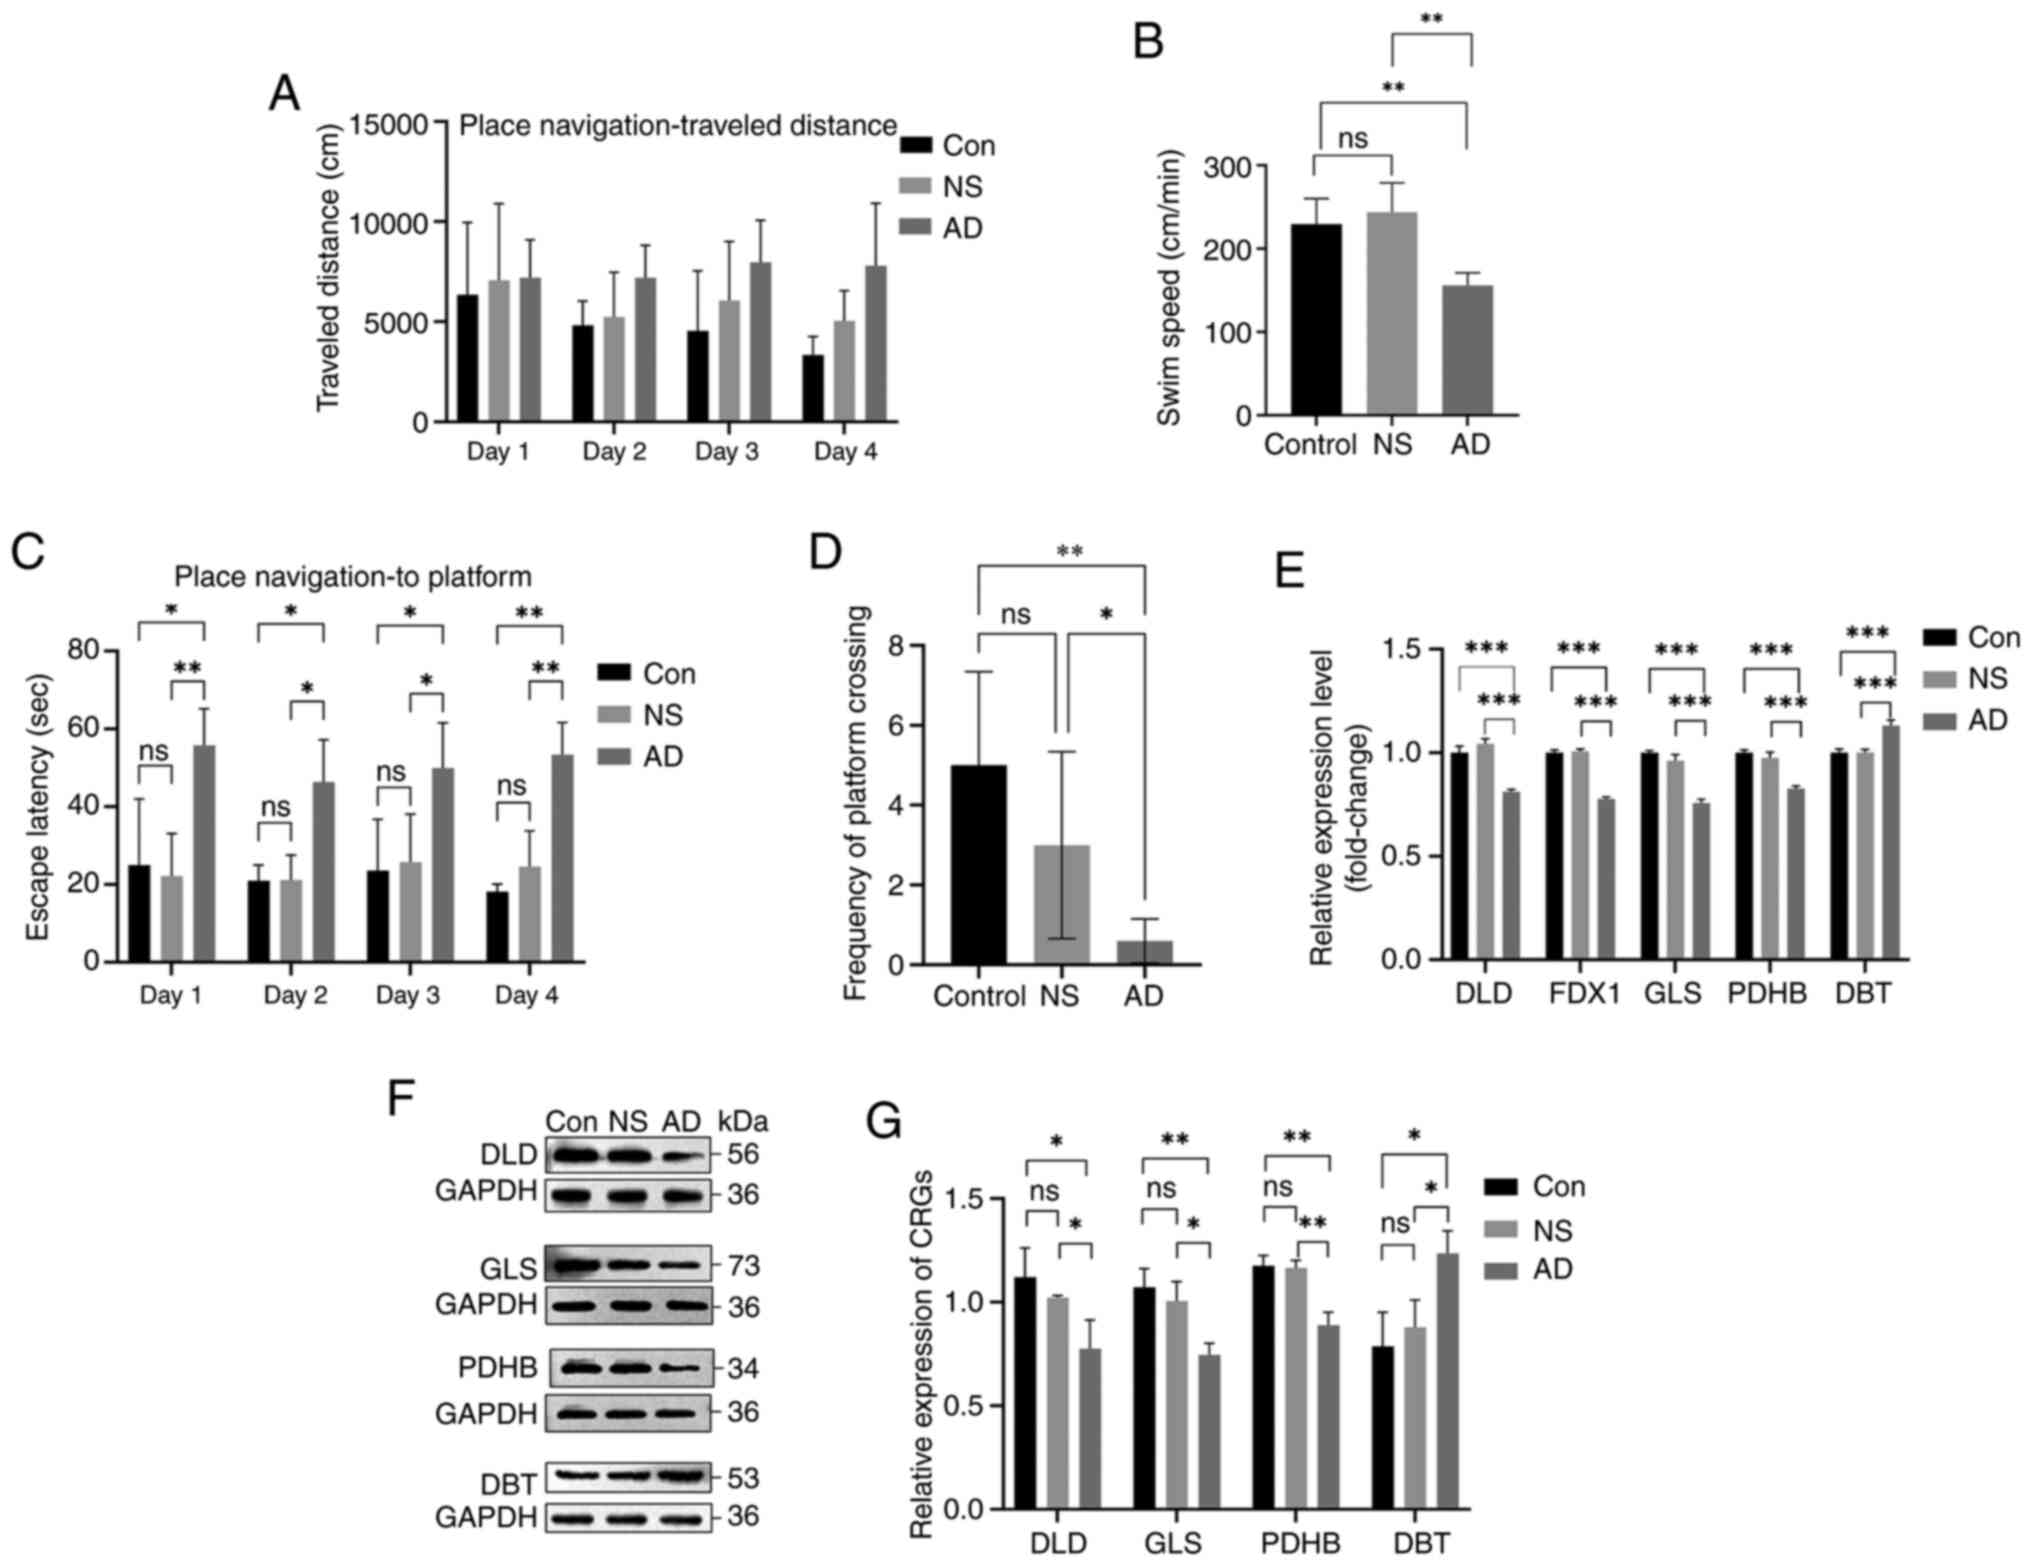 | Figure 12.Validation of the animal model (n=5
animals/group; experiments repeated three times). (A) Distance
travelled during spatial training. (B) Swimming speed during the
search for the MWM platform. (C) Escape latency in the MWM
experiment. (D) Frequency of platform crossing in the exploration
experiment. (E) mRNA levels of DLD, FDX1, GLS, PDHB and DBT in the
hippocampus of rats in each group. (F) Protein expression levels of
DLD, GLS, PDHB and DBT in the hippocampus of rats in each group.
(G) Protein expression levels of cuproptosis-related genes in
control and AD groups. *P<0.05, **P<0.01, ***P<0.001. ns,
not significant; MWM, Morris water maze; DLD, dihydrolipoamide
dehydrogenase; FDX1, ferredoxin 1; GLS, glutaminase; PDHB, pyruvate
dehydrogenase E1 subunit β; DBT, dihydrolipoamide branched chain
transacylase E2; AD, Alzheimer's disease; Con, control; NS, normal
saline. |
Characterization of CRG expression in
AD cell models
The modeling drug concentration of 25 nM was
determined based on the IC50 value after OA action on
SH-SY5Y cells at various concentrations was observed (Fig. 13A). A drug concentration of 25 nM
was added to the cells for 24 h, and cell viability was determined
to investigate the effects of this concentration on the cell
proliferation rate (Fig. 13B).
The AD model was then created using this drug concentration. Based
on the results of RT-qPCR, it was found that there was no
statistically significant difference in mRNA expression levels
between the normal control group and the DMSO group (Fig. 13C). According to the RT-qPCR
results, the expression of DLD, FDX1, GLS and PDHB was lower and
the expression of DBT was higher in the cells of the drug group
than that of the normal group (Fig.
13D). Western blotting results also showed that the DLD, GLS
and PDHB content decreased and the DBT content increased in the
drug group (Fig. 13E and F).
These findings support the results of the bioinformatics analysis
and the animal model.
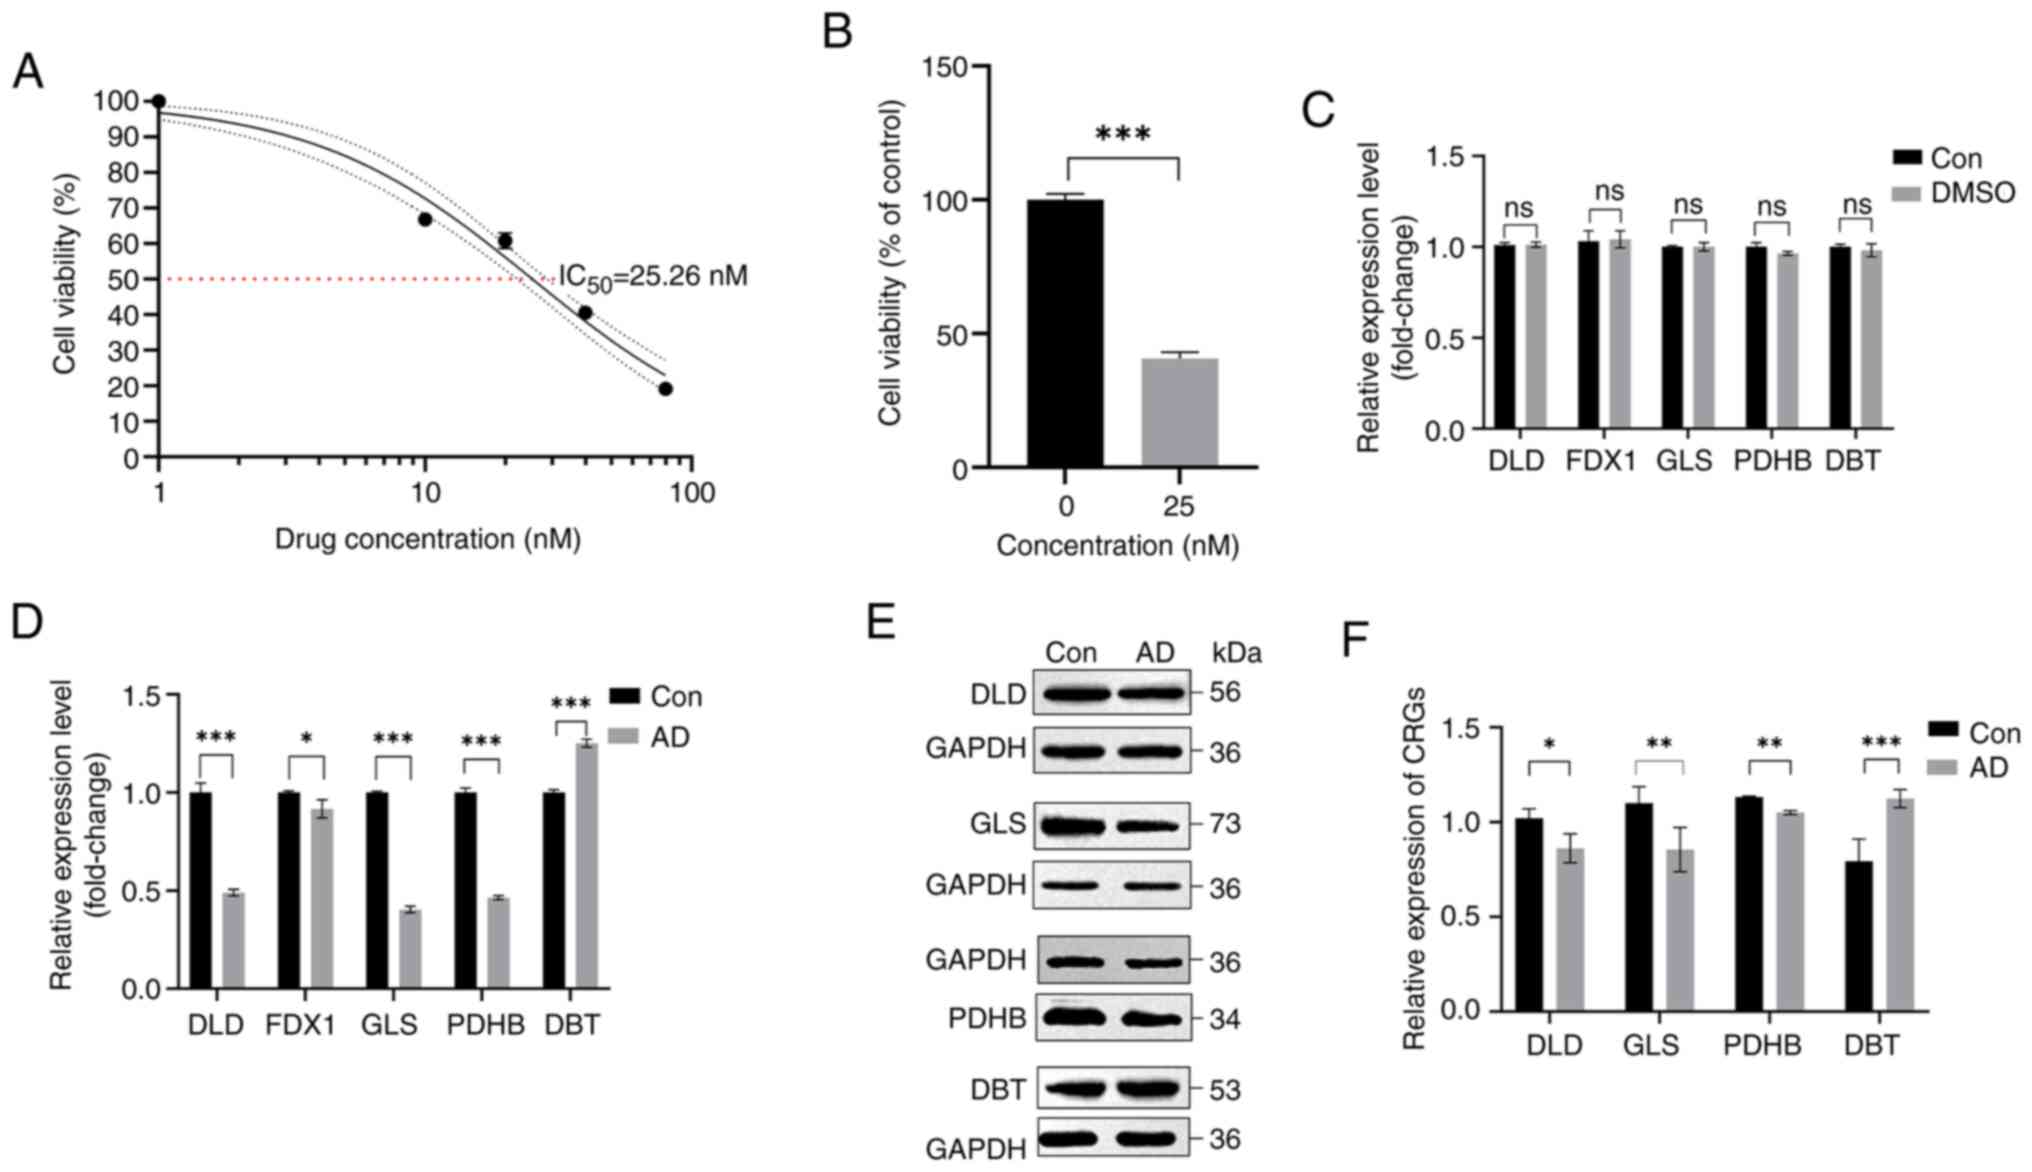 | Figure 13.Validation of cell models. (A)
Calculated IC50 results at 0, 10, 20, 40 and 80 nM
okadaic acid concentrations. (B) Cell viability of 25 nM okadaic
acid drug concentration acting on cells for 24 h. (C) mRNA levels
of DLD, FDX1, GLS, PDHB and DBT in control and DMSO groups. (D)
mRNA levels of DLD, FDX1, GLS, PDHB and DBT in control and model
groups. (E) Protein expression levels of DLD, GLS, PDHB and DBT in
SH-SY5Y cells of the AD model group. (F) Protein expression levels
of cuproptosis-related genes in control, NS and AD groups.
*P<0.05, **P<0.01 and ***P<0.001. ns, not significant;
Con, control; DLD, dihydrolipoamide dehydrogenase; FDX1, ferredoxin
1; GLS, glutaminase; PDHB, pyruvate dehydrogenase E1 subunit β;
DBT, dihydrolipoamide branched chain transacylase E2; AD,
Alzheimer's disease. |
Discussion
The pathogenesis and pathologic characteristics of
AD are complex. Apart from the primary pathological characteristics
such as NFTs, SPs and neuronal loss, patients with AD also exhibit
signs of mitochondrial dysfunction, including altered mitochondrial
morphology, decreased activity of cytochrome oxidase (respiratory
chain complex IV) and decreased glucose metabolism (35). Metal ions can cause
neurodegeneration in patients with AD by disrupting the
mitochondrial functional cycle, which has been suggested to be
closely associated with mitochondrial respiration by cuproptosis
ions and cuproptosis, a type of cell death with cuproptosis
dependence (16,36). Since cuproptosis ions induce Aβ
aggregation and the generation of reactive oxygen species, they may
play a role in the progression of AD (37). For example, Aβ aggregation-mediated
oxidative stress leads to mitochondrial dysfunction and accelerates
the progression of AD (38,39).
Zhang et al (40) suggested
that cuproptosis-activated oxidative stress may affect memory
function in patients with AD. The findings of Pilozzi et al
(41) also verified the effects of
cuproptosis redox on AD amyloid pathology. There is a close
association between AD and cuproptosis in mitochondrial function
and the oxidative respiratory chain (42). This is consistent with the
enrichment analysis results in the present study. For example, GO
and KEGG analyses showed that CRGs, such as FDX1, DLD and PDHB, are
closely associated to the oxidative respiratory chain and play a
role in mitochondrial functions. This is consistent with the
findings of Starkov et al (43) and Yang et al (44). Therefore, it can be hypothesized
that there are similarities between the mechanisms of AD and
cuproptosis. However, few studies have explored the association
between cuproptosis and AD, and the mechanisms involved are still
unclear. Therefore, the specific roles of CRGs in AD development
and the immune microenvironment were explored in the present study
to develop a prognostic risk model for AD through machine
learning.
It has been shown that immune cells in the human
brain, such as microglia and astrocytes, are involved in AD
pathogenesis (45). Several
studies have investigated the effects of cuproptosis ions and
cuproptosis on the infiltration of immune cells (46,47).
The correlation analysis of CRGs of infiltrating immune cells in
the present study showed that almost all genes were strongly
associated with dendritic cell activation and monocytes. Other
studies have also proven the significantly higher infiltration of
primitive B cells and neutrophils in the hippocampus of patients
with AD (48,49). Subsequent experiments revealed the
high similarity between DLD and PDHB in the infiltration of immune
cells, supporting the strong positive association between these two
variables, as shown by the correlation analysis.
The interactions of various computational biology
fields are prominent in disease prediction research, and there are
numerous machine learning algorithms available today for disease
clinical trait analysis (50). For
example, DMFGAM is a novel deep learning prediction model that
performs well in disease drug discovery prediction and this model
is expected to introduce new targets for AD drug development due to
the failure of clinical trials involving multiple drugs targeting
the disease (51,52). Additionally, some research has
indicated that by examining the mechanism of action of non-coding
RNAs in AD (53), as well as the
recently proposed computational model GCNCRF, which is based on
graph convolutional neural networks and conditional random fields
in the model (54), it is
anticipated to create a new avenue for AD diagnosis and treatment.
It can predict human lncRNA-miRNA interactions more accurately by
grasping the feature information of important nodes (55). This shows the importance of machine
learning algorithms in disease prediction. The present study
compared four selected machine learning classifiers (RF, SVM, GLM
and XGB) and verified that the SVM model had a higher prediction
accuracy through a more precise multifactor analysis.
The present study results confirmed the acceptable
diagnostic power of the AD risk prediction model developed based on
five cuproptosis genes (including DLD, FDX1, GLS, PDHB and DBT).
The FDX1 gene promotes lipoylation of pyruvate dehydrogenase and
α-ketoglutarate dehydrogenase, which in turn affects the TCA cycle;
decreased expression of FDX1 promotes mitochondrial TCA cycling
(56). By contrast, the PDHB gene
and the DLD gene are involved in encoding the pyruvate
dehydrogenase complex, which is essential for mitochondrial
respiration (57) and is also
closely associated with the regulation of FDX1 and AD (58,59).
The branched-chain α-ketoacid dehydrogenase complex is an
endomitochondrial enzyme complex that influences the catabolism of
the branched-chain amino acids isoleucine, leucine and valine, and
it has been closely linked to the pathogenesis of AD (60). The DBT gene encoding the
transacylase E2 subunit is also involved in the formation of this
complex (60). By contrast, the
GLS gene, an ammonia metabolism gene, has been reported to be
associated with a wide range of glutamate signaling disorders,
including AD (61). In the present
study, significant differences in the expression levels of DLD,
FDX1, GLS, DBT and PDHB were found between the AD group and the
normal group. The results showed an increase in DBT expression, and
a decrease in DLD, FDX1, GLS and PDHB expression in the AD group.
The difference between cluster 1 and 2 in the marker pathway
activity also revealed a significant increase in Notch signaling
pathway activity. Kapoor et al (62) and Perna et al (63) also reported an association between
the Notch signaling pathway and AD. The present study validated the
accuracy of a machine learning model developed based on CRGs using
an external dataset, GSE33000, and developed a nomogram for
assessing AD risk using CRG scores. Calibration curves and DCA
confirmed the accuracy of the model.
The present study had several limitations. Firstly,
it was challenging to conduct additional analyses due to the small
sample size of the dataset and the number of patients with AD
available for analysis selection. More clinical trait data are
required in order to further validate the results of the
bioinformatics analysis. Secondly, the present study demonstrated a
correlation between cuproptosis and AD, but no further
investigation was carried out to validate the precise mechanism
underlying the role of related DEGs in AD. In addition, the use of
machine learning algorithms in the present study was limited to the
analysis of clinical traits, and no further in-depth studies, such
as drug screening, were conducted. Therefore, further algorithm
updates are needed in the future.
The present study investigated the complex
association between cuproptosis and AD by identifying five core
cuproptosis genes (DLD, FDX1, GLS, PDHB and DBT) associated with
AD. The in vivo and in vitro experiments also
validated the expression level of these five core cuproptosis genes
in AD models. The present study demonstrated the association
between CRGs and infiltrating immune cells. In addition, a
practical prognostic risk model was developed to assess the risk of
cuproptosis and the pathological consequences of AD. The
association between the five core cuproptosis genes and AD was
validated by multiple data analyses and in vivo and ex
vivo experiments. The present study results revealed the
downregulation of DLD, FDX1, GLS and PDHB and the upregulation of
DBT in patients with AD, compared with healthy individuals. This
differential expression is expected to provide new ideas for the
diagnosis and prognostic monitoring of AD.
Acknowledgements
Not applicable.
Funding
The present study was funded by the Project of Enhancement of
Basic Research Ability of Young and Middle-aged Teachers in Guangxi
Universities (grant no. 2023KY0554) and the Baise City Science and
Technology Program Project (grant nos. 20211807 and 20224139).
Availability of data and materials
The data generated in the present study may be
requested from the corresponding author.
Authors' contributions
RH conducted the validation experiments and
collected the experimental data, and collaborated with ZX on the
statistical analysis and paper writing. MYQ, CYL, GYW and YYW
assisted in the animal feeding and sampling process. ZSH and MYD
participated in the conceptualization of the whole article, revised
the manuscript and participated in the technical support. RH, ZH,
MYD and ZSH confirm the authenticity of all raw data. All authors
read and approved the final version of the manuscript.
Ethics approval and consent to
participate
The present study received ethical approval for the
use of experimental animals from Youjiang Medical University For
Nationalities (Baise, China; approval no. 2023040101).
Patient consent for publication
Not applicable.
Competing interests
The authors declare that they have no competing
interests.
Glossary
Abbreviations
Abbreviations:
|
AD
|
Alzheimer's disease
|
|
Aβ
|
amyloid β-protein
|
|
GEO
|
Gene Expression Omnibus database
|
|
CRGs
|
core cuproptosis genes
|
|
GO
|
Gene Ontology
|
|
KEGG
|
Kyoto Encyclopedia of Genes and
Genomes
|
|
GSVA
|
gene set variation analysis
|
|
DLD
|
dihydrolipoamide dehydrogenase
|
|
FDX1
|
ferredoxin 1
|
|
GLS
|
glutaminase
|
|
PDHB
|
pyruvate dehydrogenase E1 subunit
β
|
|
DBT
|
dihydrolipoamide branched chain
transacylase E2
|
|
Aβ25-35
|
Amyloid β-peptide (25–35)
|
|
OA
|
okadaic acid
|
|
ROS
|
reactive oxygen species
|
References
|
1
|
de San Román EG, Manuel I, Giralt MT,
Ferrer I and Rodríguez-Puertas R: Imaging mass spectrometry (IMS)
of cortical lipids from preclinical to severe stages of Alzheimer's
disease. Biochim Biophys Acta Biomembr. 1859((9 Pt B)): 1604–1614.
2017. View Article : Google Scholar : PubMed/NCBI
|
|
2
|
GBD 2019 Dementia Forecasting
Collaborators, . Estimation of the global prevalence of dementia in
2019 and forecasted prevalence in 2050: An analysis for the global
burden of disease study 2019. Lancet Public health. 7:e105–e125.
2022. View Article : Google Scholar : PubMed/NCBI
|
|
3
|
Rostagno AA: Pathogenesis of Alzheimer's
disease. Int J Mol Sci. 24:1072022. View Article : Google Scholar : PubMed/NCBI
|
|
4
|
Chen YG: Research progress in the
pathogenesis of Alzheimer's disease. Chin Med J (Engl).
131:1618–1624. 2018. View Article : Google Scholar : PubMed/NCBI
|
|
5
|
Di Fede G, Catania M, Maderna E, Ghidoni
R, Benussi L, Tonoli E, Giaccone G, Moda F, Paterlini A, Campagnani
I, et al: Molecular subtypes of Alzheimer's disease. Sci Rep.
8:32692018. View Article : Google Scholar : PubMed/NCBI
|
|
6
|
Scheltens P, De Strooper B, Kivipelto M,
Holstege H, Chételat G, Teunissen CE, Cummings J and van der Flier
WM: Alzheimer's disease. Lancet. 397:1577–1590. 2021. View Article : Google Scholar : PubMed/NCBI
|
|
7
|
Sanchez-Mut JV and Gräff J: Epigenetic
alterations in Alzheimer's disease. Front Behav Neurosci.
9:3472015. View Article : Google Scholar : PubMed/NCBI
|
|
8
|
Kawamata H and Manfredi G: Import,
maturation, and function of SOD1 and its copper chaperone CCS in
the mitochondrial intermembrane space. Antioxid Redox Signal.
13:1375–1384. 2010. View Article : Google Scholar : PubMed/NCBI
|
|
9
|
Scheiber I, Dringen R and Mercer JF:
Copper: Effects of deficiency and overload. Met Ions Life Sci.
13:359–387. 2013.PubMed/NCBI
|
|
10
|
Gromadzka G, Tarnacka B, Flaga A and
Adamczyk A: Copper dyshomeostasis in neurodegenerative
diseases-therapeutic implications. Int J Mol Sci. 21:92592020.
View Article : Google Scholar : PubMed/NCBI
|
|
11
|
Sayre LM, Perry G, Harris PL, Liu Y,
Schubert KA and Smith MA: In situ oxidative catalysis by
neurofibrillary tangles and senile plaques in Alzheimer's disease:
A central role for bound transition metals. J Neurochem.
74:270–279. 2000. View Article : Google Scholar : PubMed/NCBI
|
|
12
|
Chen LL, Fan YG, Zhao LX, Zhang Q and Wang
ZY: The metal ion hypothesis of Alzheimer's disease and the
anti-neuroinflammatory effect of metal chelators. Bioorg Chem.
131:1063012023. View Article : Google Scholar : PubMed/NCBI
|
|
13
|
Tang D, Chen X and Kroemer G: Cuproptosis:
A copper-triggered modality of mitochondrial cell death. Cell Res.
32:417–418. 2022. View Article : Google Scholar : PubMed/NCBI
|
|
14
|
Garza NM, Swaminathan AB, Maremanda KP,
Zulkifli M and Gohil VM: Mitochondrial copper in human genetic
disorders. Trends Endocrinol Metab. 34:21–33. 2023. View Article : Google Scholar : PubMed/NCBI
|
|
15
|
Tsvetkov P, Coy S, Petrova B, Dreishpoon
M, Verma A, Abdusamad M, Rossen J, Joesch-Cohen L, Humeidi R,
Spangler RD, et al: Copper induces cell death by targeting
lipoylated TCA cycle proteins. Science. 375:1254–1261. 2022.
View Article : Google Scholar : PubMed/NCBI
|
|
16
|
Xie J, Yang Y, Gao Y and He J:
Cuproptosis: Mechanisms and links with cancers. Mol Cancer.
22:462023. View Article : Google Scholar : PubMed/NCBI
|
|
17
|
Swerdlow RH: Mitochondria and
mitochondrial cascades in Alzheimer's disease. J Alzheimers Dis.
62:1403–1416. 2018. View Article : Google Scholar : PubMed/NCBI
|
|
18
|
Macdonald R, Barnes K, Hastings C and
Mortiboys H: Mitochondrial abnormalities in Parkinson's disease and
Alzheimer's disease: Can mitochondria be targeted therapeutically?
Biochem Soc Trans. 46:891–909. 2018. View Article : Google Scholar : PubMed/NCBI
|
|
19
|
Nie B, Duan Y, Xie X, Qiu L, Shi S, Fan Z,
Zheng X and Jiang L: Systematic analysis of cuproptosis-related
genes in immunological characterization and predictive drugs in
Alzheimer's disease. Front Aging Neurosci. 15:12045302023.
View Article : Google Scholar : PubMed/NCBI
|
|
20
|
Li R: Data mining and machine learning
methods for dementia research. Methods Mol Biol. 1750:363–370.
2018. View Article : Google Scholar : PubMed/NCBI
|
|
21
|
Duffy IR, Boyle AJ and Vasdev N: Improving
PET imaging acquisition and analysis with machine learning: A
narrative review with focus on Alzheimer's disease and oncology.
Mol Imaging. 18:15360121198690702019. View Article : Google Scholar : PubMed/NCBI
|
|
22
|
Lardenoije R, Roubroeks JAY, Pishva E,
Leber M, Wagner H, Iatrou A, Smith AR, Smith RG, Eijssen LMT,
Kleineidam L, et al: Alzheimer's disease-associated
(hydroxy)methylomic changes in the brain and blood. Clin
Epigenetics. 11:1642019. View Article : Google Scholar : PubMed/NCBI
|
|
23
|
Narayanan M, Huynh JL, Wang K, Yang X, Yoo
S, McElwee J, Zhang B, Zhang C, Lamb JR, Xie T, et al: Common
dysregulation network in the human prefrontal cortex underlies two
neurodegenerative diseases. Mol Syst Biol. 10:7432014. View Article : Google Scholar : PubMed/NCBI
|
|
24
|
Kanehisa M, Furumichi M, Sato Y, Kawashima
M and Ishiguro-Watanabe M: KEGG for taxonomy-based analysis of
pathways and genomes. Nucleic Acids Res. 51((D1)): D587–D592. 2023.
View Article : Google Scholar : PubMed/NCBI
|
|
25
|
Ritchie ME, Phipson B, Wu D, Hu Y, Law CW,
Shi W and Smyth GK: limma powers differential expression analyses
for RNA-sequencing and microarray studies. Nucleic Acids Res.
43:e472015. View Article : Google Scholar : PubMed/NCBI
|
|
26
|
Varma S: Blind estimation and correction
of microarray batch effect. PLoS One. 15:e02314462020. View Article : Google Scholar : PubMed/NCBI
|
|
27
|
Newman AM, Liu CL, Green MR, Gentles AJ,
Feng W, Xu Y, Hoang CD, Diehn M and Alizadeh AA: Robust enumeration
of cell subsets from tissue expression profiles. Nat Methods.
12:453–457. 2015. View Article : Google Scholar : PubMed/NCBI
|
|
28
|
Hänzelmann S, Castelo R and Guinney J:
GSVA: Gene set variation analysis for microarray and RNA-seq data.
BMC Bioinformatics. 14:72013. View Article : Google Scholar : PubMed/NCBI
|
|
29
|
My S, Lazareva NA, Onufriev MV, Mitrokhina
OS, YuV M and Gulyaeva NV: Effects of doses of fragment (25–35) of
beta-amyloid peptide on behavior in rats. Neurosci Behav Physiol.
28:564–566. 1998. View Article : Google Scholar : PubMed/NCBI
|
|
30
|
Li Z, Tong Q, Xu H, Hu L, Zhao R, Zhou F,
Pan W and Zhou L: Therapeutic effects of TianDiJingWan on the Aβ
25–35-induced Alzheimer's disease model rats. Evid Based Complement
Alternat Med. 2015:3073502015.PubMed/NCBI
|
|
31
|
Othman MZ, Hassan Z and Has AT: Morris
water maze: A versatile and pertinent tool for assessing spatial
learning and memory. Exp Anim. 71:264–280. 2022. View Article : Google Scholar : PubMed/NCBI
|
|
32
|
Livak KJ and Schmittgen TD: Analysis of
relative gene expression data using real-time quantitative PCR and
the 2(−Delta Delta C(T)) method. Methods. 25:402–408. 2001.
View Article : Google Scholar : PubMed/NCBI
|
|
33
|
Amonruttanapun P, Chongthammakun S and
Chamniansawat S: The effects of okadaic acid-treated SH-SY5Y cells
on microglia activation and phagocytosis. Cell Biol Int.
46:234–242. 2022. View Article : Google Scholar : PubMed/NCBI
|
|
34
|
Yang X, Zhong Y, Wang D and Lu Z: A simple
colorimetric method for viable bacteria detection based on cell
counting Kit-8. Anal Methods. 13:5211–5215. 2021. View Article : Google Scholar : PubMed/NCBI
|
|
35
|
Zhu X, Smith MA, Perry G and Aliev G:
Mitochondrial failures in Alzheimer's disease. Am J Alzheimers Dis
Other Demen. 19:345–352. 2004. View Article : Google Scholar : PubMed/NCBI
|
|
36
|
Mezzaroba L, Alfieri DF, Simão AN and
Reiche EM: The role of zinc, copper, manganese and iron in
neurodegenerative diseases. Neurotoxicology. 74:230–241. 2019.
View Article : Google Scholar : PubMed/NCBI
|
|
37
|
Hureau C and Faller P: Abeta-mediated ROS
production by Cu ions: Structural insights, mechanisms and
relevance to Alzheimer's disease. Biochimie. 91:1212–1217. 2009.
View Article : Google Scholar : PubMed/NCBI
|
|
38
|
Butterfield DA and Boyd-Kimball D: Redox
proteomics and amyloid β-peptide: Insights into Alzheimer disease.
J Neurochem. 151:459–487. 2019. View Article : Google Scholar : PubMed/NCBI
|
|
39
|
Jansen IE, van der Lee SJ, Gomez-Fonseca
D, de Rojas I, Dalmasso MC, Grenier-Boley B, Zettergren A, Mishra
A, Ali M, Andrade V, et al: Genome-wide meta-analysis for
Alzheimer's disease cerebrospinal fluid biomarkers. Acta
Neuropathol. 144:821–842. 2022. View Article : Google Scholar : PubMed/NCBI
|
|
40
|
Zhang Y, Zhou Q, Lu L, Su Y, Shi W, Zhang
H, Liu R, Pu Y and Yin L: Copper induces cognitive impairment in
mice via modulation of cuproptosis and CREB signaling. Nutrients.
15:9722023. View Article : Google Scholar : PubMed/NCBI
|
|
41
|
Pilozzi A, Yu Z, Carreras I, Cormier K,
Hartley D, Rogers J, Dedeoglu A and Huang X: A preliminary study of
Cu exposure effects upon Alzheimer's amyloid pathology.
Biomolecules. 10:4082020. View Article : Google Scholar : PubMed/NCBI
|
|
42
|
Huang X: A concise review on oxidative
stress-mediated ferroptosis and cuproptosis in Alzheimer's disease.
Cells. 12:13692023. View Article : Google Scholar : PubMed/NCBI
|
|
43
|
Starkov AA, Fiskum G, Chinopoulos C,
Lorenzo BJ, Browne SE, Patel MS and Beal MF: Mitochondrial
alpha-ketoglutarate dehydrogenase complex generates reactive oxygen
species. J Neurosci. 24:7779–7788. 2004. View Article : Google Scholar : PubMed/NCBI
|
|
44
|
Yang W, Guo Q, Wu H, Tong L, Xiao J, Wang
Y, Liu R, Xu L, Yan H and Sun Z: Comprehensive analysis of the
cuproptosis-related gene DLD across cancers: A potential prognostic
and immunotherapeutic target. Front Pharmacol. 14:11114622023.
View Article : Google Scholar : PubMed/NCBI
|
|
45
|
Rajesh Y and Kanneganti TD: Innate immune
cell death in neuroinflammation and Alzheimer's disease. Cells.
11:18852022. View Article : Google Scholar : PubMed/NCBI
|
|
46
|
Suliman IH, Kim K, Chen W, Kim Y, Moon JH,
Son S and Nam J: Metal-based nanoparticles for cancer
metalloimmunotherapy. Pharmaceutics. 15:20032023. View Article : Google Scholar : PubMed/NCBI
|
|
47
|
Wang L, Cao Y, Guo W and Xu J: High
expression of cuproptosis-related gene FDX1 in relation to good
prognosis and immune cells infiltration in colon adenocarcinoma
(COAD). J Cancer Res Clin Oncol. 149:15–24. 2023. View Article : Google Scholar : PubMed/NCBI
|
|
48
|
Huang LT, Zhang CP, Wang YB and Wang JH:
Association of peripheral blood cell profile with Alzheimer's
disease: A meta-analysis. Front Aging Neurosci. 14:8889462022.
View Article : Google Scholar : PubMed/NCBI
|
|
49
|
Song L, Yang YT and Guo Q; ZIB Consortium;
Zhao XM, : Cellular transcriptional alterations of peripheral blood
in Alzheimer's disease. BMC Med. 20:2662022. View Article : Google Scholar : PubMed/NCBI
|
|
50
|
Waschkies KF, Soch J, Darna M, Richter A,
Altenstein S, Beyle A, Brosseron F, Buchholz F, Butryn M, Dobisch
L, et al: Machine learning-based classification of Alzheimer's
disease and its at-risk states using personality traits, anxiety,
and depression. Int J Geriatr Psychiatry. 38:e60072023. View Article : Google Scholar : PubMed/NCBI
|
|
51
|
Wang T, Sun J and Zhao Q: Investigating
cardiotoxicity related with hERG channel blockers using molecular
fingerprints and graph attention mechanism. Comput Biol Med.
153:1064642023. View Article : Google Scholar : PubMed/NCBI
|
|
52
|
Becker RE and Greig NH: Why so few drugs
for Alzheimer's disease? Are methods failing drugs? Curr Alzheimer
Res. 7:642–651. 2010. View Article : Google Scholar : PubMed/NCBI
|
|
53
|
Li L, Jin M, Tan J and Xiao B: NcRNAs: A
synergistically antiapoptosis therapeutic tool in Alzheimer's
disease. CNS Neurosci Ther. 30:e144762023. View Article : Google Scholar : PubMed/NCBI
|
|
54
|
Wang W, Zhang L, Sun J, Zhao Q and Shuai
J: Predicting the potential human lncRNA-miRNA interactions based
on graph convolution network with conditional random field. Brief
Bioinform. 23:bbac4632022. View Article : Google Scholar : PubMed/NCBI
|
|
55
|
Zhao J, Sun J, Shuai SC, Zhao Q and Shuai
J: Predicting potential interactions between lncRNAs and proteins
via combined graph auto-encoder methods. Brief Bioinform.
24:bbac5272023. View Article : Google Scholar : PubMed/NCBI
|
|
56
|
Dreishpoon MB, Bick NR, Petrova B, Warui
DM, Cameron A, Booker SJ, Kanarek N, Golub TR and Tsvetkov P: FDX1
regulates cellular protein lipoylation through direct binding to
LIAS. bioRxiv: The preprint server for biology. 2023.02.03.526472.
PubMed/NCBI
|
|
57
|
Patel MS, Nemeria NS, Furey W and Jordan
F: The pyruvate dehydrogenase complexes: Structure-based function
and regulation. J Biol Chem. 289:16615–16623. 2014. View Article : Google Scholar : PubMed/NCBI
|
|
58
|
Dreishpoon MB, Bick NR, Petrova B, Warui
DM, Cameron A, Booker SJ, Kanarek N, Golub TR and Tsvetkov P: FDX1
regulates cellular protein lipoylation through direct binding to
LIAS. J Biol Chem. 299:1050462023. View Article : Google Scholar : PubMed/NCBI
|
|
59
|
Chen Z and Zhong C: Decoding Alzheimer's
disease from perturbed cerebral glucose metabolism: Implications
for diagnostic and therapeutic strategies. Prog Neurobiol.
108:21–43. 2013. View Article : Google Scholar : PubMed/NCBI
|
|
60
|
Hull J, Moraes MU, Brookes E, Love S and
Conway ME: Distribution of the branched-chain α-ketoacid
dehydrogenase complex E1α subunit and glutamate dehydrogenase in
the human brain and their role in neuro-metabolism. Neurochem Int.
112:49–58. 2018. View Article : Google Scholar : PubMed/NCBI
|
|
61
|
Griffin JWD, Liu Y, Bradshaw PC and Wang
K: In silico preliminary association of ammonia metabolism genes
GLS, CPS1, and GLUL with risk of Alzheimer's disease, major
depressive disorder, and type 2 diabetes. J Mol Neurosci.
64:385–396. 2018. View Article : Google Scholar : PubMed/NCBI
|
|
62
|
Kapoor A and Nation DA: Role of Notch
signaling in neurovascular aging and Alzheimer's disease. Semin
Cell Dev Biol. 116:90–97. 2021. View Article : Google Scholar : PubMed/NCBI
|
|
63
|
Perna A, Marathe S, Dreos R, Falquet L,
Egger HA and Auber LA: Revealing NOTCH-dependencies in synaptic
targets associated with Alzheimer's disease. Mol Cell Neurosci.
115:1036572021. View Article : Google Scholar : PubMed/NCBI
|