Introduction
Osteoarthritis (OA) is a debilitating and
multifactorial degenerative joint disease characterized by
articular cartilage erosion and destruction, inflammation of the
synovium, osteoproliferation of the joint edges, synovial
hyperplasia and osteophyte formation at the joint margins (1). OA is associated with a loss of function
of multiple diarthrodial joints in the body. Additionally, the
related articular cartilage fibrosis, chaps, anabrosis and joint
dislocation are major factors contributing to disability in the
older population (2,3). Although various studies have examined
the molecular mechanisms of OA, alterations in the process of
endogenous urinary metabolite formation during OA have not yet been
published from the perspective of metabolomics (4,5).
The discipline of metabolomics comprehensively
examines changes in an organism's response to external processes
under physiological and pathological conditions. This is achieved
by observing how metabolite trajectories change over time when the
biological system is stimulated in order to analyze differences in
the metabolic fingerprint in different states (6,7). Several
different types of analytic platforms are able to achieve
reasonable coverage of the metabolome, including nuclear magnetic
resonance, Fourier transform infrared spectroscopy,
high-performance liquid chromatography/mass spectrometry and gas
chromatography-time of flight/mass spectrometry (GC-TOF/MS)
(8). Among these, GC-TOF/MS is one
of the most powerful and simple analytical platforms for achieving
a comprehensive metabonomic analysis, with high sensitivity and
reproducibility (9). Urine is
commonly used as the analysis sample for metabolomics as GC-TOF/MS
detection of urinary metabolomics has many advantages, such as
being non-invasive, sensitive and rapid (10). Moreover, urinary metabonomic analysis
is effective for monitoring the dynamic changes that occur during
the progression of OA. Therefore, metabolomic methods ‘import’ the
information from OA pathogenesis research to assess potential
biomarkers that show disease-specific changes that may be related
to the physiological state of biological systems, which can be
applied widely (11).
The aim of the present study was to determine
changes in the urinary metabolic profile in rats with knee
osteoarthritis using GC-TOF/MS techniques to assess the perturbed
metabolites to elucidate the potential metabonomic pathogenesis of
OA.
Materials and methods
Ethics statement
A total of 16 male Sprague-Dawley rats (200±20 g; 7
weeks old; specific pathogen-free grade) were purchased from the
Experimental Animal Center of Anhui Medical University (Anhui,
China). The experimental protocol was approved by the Committee on
the Ethics of Animal Experiments of Anhui University of Chinese
Medicine (Anhui, China; permit number: 2012AH-038-01). All surgery
procedures were performed under sodium pentobarbital anesthesia (2
ml/kg) and all efforts were made to minimize suffering.
Animal experimentation and sample
collection
A total of 16 rats were allowed free access to food
and water and were housed individually in a facility at 18–22°C
with 40–60% humidity and a 12 h light/dark cycle. Following
acclimatization for one week, rats were randomly divided into the
control (n=8) and knee osteoarthritis (KOA) model (n=8) groups. KOA
group rats were injected with 20 µl of 4% papain and 0.03 M
L-cysteine into the right knee on days 1, 3 and 7 to establish the
rat models of KOA. Following 14 days, urine samples were collected
over 12 h from all rats and stored at −80°C until analysis.
Drugs and reagents
Papain, L-cysteine and urease from Canavalia
ensiformis (Jack bean) were purchased from Sigma-Aldrich (Merck
KGaA, Darmstadt, Germany). L-2-chlorobenzene alanine (103616-89-3)
was purchased from Hemboug Biotechnology, Co., Ltd., (Shanghai,
China) and N,O-Bis(trimethylsilyl)trifluoroacetamide, including 1%
v/v trimethylchlorosilane (TCMS) was purchased from REGIS
Technologies, Inc., (Morton Grove, IL, USA).
Instruments for analysis
Gas chromatography chromatograph (Agilent 7890A;
Agilent Technologies, Inc., Santa Clara, CA, USA); mass
spectrometer (Leco Chroma TOF Pegasus 4D; Leco, Co., St Joseph, MI,
USA); and −80°C Ultra-Low Temperature Freezer (Thermo Fisher
Scientific, Inc., Waltham, MA, USA).
Histopathology
Rats were anesthetized intraperitoneally with sodium
pentobarbital (2 ml/kg; intraperitoneal perfusion, Sigma-Aldrich;
Merck KGaA). Blood was removed from the abdominal aorta to
sacrifice the rats. Knee joints of each rat was fixed in 10%
neutral formalin for 24 h at room temperature, then embedded in
paraffin and cut into 4 µm sections. Paraffin-embedded liver
sections were deparaffinized with xylene and rehydrated using an
ethanol gradient (100-70% v/v). The sections were then stained with
0.5% (w/v) hematoxylin (5–10 min) and eosin (1–2 min) at room
temperature for general observation. Cartilage specimens were fixed
in 2.5% glutaraldehyde stationary liquid for 2 h at room
temperature, dehydrated and embedded in an epoxy resin. Samples
were then baked for 12 and 1 h in an oven at 45°C and 65°C,
respectively. Ultra-thin (70 nm) sections were stained with
toluidine blue for 30 min at room temperature. Finally, the
sections were examined using a transmission electron microscope
(JEM-1200X; JEOL Ltd., Tokyo, Japan).
Sample preparation
A total of 100 µl from each sample was added to 1.5
ml Eppendorf tubes and combined with 10 µl of urease suspension
(160 mg/ml in water). Samples were vortexed for 10 sec and
subsequently incubated at 37°C for 1 h to decompose and remove
excess urea, prior the addition of 0.35 ml of the extraction liquid
(Vmethanol:Vchloroform, 3:1).
L-2-chlorophenylalanine (50 µl) from 0.2 mg/ml stock in
dH2O was added to act as an internal standard. All
samples were vortexed for a further 10 sec. Samples were
centrifuged for 10 min at 4,200 × g at 4°C. Supernatant was
transferred (~0.35 ml) into 2-ml GC-TOF/MS glass vials. Extracts
were dried in a vacuum concentrator without heating and 80 µl
methoxymethyl amine salt (dissolved in pyridine; final
concentration, 20 mg/ml) was added into dried metabolites, prior to
incubation at 37°C for 2 h in an oven after mixing and sealing.
Subsequently, 100 µl N,O-Bis(trimethylsilyl)trifluoroacetamide
(containing 1% TCMS; v/v) was added into each sample before sealing
and incubation at 70°C for 1 h. A total of 10 µl standard mixture,
composed of fatty acid methyl esters (C8-C16, 1 mg/ml; C18-C30, 0.5
mg/ml in chloroform) was combined with the sample and cooled to
room temperature. Samples were thoroughly mixed prior to GC-TOF/MS
analysis.
GC-TOF/MS analysis
An Agilent 7890 gas chromatograph system, coupled
with a Pegasus high throughput time-of-flight mass spectrometer,
was used for GC/TOF MS analysis. A DB-5MS capillary column, coated
with 5% diphenyl cross-linked with 95% dimethyl polysiloxane (inner
diameter, 30 m × 250 µm; film thickness, 0.25 µm; J&W
Scientific Inc., Folsom, CA, USA) was used. A 1-µl aliquot of the
analyte was injected in splitless mode. The carrier gas utilized
was helium and the front inlet purge flow was 3 ml/min. There was
agas flow rate of 20 ml/min through the column and the initial
temperature was maintained at 50°C for 1 min, which was raised to
330°C at a rate of 10°C/min−1 and subsequently
maintained at 330°C for 5 min. The temperatures of injection,
transfer line and ion source were 280, 280 and 220°C, respectively,
and the electron impact mode consisted of −70 eV of energy.
Full-scan mode, with an m/z range of 85–600, a rate of 20 spectra
per second and a solvent delay of 366 sec, allowed mass
spectrometry data to be obtained.
Statistical analysis
Raw peaks extraction, data baseline filtering and
calibration of the baseline, peak alignment, deconvolution
analysis, peak identification and integrated analysis were all
performed using Chroma TOF4.3X software and Fiehn Rtx-5 database
(both Laboratory Equipment Corp., Hayward, USA) (12). Principal component analysis (PCA),
partial least squares discriminant analysis (PLS-DA) and orthogonal
partial least-squares discriminant analysis (OPLS-DA) were utilized
to analyze the resulting data, using demonstration Simca Software
(V13.0, Umetrics; Satorius Stedim Biotech, Umea, Sweden).
Statistical analysis was performed using one-way analysis of
variance and Student-Newman-Keul's testing, using SPSS 17.0
software (SPSS, Inc., Chicago, IL, USA). P<0.05 was considered
to indicate a statistically significant difference.
Results
Histological changes
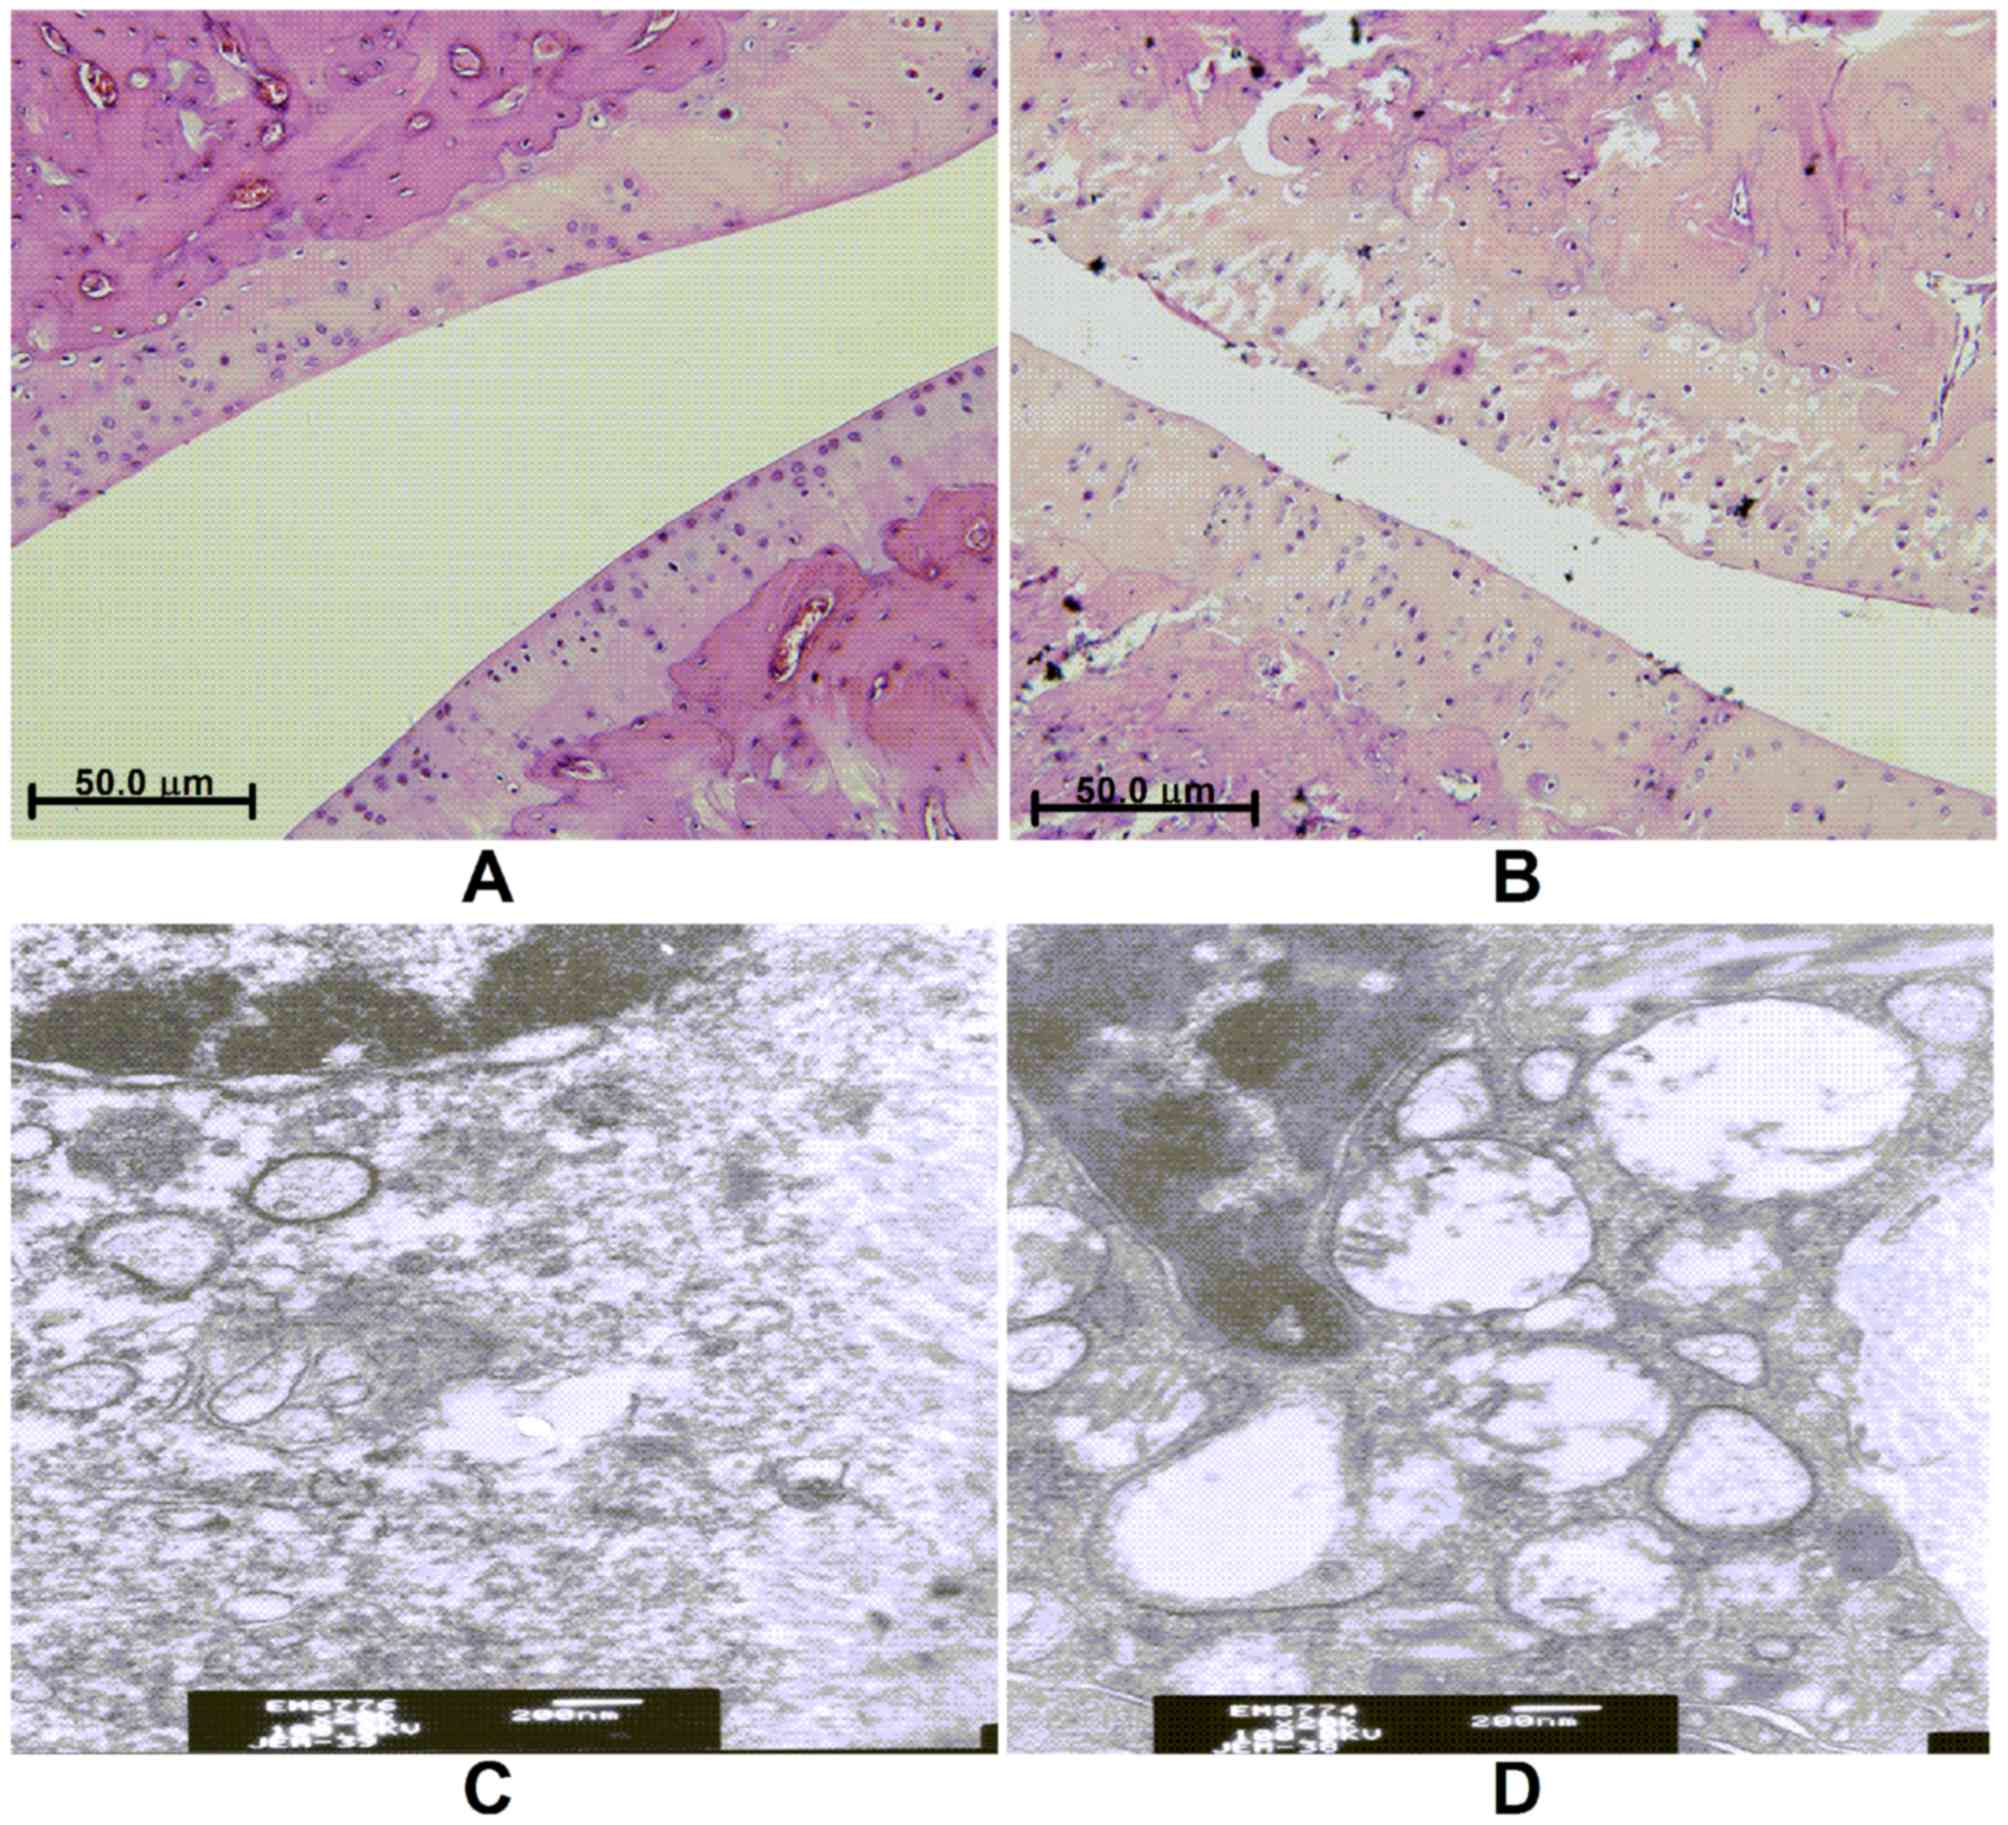
In the knee joints of the control group, H&E
staining exhibited an orderly monolayer of synovial lining cells
and cartilage, with an intact tidemark, normal cartilage cells, and
no inflammatory cell infiltration or collagen fiber hyperplasia. In
contrast, the joints in the KOA group indicated clear hyperplasia
of the synovial lining cells, which was increased to three or four
layers and gradual inflammatory cell infiltration and collagen
fiber hyperplasia was observed.
Tissue ultrastructure in the control group showed
that the cartilage cells were regularly arranged, with uniformly
distributed central matrix fibers. Synovial cells exhibited a
decreased number of rough endoplasmic reticulum and mitochondria in
their cytoplasm, with microvilli protruding from the cell surface.
In the KOA group, cartilage cells were irregularly shaped with a
sparse matrix of plain fibers and synovial cells contained an
increased number of rough endoplasmic reticulum in their cytoplasm.
Furthermore, synovial cells exhibited mitochondrial degeneration
with the appearance of some cavitation, as well as fewer microvilli
protruding from the cell surface (Fig.
1).
Metabolite assignments with GC-TOF/MS
spectroscopy
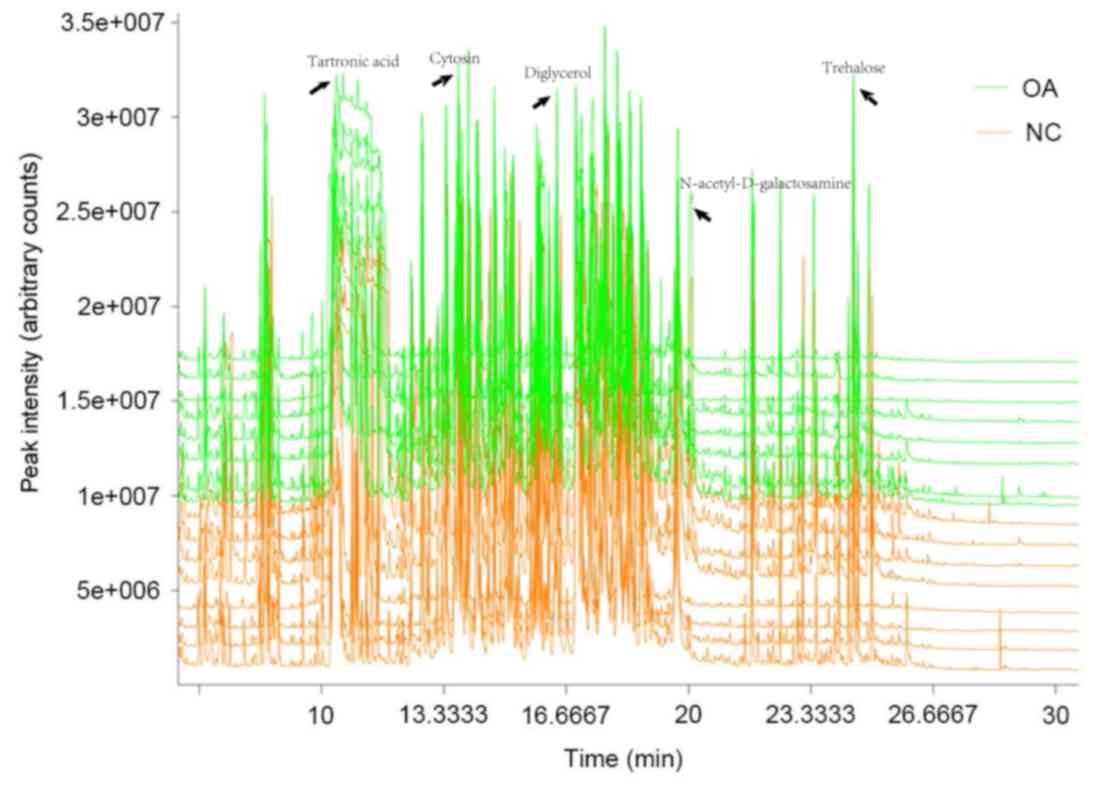
The total ion current (TIC) was expressed in
response to all of the ions that contribute to the chromatogram,
each peak of which represents a specific molecule (13). To investigate the differences between
the metabolic spectra, the TIC of the metabolic spectra was
analyzed. Chroma TOF4.3X software was used to correct the 1,144
data points by filling in blank entries, eliminating noise and
subsequently centralizing to the interior labels. This resulted in
the identification of 914 metabolic compounds with several distinct
differences between the control and KOA spectra (Fig. 2).
PCA
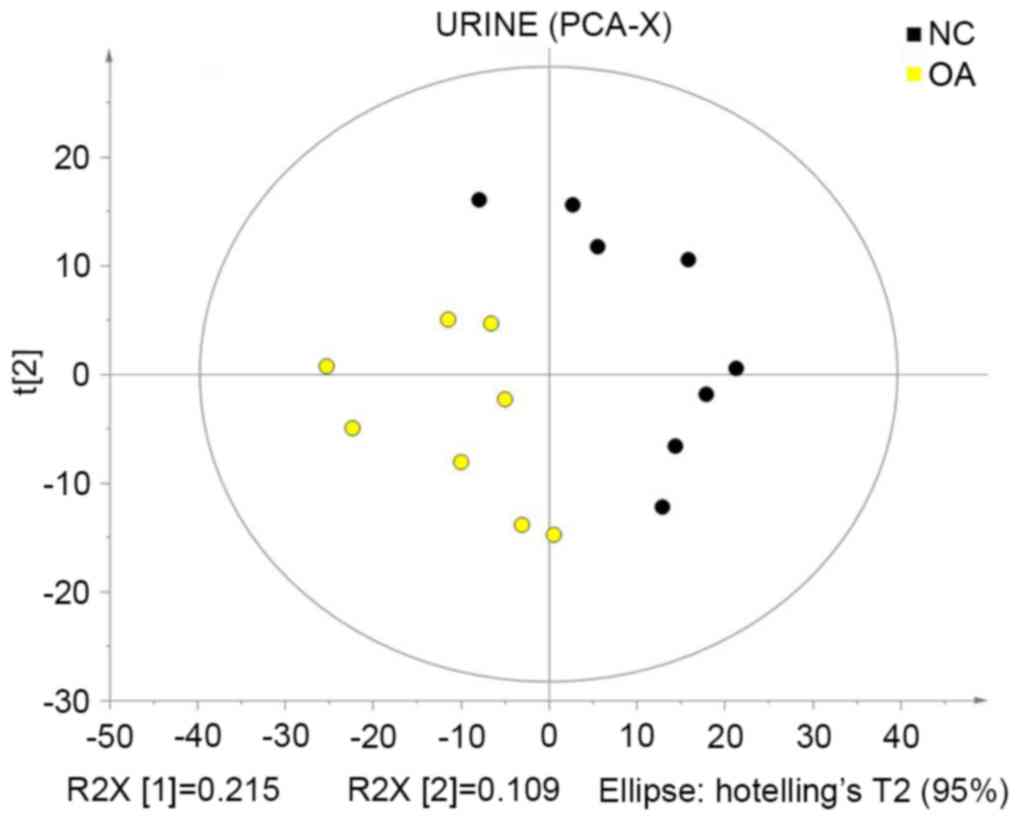
PCA is a method to reduce the dimensionality of a
dataset. Multiple variation variables are reduced into a few
principal components that describe the structure of the original
dataset, where the principal components of each sample represent
the variations that best explain the entire sample dataset, which
may be used to visually describe the changes in the metabolic
patterns of the biological system in different physiological and
pathological states (14,15). In the present study,
SIMCA-P+ software was used to recognize and analyze the
multivariate patterns in the centralized data. PCA was used for
mean-centered scaling to visualize the data and present the
distribution of samples. Control and KOA groups were not completely
separated due to disturbances by various factors; therefore, large
differences were detected between the groups (Fig. 3).
PLS-DA
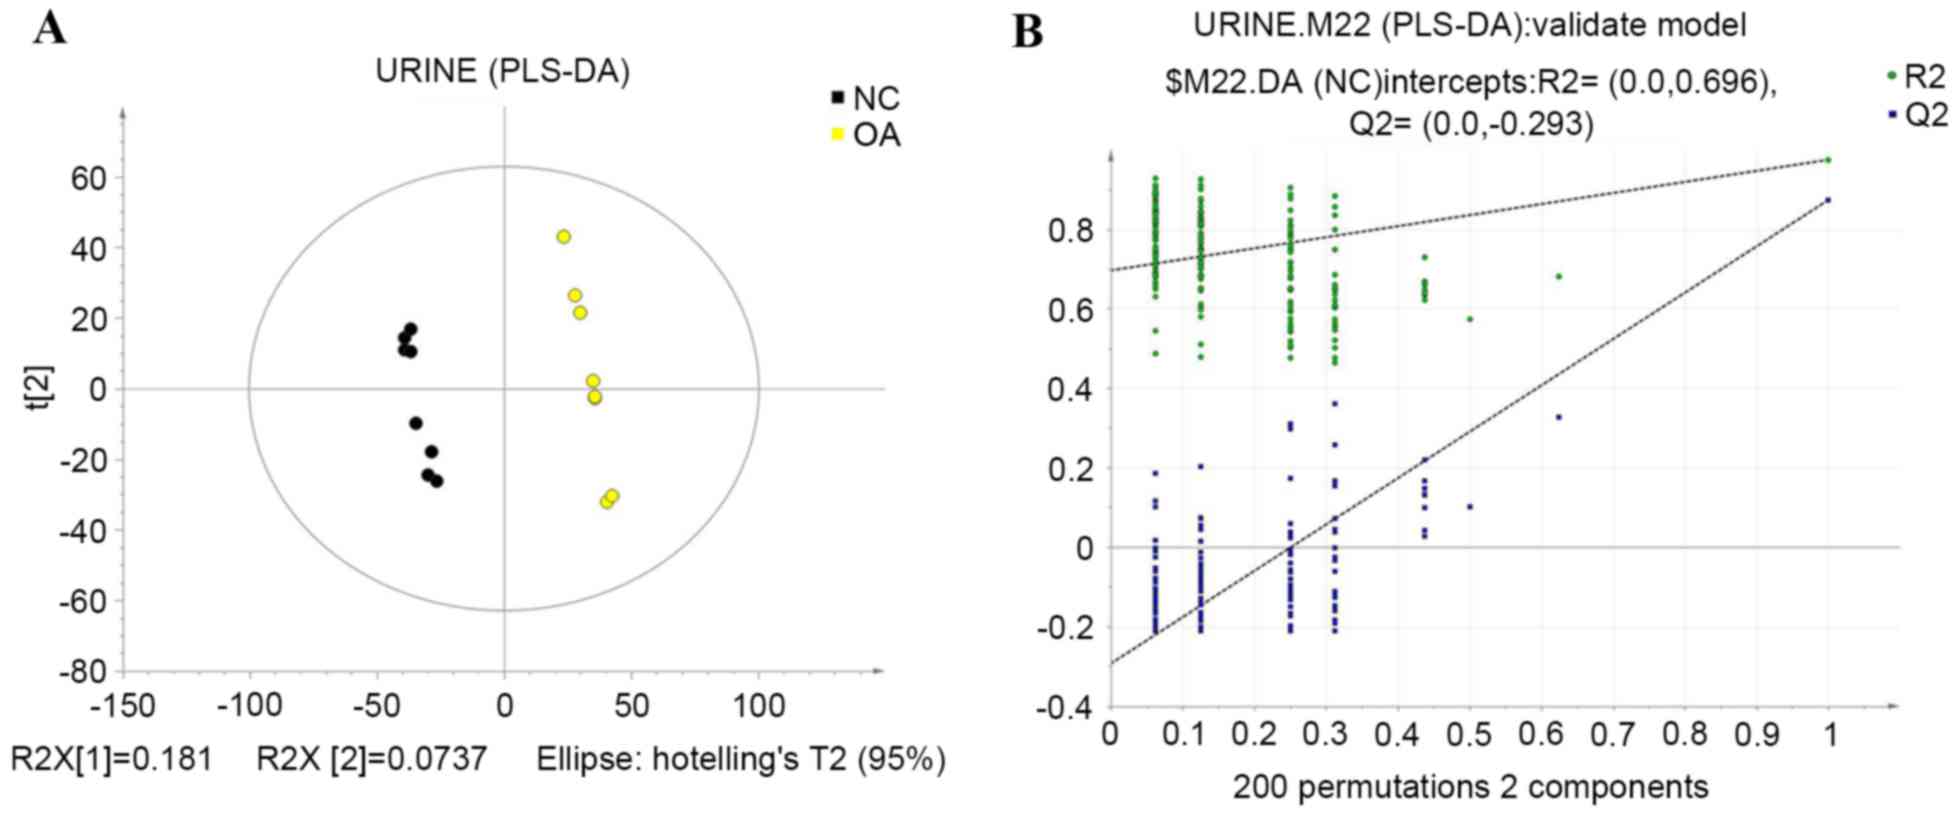
To further separate the groups, PLS-DA was used.
PLS-DA provides a deeper analysis of the main metabolic
characteristics of biological samples in different states and in
the present study, it identified the main variables that
distinguish the sample principal component space, presenting the
potential biomarkers that are characteristic of the different
biological states (16). A PLS-DA
text model, using leave-one-out cross validation with R2
and Q2 that represent the predictable variables and
predictability of the model, were used to judge the validity of the
model. The data indicated that the control and KOA groups were
entirely separate after applying the PLS-DA (R2=0.999;
Q2=0.875), which revealed the stability, fit and
predictivity of the mathematical model. Subsequently, the texting
validity was assessed again by rearranging the experiment randomly
through changing the sort order of the classification variable, Y,
and randomly assigning Q2 up to 200 times. Values of
R2=0.696 and Q2=−0.293 were obtained, which
indicated that the model was reliable and not over-fit. The results
of this analysis are shown in Fig.
4.
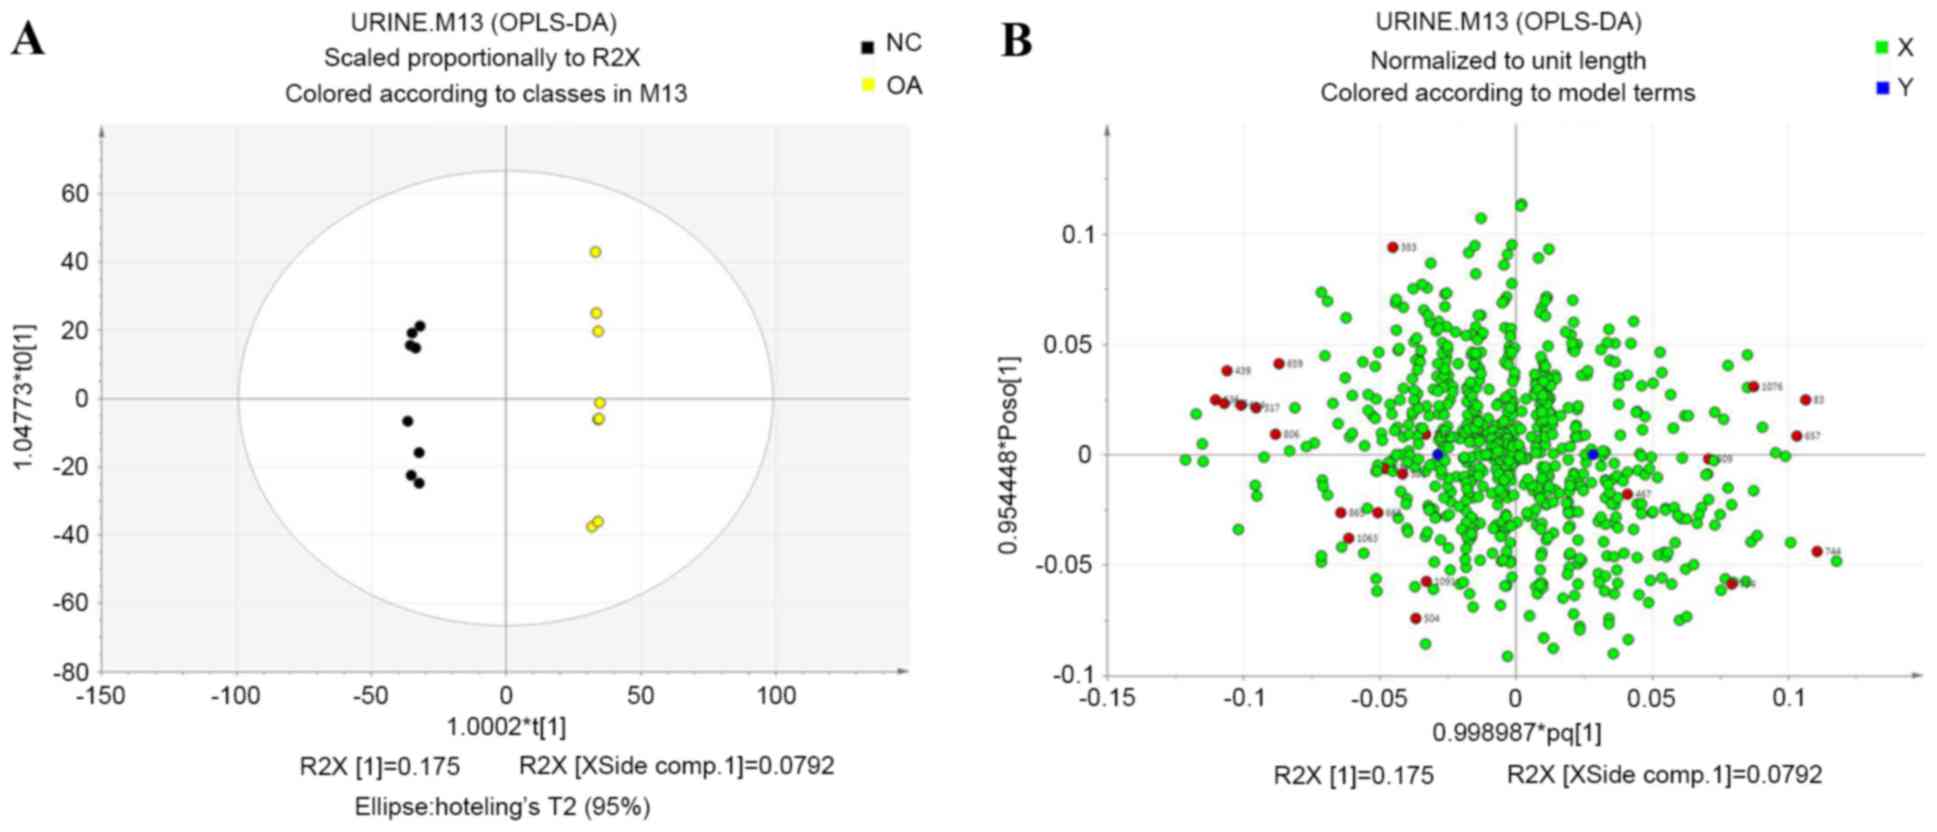
OPLS-DA
To further identify differences between the control
and KOA groups, an orthogonal model was used and the first and
second principal components based on OPLS-DA were analyzed
(17). The two groups were separated
completely after OPLS-DA (Fig. 5),
which suggested that several potential biomarkers in the urine were
clearly altered in the KOA group when compared with the control
group. Loading plots revealed the distribution of variables and
identified differences in the compound present in the samples or
groups based on those variables (18). Each dot in the loading plot
represented a metabolite and the dots near the center indicated
smaller differences between the groups than those shown by dots far
away from the center. The red dots indicated the 23 potential
biomarkers identified in the present experiment.
Identification of endogenous
metabolites
Significant differences between variables associated
with their specificity as potential biomarkers were revealed, using
variable importance projections of >1 with Student's t-tests
(P<0.05; Table I). The retention
time was used to determine the mass spectrogram for each metabolite
and the Fiehn Rtx-5 database was used to authenticate the general
structure of the identified potential biomarkers (19). Based on that analysis, multiple
components were revealed as potential biomarkers, including,
alanine, α-ketoglutarate, asparagine, maltose and glutamine, all of
which were identified to be significantly altered in the KOA group
when compared to the control group (P<0.05; Table I).
 | Table I.Biomarkers and change trends of KOA
rats in each group. |
Table I.
Biomarkers and change trends of KOA
rats in each group.
| No. | VarID | Possible
compounds | RT | VIP |
P-valuea |
|---|
| 1 | 83 | Alanine |
7.9005 | 3.1979 | 0.0099 |
| 2 | 317 | Tartronic acid | 11.8798 | 2.8602 | 0.0061 |
| 3 | 383 | Aminomalonic
acid | 12.9363 | 1.3812 | 0.0435 |
| 4 | 439 | Cytosin | 13.7735 | 3.2025 | 0.0078 |
| 5 | 467 | α -ketoglutaric
acid | 14.2475 | 1.2320 | 0.0256 |
| 6 | 504 | Asparagine | 14.7184 | 1.1209 | 0.0340 |
| 7 | 516 | 5-aminovaleric
acid | 14.8493 | 1.0065 | 0.0218 |
| 8 | 535 | Xylose | 15.1326 | 3.3137 | 0.0007 |
| 9 | 581 | Glutamine | 15.8341 | 1.2421 | 0.0094 |
| 10 | 609 | Diglycerol | 16.3407 | 2.1399 | 0.0181 |
| 11 | 614 | D-(glycerol
1-phosphate) | 16.3322 | 3.0259 | 0.0054 |
| 12 | 639 | Shikimic acid | 16.7887 | 1.4643 | 0.0383 |
| 13 | 657 | Homogentisic
acid | 17.1321 | 3.1284 | 0.0038 |
| 14 | 659 |
N-carbamylglutamate | 17.1346 | 2.6190 | 0.0063 |
| 15 | 668 |
2,8-dihydroxyquinoline | 17.2756 | 1.5259 | 0.0256 |
| 16 | 734 | 4-pyridoxic
acid | 18.1958 | 2.3907 | 0.0072 |
| 17 | 744 | D-galacturonic
acid | 18.4139 | 3.3468 | 0.0001 |
| 18 | 776 | Urocanic acid | 18.9242 | 3.2128 | 0.0027 |
| 19 | 806 |
N-acetyl-D-galactosamine | 19.3819 | 2.6484 | 0.0021 |
| 20 | 865 |
1,4-dihydroxy-2-naphthoic acid | 20.4740 | 1.9413 | 0.0111 |
| 21 | 1063 | Trehalose | 24.8046 | 1.8507 | 0.0059 |
| 22 | 1076 | Maltose | 25.0642 | 2.6504 | 0.0002 |
| 23 | 1091 | Gentiobiose | 25.4649 | 1.0073 | 0.0052 |
Network analysis
To investigate potential biomarkers that may be
involved in metabolic pathways related to OA and to visualize the
connections between the various pathways, physiological,
biochemical and pathophysiological data were combined with the
Human Metabolome Database (http://www.hmdb.ca/about) and observed. Together,
these relevant literatures, which were domestically and
internationally resourced, provided quantitative and metabolic
information on the organism metabolites. The identified potential
biomarkers for KOA were revealed to predominantly be connected with
amino acid metabolism, energy metabolism, nucleic acid metabolism,
fatty acid metabolism and vitamin B6 metabolism
(Fig. 6).
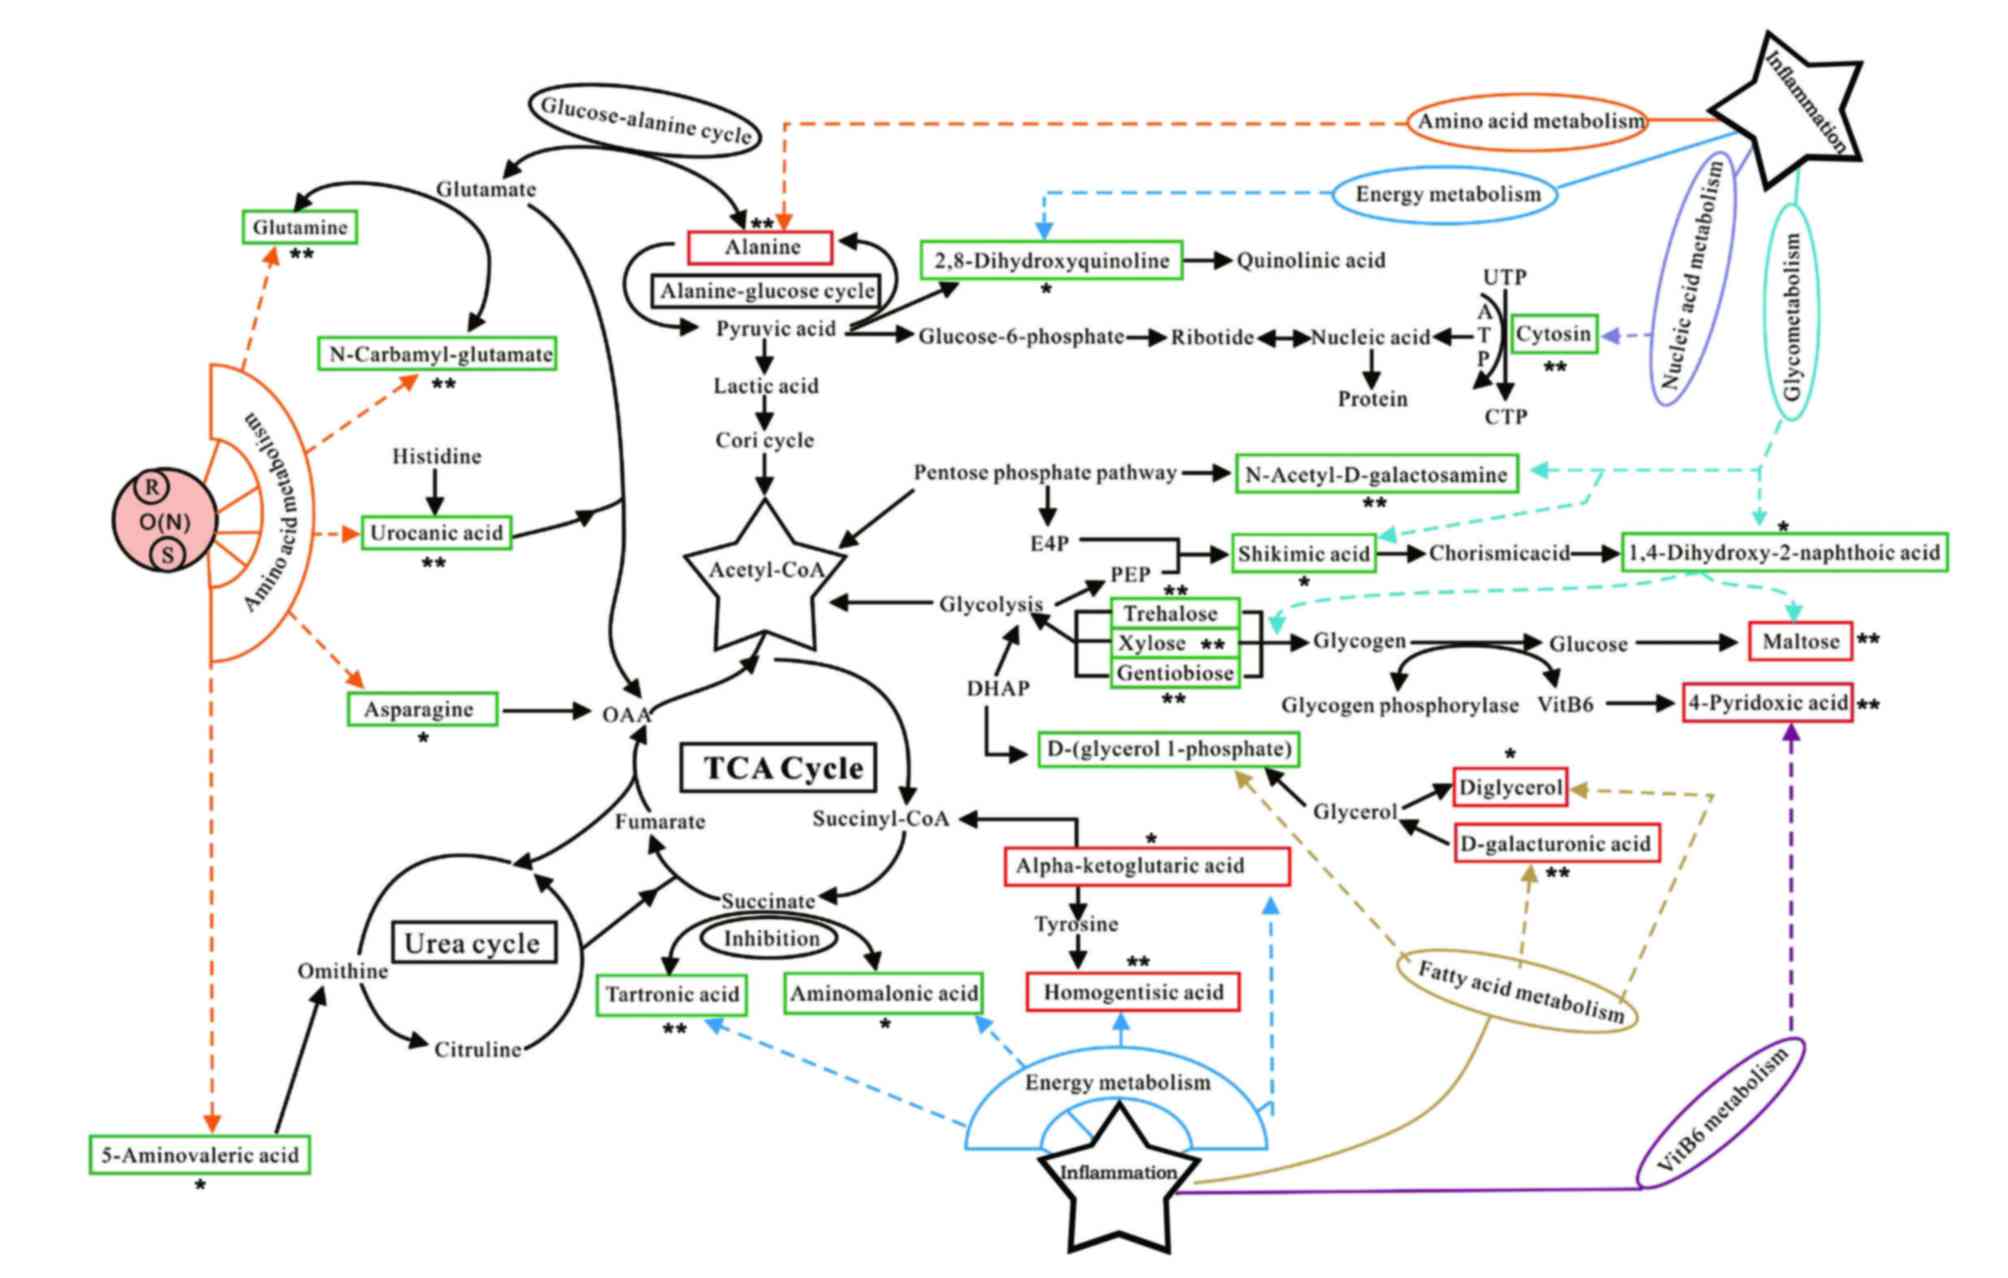 | Figure 6.Pathway network analysis. Metabolites
in the red frame depict those that are increased in the KOA model
group when compared to the control group; metabolites in the green
frame depict those that are decreased in the KOA model group when
compared to the control group. Both denote the endogenous
metabolites identified which are associated with various possible
metabolic pathways. KOA, knee osteoarthritis; TCA, triglycerides;
UTP, uridine-triphosphate; ATP, adenosine triphosphate; CTP,
cytidine triphosphate; OAA, oxaloacetate; E4P, erythrose
4-phosphate; DMAP, N,N-Dimethylpyridin-4-amine; succinyl CoA,
Succinyl-Coenzyme A; *P<0.05 vs. control, **P<0.01 vs.
control. |
Discussion
OA is a chronic and progressive joint disease that
causes pathological characteristics, including articular cartilage
erosion and destruction and synovial hyperplasia, particularly in
the knee joint, which eventually results in the complete loss of
joint function (20). Prior studies
have indicated that injecting papain into the joint cavity is
useful in constructing a KOA model, which identifies similar
pathological alterations that are observed with OA in humans
(21,22). In addition, the KOA model may be
established quickly, has a high success rate and is simple to
perform, which explains why it is one of the classical models for
investigating the pathogenesis of OA and drug screening (23,24). The
present study revealed that the synovial lining of the knee joint
contained distinct collagen fiber hyperplasia, along with
substantial inflammatory cell infiltration, which indicated the
successful induction of KOA.
Genomics, proteomics and metabonomics together
constitute ‘systems biology’, which is a discipline used to
qualitatively and quantitatively analyze the small molecule
metabolites of cells at specific times and under certain
conditions, in order to describe the changes in the endogenous
biological metabolites as a whole and their response to internal
and external stimuli (25,26). In the present study, GC-TOF/MS was
used from the perspective of metabonomics to explore the
pathogenesis of OA. A total of 23 potential biomarkers were
identified, including alanine, α-ketoglutarate, asparagine, maltose
and glutamine, all of which may be correlated to amino acid
metabolism, energy metabolism, fatty acid metabolism, vitamin
B6 metabolism or nucleic acid metabolism (27–29).
Glutamine is a non-essential amino acid that is
found in abundance throughout the body and is involved in multiple
metabolic processes. It is synthesized from glutamic acid and
ammonia (30). N-carbamylglutamate
is an azyl product of glutamate through carbamylation. Urocanic
acid is a deamination (breakdown) product of histidine that is
related to oxidative damage as a direct scavenger of reactive
oxygen species (ROS) (31).
5-aminovaleric acid is a type of ornithine that participates in the
urea cycle through amino acid catabiosis and by offering an
amidogen to the urea cycle (32).
Asparagine is generated from oxaloacetic acid by deamination, which
then enters the tricarboxylic acid (TCA) cycle (33). Previous studies have revealed that
hydroxyl radicals, ·OH, are important ROS in OA, which possess the
fastest reactive chemical properties (34–35).
Hydroxyl radicals may react with all types of amino acids,
disrupting the ordered structure that produces amino acid chains of
proteins and inducing collagen degradation and destruction of
articular joint function in OA (36). In the present study, the contents of
glutamine, N-carbamylglutamate, urocanic acid, 5-aminovaleric acid
and asparagine were clearly decreased in the urine samples from the
KOA group of rats, compared with that of the control group, which
may be related to the generation of ·OH as this disrupts the
structure of amino acids.
Alanine is one of the 20 different types of amino
acids that constitute the proteins of the human body. Through the
alanine-glucose cycle, alanine participates in the lactic
acid-glucose cycle and subsequently enters the TCA cycle to
regulate energy metabolism (37). In
cases of chronic inflammation, such as joint inflammation in OA,
lactic acid is a characteristic substance for detection that is
also a pathogenic factor in the transformation of cells and
development of autoantigenicity. When the lactic acid concentration
becomes elevated an organism enters acidosis, thus further inducing
the development of inflammation (38). In the present study, increased
alanine content in the KOA group suggested an abnormal amino acid
metabolism occurring in those animals.
Inflammatory factors in OA inhibit activation of
insulin signaling, glycolysis and the pentose phosphate pathway,
thereby increasing blood glucose levels (39). Phosphoenolpyruvate in the glycolysis
pathway and erythrose 4-phosphate in the pentose phosphate pathway
are synthesis products of shikimic acid that may be broken down
into chorismic acid to generate 1,4-dihydroxy-naphthoic acid
(40). N-acetyl-D-galactosamine,
trehalose, gentiobiose and xylose provide energy for the organism
through the pentose phosphate and glycolysis pathways (41,42).
Maltose is a primary disaccharide in the human diet, formed from
two units of glucose joined with an alpha linkage. It is the second
member of an important biochemical series of glucose chains
(43). In the present study, the
contents of shikimic acid, 1,4-dihydroxy-naphthoic acid,
N-acetyl-D-galactosamine, trehalose, gentiobiose and xylose were
decreased, while the maltose content was increased in the KOA group
when compared with the control group, which may be related to the
inhibition of the glycolysis and pentose phosphate pathways and
increased blood glucose levels.
Tartronic acid and aminomalonic acid are two
products of malonic acid, the structure of which is similar to
succinic acid (44). Malonic acid is
the archetypal example of a competitive inhibitor, which acts
against succinate dehydrogenase (complex II) in the respiratory
electron transport chain, thus mediating the TCA cycle (45). Oxidase activity was decreased in the
present study during inflammatory damage caused by inflammatory
factors and such incomplete oxidation may lead to lactic acid,
pyruvic acid and α-ketoglutaric acid accumulation in the
inflammation center. Furthermore, α-ketoglutaric acid may also be
modified to succinyl-coenzyme A (succinyl CoA) through oxidation
and decarboxylation. Succinyl-CoA produces further succinic acid
and participates in the TCA cycle. Homogentisic acid is an
intermediate of the metabolic breakdown of tyrosine and
phenylalanine, which is found in the urine in cases of alkaptonuria
(46). Mitochondrial dysfunction has
been demonstrated in OA and the vast majority of enzymes that
participate in TCA are located in the mitochondria of the cartilage
cells, which may result in metabolic disturbance and abnormal
metabolic intermediates from the TCA (47). The present study revealed that the
content of α-ketoglutaric acid and homogentisic acid were increased
and tartronic acid and aminomalonic acid were decreased in the KOA
group, suggesting a possible association with abnormal energy
metabolism.
2,8-hydroxyquinoline is a product of pyruvate
metabolism that is further broken down into quinolinic acid.
Quinolinic acid is an anti-inflammatory factor that exhibits
catabolic, anti-microbial, anti-tumor, anti-fungal and anti-cancer
effects (48). Oxygen depletion is
one of the major features of OA, which prevents
2,8-hydroxyquinoline from generating quinolinic acid, thus
aggravating OA-related inflammation. This interpretation is
consistent with the present results, where the content of
2,8-hydroxyquinoline was decreased in the KOA group when compared
with the control group.
Glycerol is an important component of triglycerides
(fats and oils) and phospholipids, which are generated by
D-(glycerol-1-phosphate). The glycerol component may be converted
into glucose by the liver to provide energy for cellular
metabolism. D-(glycerol-1-phosphate) is one of the phosphoric acid
derivatives of glycerol and is generated from dihydroxyacetone
phosphate by glycerophosphate dehydrogenase during glycolysis.
Inflammatory factors inhibit the activation of insulin signaling
and the glycolysis pathway in OA, resulting in decreases of
D-(glycerol-1-phosphate) (49,50).
However, fat mobilization is accelerated, leading to the induction
and activation of phospholipase C during OA, which functions as a
secondary messenger. Glycerol formed from diglyceride also acts as
a secondary messenger and levels of glycerol are increased during
OA, further inducing the production of inflammatory factors
(51). In the present study, the
contents of diglycerol and D-(glycerol-1-phosphate) were increased
in the KOA group when compared with the control, which may be
associated with disorders of fatty acid metabolism.
4-pyridoxic acid is the catabolic product of vitamin
B6. Together with vitamin B6, glycogen
phosphorylase accelerates the transformation of glycogen into
glucose (52). Inflammatory factors
during OA inhibit the activation of insulin signaling, increasing
blood glucose levels. In the present study, 4-pyridoxic acid
content was increased in the KOA group when compared with the
control group. Increases in 4-pyridoxic acid content may be related
to disorders in vitamin B6 metabolism.
Inflammation during OA and ROS can lead to degraded
bases resulting from nucleic acids attacked by the free radicals
that induce collagen degradation, which may subsequently destroy
joint function (53). Cytosine is a
pyrimidine base that is a fundamental unit of nucleic acids and is
involved in the synthesis and metabolism of nucleic acids. Compared
with the control group, the cytosine content was decreased in the
KOA group, which may be related to disorders of nucleic acid
metabolism.
In conclusion, the metabonomic pathogenesis of OA
may be related to disorders of amino acid metabolism, energy
metabolism, fatty acid metabolism, vitamin B6 metabolism
and nucleic acid metabolism.
Acknowledgements
The present study was financially supported by the
National Key Technology Support Program (grant no. 2012BAI26B03).
We are grateful to Ms. Jie Xu and Dr Junliang Deng (Biotree
Bio-technology Co., Ltd., Shanghai, China) for providing help with
data analysis.
Competing interests
The authors declare that they have no competing
interests.
Glossary
Abbreviations
Abbreviations:
|
GC-TOF/MS
|
gas chromatography-time of flight/mass
spectrometry
|
|
SD
|
Sprague-Dawley
|
|
OA
|
osteoarthritis
|
|
KOA
|
knee osteoarthritis
|
|
TMCS
|
tri methyl chloro silane
|
|
IP
|
intraperitoneal perfusion
|
|
H&E
|
hematoxylin and eosin
|
|
TEM
|
transmission electron microscopy
|
|
PCA
|
principal component analysis
|
|
PLS-DA
|
partial least squares discriminant
analysis
|
|
OPLS-DA
|
orthogonal partial least-squares
discriminant analysis
|
|
DEMO
|
demonstration
|
|
TIC
|
total ion current
|
|
VIP
|
variable importance projection
|
|
TCA
|
triglycerides
|
|
ROS
|
reactive oxygen species
|
References
|
1
|
Valdes AM and Spector TD: The clinical
relevance of genetic susceptibility to osteoarthritis. Best Pract
Res Clin Rheumatol. 24:3–14. 2010. View Article : Google Scholar : PubMed/NCBI
|
|
2
|
Adams SB Jr, Setton LA, Kensicki E,
Bolognesi MP, Toth AP and Nettles DL: Global metabolic profiling of
human osteoarthritic synovium. Osteoarthritis Cartilage. 20:64–67.
2012. View Article : Google Scholar : PubMed/NCBI
|
|
3
|
Puig-Junoy J and Ruiz Zamora A:
Socio-economic costs of osteoarthritis: A systematic review of
cost-of-illness studies. Semin Arthritis Rheum. 44:531–541. 2015.
View Article : Google Scholar : PubMed/NCBI
|
|
4
|
Wei Y and Bai L: Recent advances in the
understanding of molecular mechanisms of cartilage degeneration,
synovitis and subchondral bone changes in osteoarthritis. Connect
Tissue Res. 57:245–261. 2016. View Article : Google Scholar : PubMed/NCBI
|
|
5
|
Li H, Hao Z, Zhao L, Liu W, Han Y, Bai Y
and Wang J: Comparison of molecular mechanisms of rheumatoid
arthritis and osteoarthritis using gene microarrays. Mol Med Rep.
13:4599–4605. 2016. View Article : Google Scholar : PubMed/NCBI
|
|
6
|
Fujiwara Y, Kobayashi T, Chayahara N,
Imamura Y, Toyoda M, Kiyota N, Mukohara T, Nishiumi S, Azuma T,
Yoshida M and Minami H: Metabolomics evaluation of serum markers
for cachexia and their intra-day variation in patients with
advanced pancreatic cancer. PLoS One. 9:e1132592014. View Article : Google Scholar : PubMed/NCBI
|
|
7
|
Sun H, Zhang AH, Zou DX, Sun WJ, Wu XH and
Wang XJ: Metabolomics coupled with pattern recognition and pathway
analysis on potential biomarkers in liver injury and
hepatoprotective effects of yinchenhao. Appl Biochem Biotechnol.
173:857–869. 2014. View Article : Google Scholar : PubMed/NCBI
|
|
8
|
Yu K, Sheng G, Sheng J, Chen Y, Xu W, Liu
X, Cao H, Qu H, Cheng Y and Li L: A metabonomic investigation on
the biochemical perturbation in liver failure patients caused by
hepatitis B virus. J Proteome Res. 6:2413–2419. 2007. View Article : Google Scholar : PubMed/NCBI
|
|
9
|
Ressom HW, Xiao JF, Tuli L, Varghese RS,
Zhou B, Tsai TH, Ranjbar MR, Zhao Y, Wang J, Di Poto C, et al:
Utilization of metabolomics to identify serum biomarkers for
hepatocellular carcinoma in patients with liver cirrhosis. Anal
Chim Acta. 743:90–100. 2012. View Article : Google Scholar : PubMed/NCBI
|
|
10
|
Wu D, Cai S, Chen M, Ye L, Chen Z, Zhang
H, Dai F, Wu F and Zhang G: Tissue metabolic responses to salt
stress in wild and cultivated barley. PLoS One. 8:e554312013.
View Article : Google Scholar : PubMed/NCBI
|
|
11
|
Gou X, Tao Q, Feng Q, Peng J, Zhao Y, Dai
J, Wang W, Zhang Y, Hu Y and Liu P: Urine metabolic profile changes
of CCl4-liver fibrosis in rats and intervention effects of Yi Guan
Jian Decoction using metabonomic approach. BMC Complement Altern
Med. 13:1232013. View Article : Google Scholar : PubMed/NCBI
|
|
12
|
Kind T, Wohlgemuth G, Lee DY, Lu Y,
Palazoglu M, Shahbaz S and Fiehn O: FiehnLib: Mass spectral and
retention index libraries for metabolomics based on quadrupole and
time-of-flight gas chromatography/mass spectrometry. Anal Chem.
81:10038–10048. 2009. View Article : Google Scholar : PubMed/NCBI
|
|
13
|
Wu H, Liu T, Ma C, Xue R, Deng C, Zeng H
and Shen X: GC/MS-based metabolomic approach to validate the role
of urinary sarcosine and target biomarkers for human prostate
cancer by microwave-assisted derivatization. Anal Bioanal Chem.
401:635–646. 2011. View Article : Google Scholar : PubMed/NCBI
|
|
14
|
Huang X, Shao L, Gong Y, Mao Y, Liu C, Qu
H and Cheng Y: A metabonomic characterization of CCl4-induced acute
liver failure using partial least square regression based on the
GC/MS metabolic profiles of plasma in mice. J Chromatogr B Analyt
Technol Biomed Life Sci. 870:178–185. 2008. View Article : Google Scholar : PubMed/NCBI
|
|
15
|
Rachakonda V, Gabbert C, Raina A, Bell LN,
Cooper S, Malik S and Behari J: Serum metabolomic profiling in
acute alcoholic hepatitis identifies multiple dysregulated
pathways. PLoS One. 9:e1138602014. View Article : Google Scholar : PubMed/NCBI
|
|
16
|
Li H, Xia X, Li X, Naren G, Fu Q, Wang Y,
Wu C, Ding S, Zhang S, Jiang H, et al: Untargeted metabolomic
profiling of amphenicol-resistant Campylobacter jejuni by
ultra-high-performance liquid chromatography-mass spectrometry. J
Proteome Res. 14:1060–1068. 2015. View Article : Google Scholar : PubMed/NCBI
|
|
17
|
Jin H, Qiao F, Chen L, Lu C, Xu L and Gao
X: Serum metabolomic signatures of lymph node metastasis of
esophageal squamous cell carcinoma. J Proteome Res. 13:4091–4103.
2014. View Article : Google Scholar : PubMed/NCBI
|
|
18
|
Ji P, Wei Y, Sun H, Xue W, Hua Y, Li P,
Zhang W, Zhang L, Zhao H and Li J: Metabolomics research on the
hepatoprotective effect of Angelica sinensis polysaccharides
through gas chromatography-mass spectrometry. J Chromatogr B Analyt
Technol Biomed Life Sci. 973C:1–54. 2014.PubMed/NCBI
|
|
19
|
Wang L, Hou E, Wang Y, Wang Y, Yang L,
Zheng X, Xie G, Sun Q, Liang M and Tian Z: Reconstruction and
analysis of correlation networks based on GC-MS metabolomics data
for young hypertensive men. Anal Chim Acta. 854:95–105. 2015.
View Article : Google Scholar : PubMed/NCBI
|
|
20
|
Stannus O, Jones G, Cicuttini F,
Parameswaran V, Quinn S, Burgess J and Ding C: Circulating levels
of IL-6 and TNF-alpha are associated with knee radiographic
osteoarthritis and knee cartilage loss in older adults.
Osteoarthritis Cartilage. 18:1441–1447. 2010. View Article : Google Scholar : PubMed/NCBI
|
|
21
|
Li X, Lang W, Ye H, Yu F, Li H, Chen J,
Cai L, Chen W, Lin R, Huang Y and Liu X: TouguXiaotong capsule
inhibits the tidemark replication and cartilage degradation of
papain-induced osteoarthritis by the regulation of chondrocyte
autophagy. Int J Mol Med. 31:1349–1356. 2013. View Article : Google Scholar : PubMed/NCBI
|
|
22
|
Guo CQ, Ji B, Chen YN, Zhong DW, Jin Y,
Liu QG, Guo MW, Zhang Y, Liu NG and Chen ZL: Affection of acupotomy
lysis on leu-enkephalin (L-ENK) content in different parts of
centrum of rats with knee osteoarthritis. Zhongguo Gu Shang.
24:656–658. 2011.(In Chinese). PubMed/NCBI
|
|
23
|
Aigner T, Cook JL, Gerwin N, Glasson SS,
Laverty S, Little CB, McIlwraith W and Kraus VB: Histopathology
atlas of animal model systems-overview of guiding principles.
Osteoarthritis Cartilage. 18 Suppl 3:S2–S6. 2010. View Article : Google Scholar : PubMed/NCBI
|
|
24
|
Pritzker KP: Animal models for
osteoarthritis: Processes, problems and prospects. Ann Rheum Dis.
53:406–420. 1994. View Article : Google Scholar : PubMed/NCBI
|
|
25
|
He J, Chen J, Wu L, Li G and Xie P:
Metabolic response to oral microcystin-LR exposure in the rat by
NMR-based metabonomic study. J Proteome Res. 11:5934–5946. 2012.
View Article : Google Scholar : PubMed/NCBI
|
|
26
|
Zira A, Kostidis S, Theocharis S, Sigala
F, Engelsen SB, Andreadou I and Mikros E: 1H NMR-based metabonomics
approach in a rat model of acute liver injury and regeneration
induced by CCl4 administration. Toxicology. 303:115–124. 2013.
View Article : Google Scholar : PubMed/NCBI
|
|
27
|
Neis EP, Sabrkhany S, Hundscheid I,
Schellekens D, Lenaerts K, Olde Damink SW, Blaak EE, Dejong CH and
Rensen SS: Human splanchnic amino-acid metabolism. Amino Acids.
49:161–172. 2017. View Article : Google Scholar : PubMed/NCBI
|
|
28
|
Klimaszewska-Łata J, Gul-Hinc S,
Bielarczyk H, Ronowska A, Zyśk M, Grużewska K, Pawełczyk T and
Szutowicz A: Differential effects of lipopolysaccharide on energy
metabolism in murine microglial N9 and cholinergic SN56 neuronal
cells. J Neurochem. 133:284–297. 2015. View Article : Google Scholar : PubMed/NCBI
|
|
29
|
Zuo H, Ueland PM, Eussen SJ, Tell GS,
Vollset SE, Nygård O, Midttun Ø, Meyer K and Ulvik A: Markers of
vitamin B6 status and metabolism as predictors of incident cancer:
The Hordaland Health Study. Int J Cancer. 136:2932–2939. 2015.
View Article : Google Scholar : PubMed/NCBI
|
|
30
|
Shan L, Liao F, Jin H, Ye F, Tong P, Xiao
L, Zhou J and Wu C: Plasma metabonomic profiling of lumbar disc
herniation and its traditional Chinese medicine subtypes in
patients by using gas chromatography coupled with mass
spectrometry. Mol Biosyst. 10:2965–2973. 2014. View Article : Google Scholar : PubMed/NCBI
|
|
31
|
Jiang M, Chen T, Feng H, Zhang Y, Li L,
Zhao A, Niu X, Liang F, Wang M, Zhan J, et al: Serum metabolic
signatures of four types of human arthritis. J Proteome Res.
12:3769–3779. 2013. View Article : Google Scholar : PubMed/NCBI
|
|
32
|
Hiong KC, Loong AM, Chew SF and Ip YK:
Increases in urea synthesis and the ornithine-urea cycle capacity
in the giant African snail, Achatina fulica, during fasting or
aestivation, or after the injection with ammonium chloride. J Exp
Zool A Comp Exp Biol. 303:1040–1053. 2005. View Article : Google Scholar : PubMed/NCBI
|
|
33
|
Wang X, Liu Y, Li S, Pi D, Zhu H, Hou Y,
Shi H and Leng W: Asparagine attenuates intestinal injury, improves
energy status and inhibits AMP-activated protein kinase signalling
pathways in weaned piglets challenged with Escherichia coli
lipopolysaccharide. Br J Nutr. 114:553–565. 2015. View Article : Google Scholar : PubMed/NCBI
|
|
34
|
Wu L, Liu H, Li L, Liu H, Cheng Q, Li H
and Huang H: Mitochondrial pathology in osteoarthritic
chondrocytes. Curr Drug Targets. 15:710–719. 2014. View Article : Google Scholar : PubMed/NCBI
|
|
35
|
Lepetsos P and Papavassiliou AG:
ROS/oxidative stress signaling in osteoarthritis. Biochim Biophys
Acta. 1862:576–591. 2016. View Article : Google Scholar : PubMed/NCBI
|
|
36
|
Borel M, Pastoureau P, Papon J, Madelmont
JC, Moins N, Maublant J and Miot-Noirault E: Longitudinal profiling
of articular cartilage degradation in osteoarthritis by
high-resolution magic angle spinning 1H NMR spectroscopy:
Experimental study in the meniscectomized guinea pig model. J
Proteome Res. 8:2594–2600. 2009. View Article : Google Scholar : PubMed/NCBI
|
|
37
|
Chen L, Luo Z, Fu W, Liao X, Cui Z and
Zhou J: Detection of urinary metabolomics before and after Pringle
maneuver-induced liver ischemia and reperfusion injury in rats
using gas chromatography-mass spectrometry. Dis Markers.
35:345–351. 2013. View Article : Google Scholar : PubMed/NCBI
|
|
38
|
Wu C, Lei R, Tiainen M, Wu S, Zhang Q, Pei
F and Guo X: Disordered glycometabolism involved in pathogenesis of
Kashin-Beck disease, an endemic osteoarthritis in China. Exp Cell
Res. 326:240–250. 2014. View Article : Google Scholar : PubMed/NCBI
|
|
39
|
Mickiewicz B, Heard BJ, Chau JK, Chung M,
Hart DA, Shrive NG, Frank CB and Vogel HJ: Metabolic profiling of
synovial fluid in a unilateral ovine model of anterior cruciate
ligament reconstruction of the knee suggests biomarkers for early
osteoarthritis. J Orthop Res. 33:71–77. 2015. View Article : Google Scholar : PubMed/NCBI
|
|
40
|
Dolatshahi S, Fonseca LL and Voit EO: New
insights into the complex regulation of the glycolytic pathway in
Lactococcus lactis. II. Inference of the precisely timed control
system regulating glycolysis. Mol Biosyst. 12:37–47. 2016.
View Article : Google Scholar : PubMed/NCBI
|
|
41
|
Kogure T, Kubota T, Suda M, Hiraga K and
Inui M: Metabolic engineering of Corynebacterium glutamicum for
shikimate overproduction by growth-arrested cell reaction. Metab
Eng. 38:204–216. 2016. View Article : Google Scholar : PubMed/NCBI
|
|
42
|
Rossouw D, Heyns EH, Setati ME, Bosch S
and Bauer FF: Adjustment of trehalose metabolism in wine
Saccharomyces cerevisiae strains to modify ethanol yields. Appl
Environ Microbiol. 79:5197–5207. 2013. View Article : Google Scholar : PubMed/NCBI
|
|
43
|
Mathiselvam M, Ramkumar V, Loganathan D
and Pérez S: Effect of distal sugars and interglycosidic linkage on
the N-glycoprotein linkage region conformation: Synthesis and X-ray
crystallographic investigation of β-1-N-alkanamide derivatives of
cellobiose and maltose as disaccharide analogs of the conserved
chitobiosylasparagine linkage. Glycoconj J. 31:71–87. 2014.
View Article : Google Scholar : PubMed/NCBI
|
|
44
|
Motta A, Paris D, D'Amato M, Melck D,
Calabrese C, Vitale C, Stanziola AA, Corso G, Sofia M and
Maniscalco M: NMR metabolomic analysis of exhaled breath condensate
of asthmatic patients at two different temperatures. J Proteome
Res. 13:6107–6120. 2014. View Article : Google Scholar : PubMed/NCBI
|
|
45
|
Minato Y, Fassio SR and Häse CC: Malonate
inhibits virulence gene expression in Vibrio cholerae. PLoS One.
8:e633362013. View Article : Google Scholar : PubMed/NCBI
|
|
46
|
Milan AM, Hughes AT, Davison AS, Devine J,
Usher J, Curtis S, Khedr M, Gallagher JA and Ranganath LR: The
effect of nitisinone on homogentisic acid and tyrosine: A two-year
survey of patients attending the National Alkaptonuria Centre,
Liverpool. Ann Clin Biochem. 54:323–330. 2017. View Article : Google Scholar : PubMed/NCBI
|
|
47
|
Henrotin Y, Kurz B and Aigner T: Oxygen
and reactive oxygen species in cartilage degradation: Friends or
foes? Osteoarthritis Cartilage. 13:643–654. 2005. View Article : Google Scholar : PubMed/NCBI
|
|
48
|
Qi Y, Li S, Pi Z, Song F, Lin N, Liu S and
Liu Z: Metabonomic study of Wu-tou decoction in adjuvant-induced
arthritis rat using ultra-performance liquid chromatography coupled
with quadrupole time-of-flight mass spectrometry. J Chromatogr B
Analyt Technol Biomed Life Sci 953–954. 1–19. 2014.
|
|
49
|
Priori R, Scrivo R, Brandt J, Valerio M,
Casadei L, Valesini G and Manetti C: Metabolomics in rheumatic
diseases: The potential of an emerging methodology for improved
patient diagnosis, prognosis, and treatment efficacy. Autoimmun
Rev. 12:1022–1030. 2013. View Article : Google Scholar : PubMed/NCBI
|
|
50
|
Wurtz P, Wang Q, Kangas AJ, Richmond RC,
Skarp J, Tiainen M, Tynkkynen T, Soininen P, Havulinna AS, Kaakinen
M, et al: Metabolic signatures of adiposity in young adults:
Mendelian randomization analysis and effects of weight change. PLoS
Med. 11:e10017652014. View Article : Google Scholar : PubMed/NCBI
|
|
51
|
Zini N, Lisignoli G, Solimando L,
Bavelloni A, Grassi F, Guidotti L, Trimarchi C, Facchini A and
Maraldi NM: IL1-beta and TNF-alpha induce changes in the nuclear
polyphosphoinositide signalling system in osteoblasts similar to
that occurring in patients with rheumatoid arthritis: An
immunochemical and immunocytochemical study. Histochem Cell Biol.
120:243–250. 2003. View Article : Google Scholar : PubMed/NCBI
|
|
52
|
Yue R, Zhao L, Hu Y, Jiang P, Wang S,
Xiang L, Liu W, Zhang W and Liu R: Rapid-resolution liquid
chromatography TOF-MS for urine metabolomic analysis of
collagen-induced arthritis in rats and its applications. J
Ethnopharmacol. 145:465–475. 2013. View Article : Google Scholar : PubMed/NCBI
|
|
53
|
Madsen RK, Lundstedt T, Gabrielsson J,
Sennbro CJ, Alenius GM, Moritz T, Rantapää-Dahlqvist S and Trygg J:
Diagnostic properties of metabolic perturbations in rheumatoid
arthritis. Arthritis Res Ther. 13:R192011. View Article : Google Scholar : PubMed/NCBI
|