Introduction
Obesity and insulin resistance are closely related
to metabolic syndrome and other diseases. In particular, obesity is
an indicating factor for the pathogenesis of type 2 diabetes
mellitus (T2DM) (1). Adipose cells
induce insulin resistance and proinflammatory cytokine production
(leptin, tumor necrosis factor and interleukin-6) (2), leading to increased fasting blood
glucose levels in patients and ultimately inducing T2DM. Ballantyne
et al have reported that blood glucose levels and liver
insulin sensitivities of T2DM patients can be restored to normal
levels after bariatric surgery and at the 10 year mark
post-surgery, almost 90% of patients present no signs of diabetes
(3).
Genome-wide association study has shown that the
fat-mass and obesity-associated gene (FTO) is significantly
associated with the increase of obesity risk in all current
determined susceptibility loci to obesity (4,5). FTO is
expressed in many metabolic disease-related tissues, including
adipose tissues and skeletal muscles (6,7).
Evidence provided by increasing number of studies have shown that
FTO affects the genetic variation of body mass index (BMI) and
obesity risk of people in China, Japan, the Republic of Korea and
the Philippines (8). In addition, it
has been proved that the association between the FTO gene and
obesity can indirectly regulate the risk of T2DM (9). This study focused on the clinical
significance of the obesity gene FTO in varying degrees of T2DM, so
as to study the value of FTO as a marker for the diagnosis and
prognosis of T2DM.
Patients and methods
General subject information
The study subjects consisted of 110 patients with
T2DM received and treated by the outpatient department of the
Yantai Yuhuangding Hospital between September 2016 and March 2017.
These individuals were separated into mild and severe groups
according to disease severity. In addition, 60 individuals were
selected amongst hospital workers and healthy patients undergoing
routine physical examinations as the normal control group (NC
group). The study was approved by the Ethics Committee of
Yuhuangding Hospital.
Grouping criteria
Mild T2DM group: i) Patients whose glycosylated
hemoglobin (HbA1c) was ≤8%; ii) patients whose diabetic nephropathy
did not reach stage 3 and who showed no kidney injury; iii)
patients whose diabetic retinopathy did not reach the proliferative
standard. Severe T2DM group: i) Patients whose HbA1c was >8%;
ii) patients whose diabetic nephropathy had reached stage 4; iii)
patients with proliferative diabetic retinopathy. Patients with
acute infections and other chronic diseases (e.g., cancer, chronic
obstructive pulmonary disease, asthma, dementia, chronic intestinal
disease, psychosis, cirrhosis), as well as pregnant and lactating
women, were not included in this study. All subjects in this study
provided signed informed consent.
Study methods
Sample collection
All study subjects were forbidden from drinking and
eating for 12 h prior to examinations, which occurred at 7 a.m. At
the examinations: i) Each subject's height, weight, waist and hip
circumference were measured, and the BMI [body weight
(kg)/height2 (m2)] was calculated; ii) blood
(2.5 ml) (fasting blood sample) was collected from every subject.
One sample was placed in a vacuum centrifuge tube for examination
of the following T2DM blood glucose indices: Fasting plasma glucose
(FPG), fasting C-peptide (FCP), HbA1c and fasting insulin (FINs).
Samples in vacuum centrifuge tubes were centrifuged for 15 min at
912 × g, with the upper layer consisting of the serum taken and
stored at −80°C. The other sample was stored in an EDTA
anticoagulant tube for lymphocyte extraction, which was performed
using a human lymphocyte separation reagent kit (TBD, Tianjin,
China) with the extracted lymphocytes stored at −80°C; and iii)
homeostasis model assessment of insulin resistance (HOMA-IR) was
calculated according to the following formula: FINS (mmol/l) × FPG
(mmol/l)/22.5.
The 52 patients in the severe T2DM group were
treated with medication based on patient-specific conditions and
followed up for 12 weeks. During treatment, patient condition data
was regularly collected by a specially assigned person. On the day
prior to the end of treatment, whole blood samples were obtained
from each patient for testing.
Detection of lymphocyte FTO gene
expression by real-time polymerase chain reaction (RT-PCR)
TRIzol reagent (1 ml; Invitrogen Life Technologies,
Carlsbad, CA, USA) was added into an Eppendorf tube (Eppendorf AG,
Hamburg, Germany) containing human lymphocytes and then the tube
was incubated at 4°C for 30 min. Chloroform (200 µl) was added,
upon which the sample was mixed and then centrifuged at 12,000 × g
for 15 min at 4°C. The upper layer of the supernatant was taken and
transferred to a new Eppendorf tube (Eppendorf AG). An equal volume
of isopropanol was added into this new tube, the solution was mixed
and rested on ice for 5 min and then centrifuged at 12,000 × g for
15 min at 4°C. Following this, the supernatant was removed and the
pellet dried with filter paper. Ethanol (75%, 1 ml) was added to
wash the pellet, which was then centrifuged again at 7,500 × g for
5 min at 4°C. Again, the supernatant was discarded and the pellet
was dried at room temperature and then dissolved in 30 µl of
enzyme-free water. A spectrophotometer was utilized to measure the
concentration and purity of the extracted RNA, which was then
subjected to reverse transcription using a two-step reverse
transcription kit (Takara, Tokyo, Japan). Messenger ribonucleic
acids (mRNA) levels were measured using SYBR green (Toyobo, Osaka,
Japan), with glyceraldehyde-3-phosphate dehydrogenase (GAPDH)
expression used as an internal reference. FTO and GAPDH primers
were synthesized by Shanghai Sangon Biotech Co., Ltd. (Shanghai,
China). FTO upstream, 5′-ACTTGGCTCCCTTATCTGACC-3′ and downstream,
5′-TGTGCAGTGTGAGAAAGGCTT-3′. GAPDH upstream,
5′-AGGTCGGTGTGAACGGATTTG-3′ and downstream,
5′-TGTAGACCATGTAGTTGAGGTCA-3′. The computational formula for mRNA
relative expression level of each index was 2−ΔCt [ΔCt =
Ct (target gene) - Ct (GAPDH)].
Detection of serum FTO protein via
western blot analysis
Since there was no available method to measure FTO
protein expression in whole blood lymphocytes, whole blood samples
for each study subject were collected before and after treatment.
Partial serum taken after standing and centrifugation was diluted
10 times with phosphate-buffered saline (PBS) and an appropriate
amount of protease inhibitor cocktail (Sigma-Aldrich, St. Louis,
MO, USA) was added. A serum albumin/immunoglobulin removal kit
(Shanghai Sangon Biotech) was employed to remove high-abundance
proteins. A bicinchoninic acid kit (BCA; Beyotime Biotechnology
Co., Ltd., Guangzhou, China) was used for protein concentration
quantification. Protein samples (40 µg) were added with loading
buffer, then underwent electrophoresis using a 10% acrylamide gel
and were transferred to a membrane. Membranes were incubated
overnight with monoclonal anti-FTO antibodies (1:1,000; Cell
Signaling Technology, Beverly, MA, USA). Ponceau total protein
staining was used as a loading control (10), as many studies have shown that GAPDH
and β-actin internal references were not accurate when analyzing
serum samples. The relative content of the target protein was
detected using enhanced chemiluminescent system (ECL; Merck
Millipore, Billerica, MA, USA).
Statistical analysis
SPSS version 22.0 (SPSS, Inc., Chicago, IL, USA)
statistical software was used to analyze experimental results.
Chi-square test was utilized for enumeration data. Measurement data
were expressed as mean ± standard deviation (SD). Analysis of
variance and paired t-test were applied for sample mean comparison.
Spearman's rank correlation analysis was utilized for
inter-indicator correlation analysis. P<0.05 was considered to
indicate a statistically significant difference.
Results
Comparisons of the patient general
information among the three groups
There were no significant differences among the
groups in age and sex (p>0.05). Compared with those in the NC
group, the BMIs, waist circumferences and hip circumferences of the
T2DM groups were elevated (p<0.05). Compared with the mild T2DM
group, BMI, waist circumference and hip circumference in the severe
T2DM group were increased (p<0.05; Table I).
 | Table I.General patient information comparison
(mean ± standard deviation). |
Table I.
General patient information comparison
(mean ± standard deviation).
| Patient
information | NC group (n=60) | Mild T2DM group
(n=58) | Severe T2DM group
(n=52) |
|---|
| Age (years) | 51.07±3.27 | 50.34±4.20 | 52.03±3.29 |
| Sex
(male/female) | 27/23 | 28/30 | 27/25 |
| BMI
(kg/m2) | 23.45±4.08 |
26.83±2.54a |
28.23±3.50b,c |
| Waist circumference
(cm) | 84.32±7.89 |
87.89±5.76a |
105.32±6.32a,c |
| Hip circumference
(cm) | 90.67±5.65 |
93.58±7.34a |
100.01±8.44b,c |
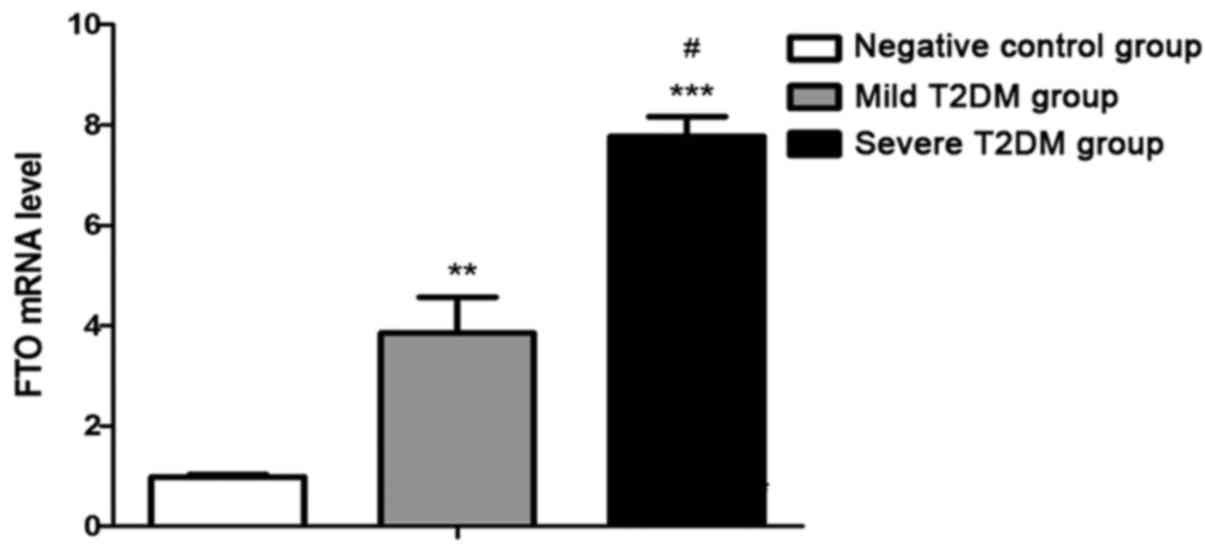
Lymphocyte FTO gene expression
levels
FTO gene expression levels in the mild T2DM group
(p<0.01) and severe T2DM group (p<0.001) were significantly
increased relative to the NC group. FTO gene levels in the severe
T2DM group were higher than in the mild T2DM group (p<0.05;
Fig. 1).
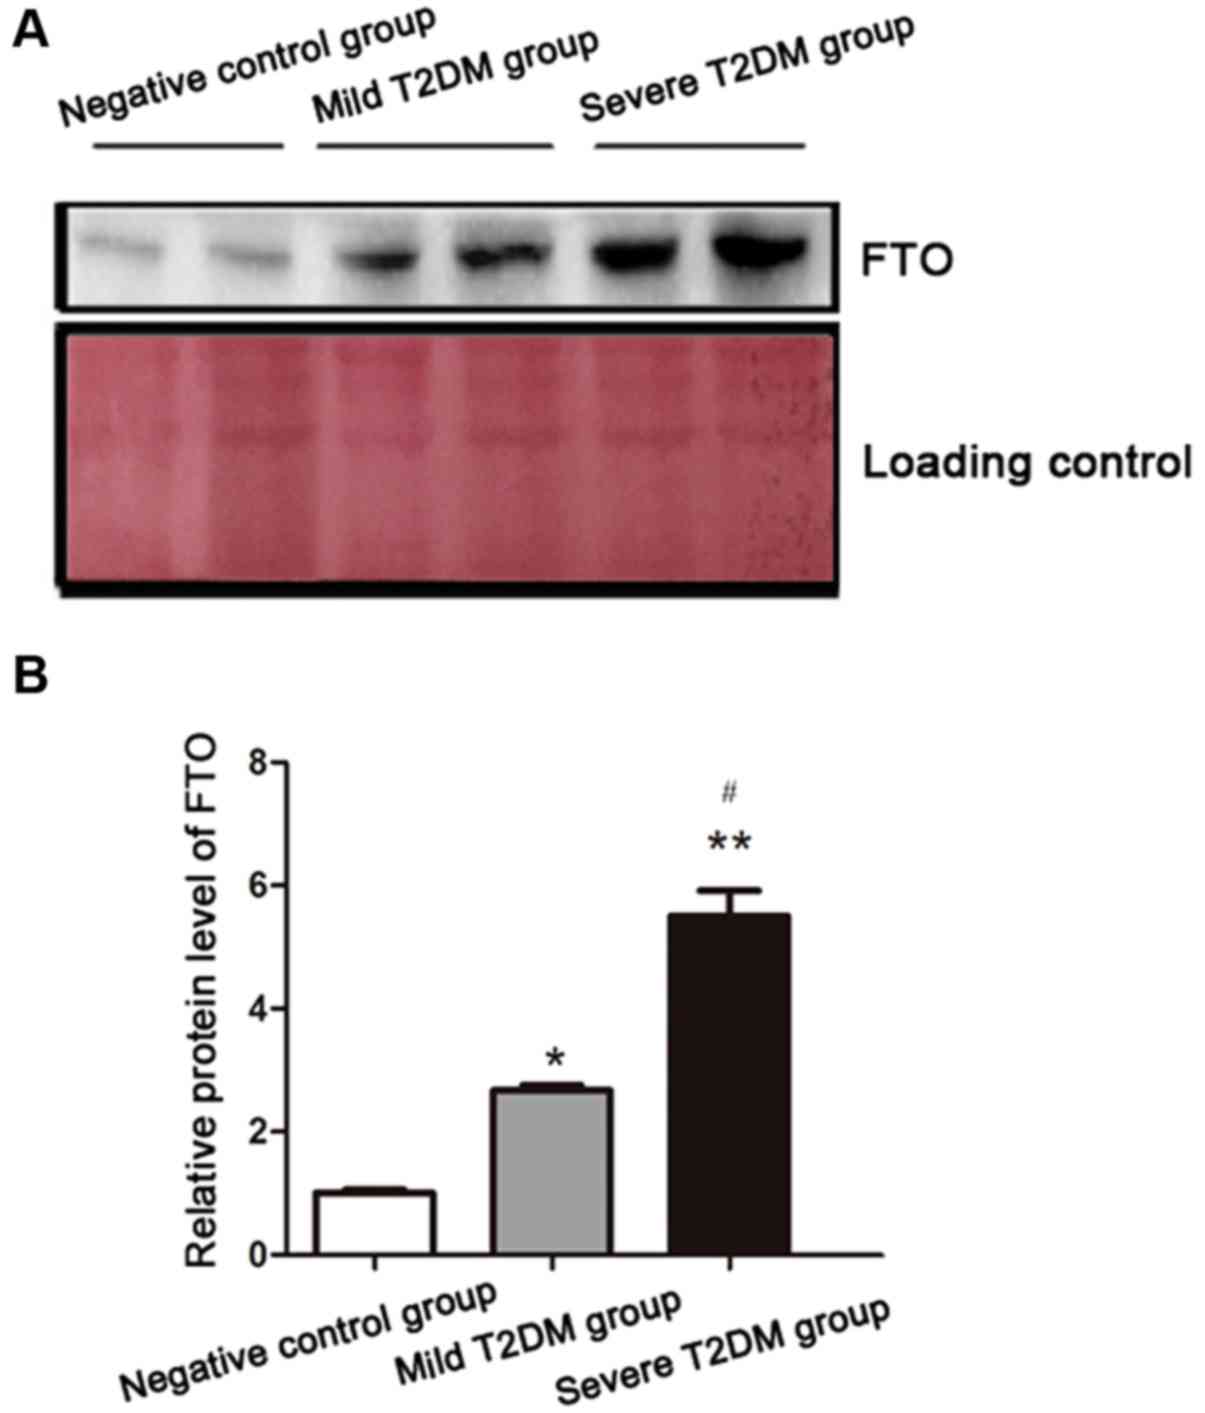
FTO protein content in patient
serum
Serum FTO protein levels were consistent with gene
levels determined via RT-PCR, with FTO significantly increased in
the T2DM groups (Fig. 2).
Blood glucose-related indicators (FPG,
FCP, HbA1c, FINs and HOMA-IR) in normal and T2DM individuals
FPG, FINs, HOMA-IR, FCP and HbA1c values in the two
T2DM groups were higher than in the NC group (p<0.05). Moreover,
there were significant differences between the severe T2DM group
and the mild T2DM group (p<0.05; Table II).
| Table II.Patient blood glucose-related
indicator values (mean ± standard deviation). |
Table II.
Patient blood glucose-related
indicator values (mean ± standard deviation).
| Indexes | NC group (n=60) | Mild T2DM group
(n=58) | Severe T2DM group
(n=52) |
|---|
| FPG (mmol/l) | 6.67±2.03 |
7.89±2.89a |
8.95±3.04a,c |
| FINs (mmol/l) | 7.34±4.13 |
9.04±4.76a |
13.46±6.34b,c |
| HOMA-IR | 1.98±1.02 |
3.03±1.67a |
4.60±2.01b,c |
| FCP (mmol/l) | 342±148.67 |
528±168.05b |
685±186.33a,c |
| HbA1c (%) | 7.03±2.58 |
7.86±3.02a |
9.28±3.40a,c |
Post-treatment changes in severe T2DM
patient blood glucose indices (FPG, FCP, HbA1c and FINs)
We tested the blood glucose-related indicators of
the 52 patients with severe T2DM after they received 12 weeks of
treatment. FPG, FCP, HbA1c, FINs and HOMA-IR values after treatment
were observably decreased when compared with those before treatment
(p<0.05; Table III).
| Table III.Severe T2DM patient BMI and the blood
glucose indices before and after treatment (mean ± standard
deviation). |
Table III.
Severe T2DM patient BMI and the blood
glucose indices before and after treatment (mean ± standard
deviation).
| Indexes | Before treatment | After treatment | t-value | P-value |
|---|
| BMI
(kg/m2) | 28.23±3.50 |
25.97±4.32a | 5.36 | 0.031 |
| FPG (mmol/l) | 9.95±3.04 |
8.12±3.56a | 4.36 | 0.047 |
| FINs (mmol/l) | 13.46±6.34 |
10.74±5.32a | 3.78 | 0.026 |
| HOMA-IR | 4.60±2.01 |
3.35±2.36a | 3.95 | 0.017 |
| FCP (mmol/l) | 685±186.33 |
536±169.30b | 5.80 | 0.0073 |
| HbA1c (%) | 9.28±3.40 |
8.04±2.78a | 4.05 | 0.035 |
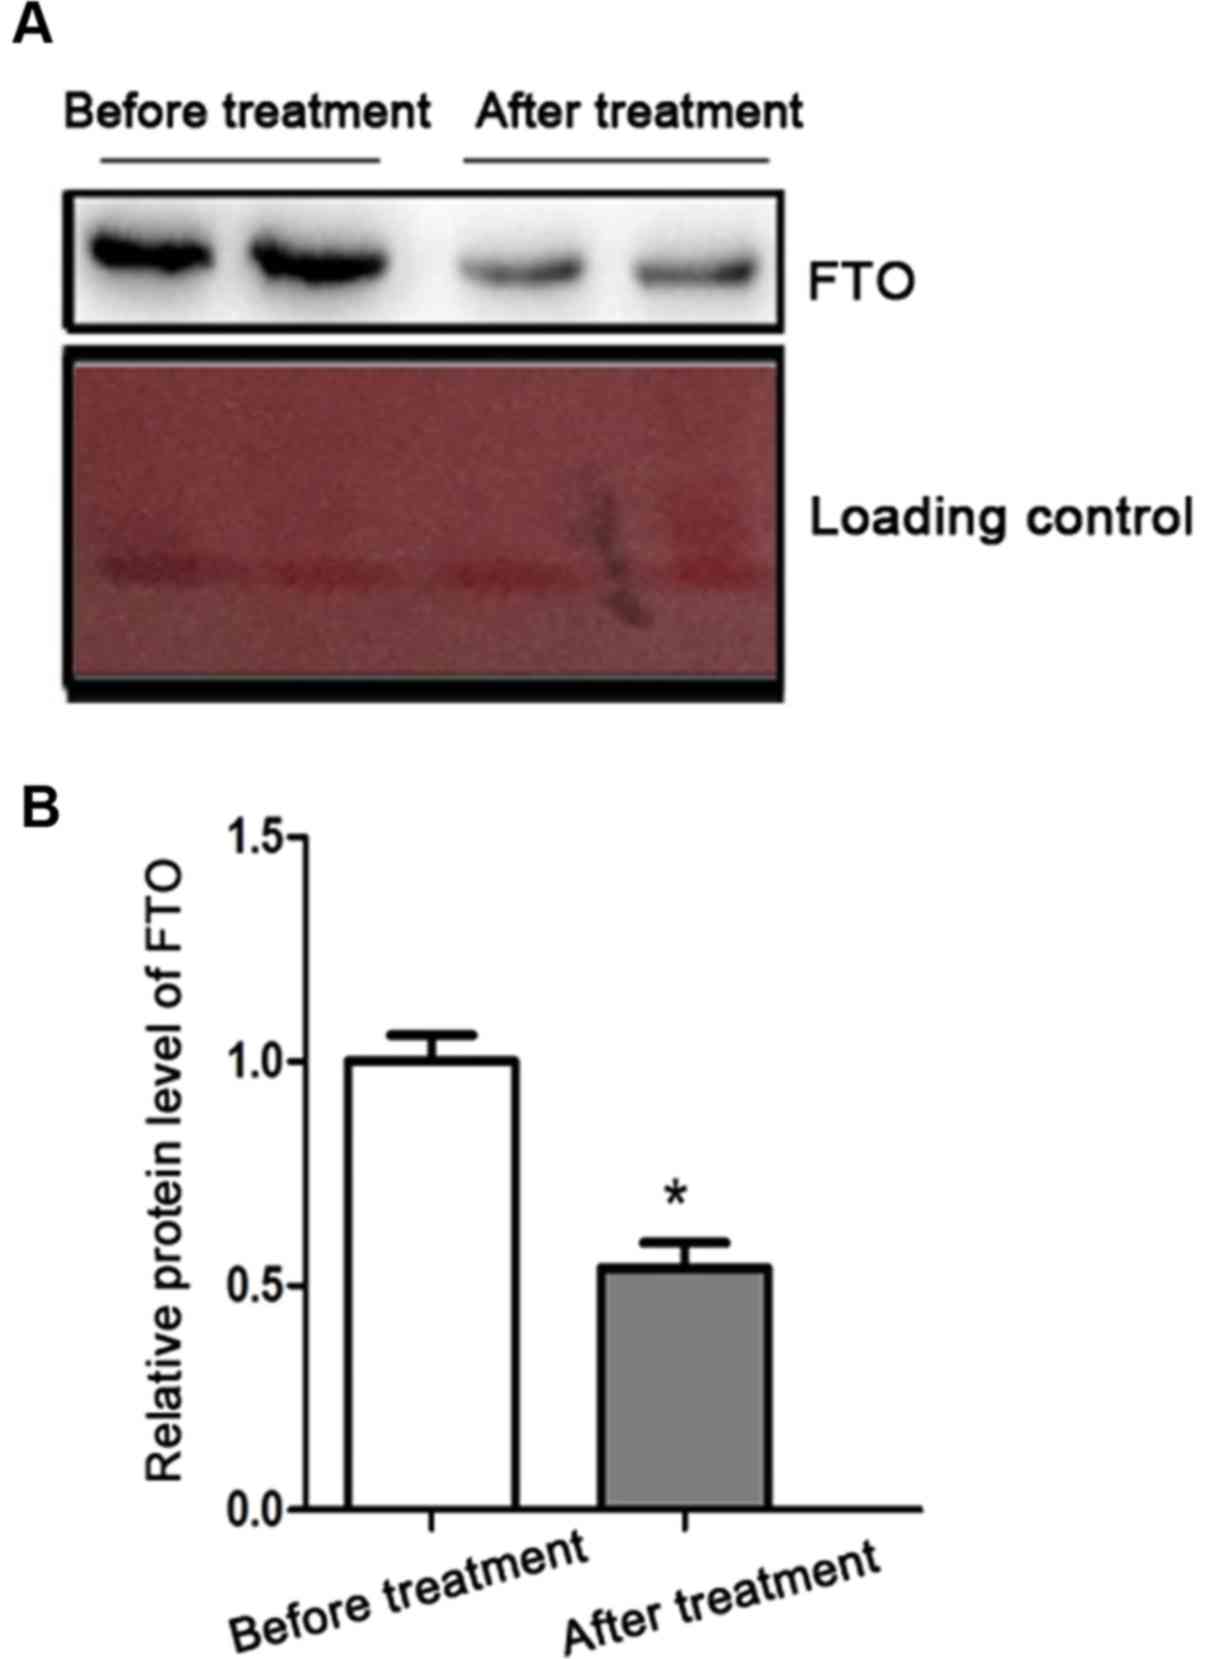
FTO protein expression in severe T2DM
patients before and after treatment
We further explored the relationship between FTO and
T2DM severity. FTO protein levels after treatment was significantly
reduced relative to before treatment (Fig. 3).
Correlation between of FTO protein
expression and other T2DM indicators
Spearman's rank correlation analysis showed that FTO
protein expression was not associated with age or gender, but it
was positively correlated with BMI, waist circumference, hip
circumference, FPG, FCP, HbA1c, FINs and HOMA-IR (p<0.05;
Table IV).
| Table IV.Analysis of the correlation between
FTO and T2DM indicators. |
Table IV.
Analysis of the correlation between
FTO and T2DM indicators.
|
| FTO protein |
|---|
|
|
|
|---|
| Parameters | r value | P-value |
|---|
| Age (years) | 0.054 | 0.072 |
| Sex
(male/female) | 0.032 | 0.065 |
| BMI
(kg/m2) | 0.648 | 0.002 |
| Waist circumference
(cm) | 0.563 | 0.046 |
| Hip circumference
(cm) | 0.572 | 0.041 |
| FPG (mmol/l) | 0.731 | 0.008 |
| FINs (mmol/l) | 0.640 | <0.001 |
| HOMA-IR | 0.752 | <0.001 |
| FCP (mmol/l) | 0.693 | 0.003 |
| HbA1c (%) | 0.728 | <0.001 |
Discussion
Diabetes is a highly prevalent and serious chronic
debilitating disease and has been reported as the fourth leading
cause of death in Europe (11). T2DM
is characterized by progressive insulin resistance and β-cell
dysfunction and usually inactivity and weight are elevated with an
increase in age or food intake (12). A large number of studies have shown
that β-cell dysfunction, oxidative stress and excessive fatty acids
form the pathological basis of diabetes (13). However, it is non-negligible that
T2DM also has significant genetic heterogeneity and now a variety
of mutations have been identified in insulin genes, insulin
receptor genes, glucokinase genes and mitochondrial genes (14,15).
FTO-induced obesity and increased BMI values play
important roles in the initiation and progression of T2DM (16). However, people know very little about
the specific molecular mechanisms of how the FTO gene regulates BMI
and induces T2DM. In accordance with sequence homology analysis,
the predicted coding protein of FTO gene is
2-ketoglutarate-dependent demethylase (17), which affects the transcription of
various metabolism-related genes by influencing epigenetic
regulatory mechanisms such as nucleic acid demethylation. Guo et
al (18) found that the FTO gene
is enriched in the hepatocytes of patients with non-alcoholic fatty
liver and promotes hepatocyte oxidative stress and fat deposition.
Oxidative stress can activate a variety of intracellular signal
pathways directly leading to cell and tissue injury and thus
aggravating and complicating diabetes (19,20).
Some recent studies have indicated that FTO gene polymorphisms are
associated with energy intake and involved in the decomposition of
fat (21,22).
In the present study, we found that FTO protein was
highly expressed in patients with T2DM and was significantly higher
in those with severe T2DM. Correlation analysis showed that FTO
protein level was not correlated with age or gender, but was
significantly associated with waist circumference, hip
circumference, BMI and blood glucose indices (FPG, FCP, HbA1c,
FINs). After 12 weeks of treatment, blood glucose indice values and
FTO expression levels were both significantly decreased in patients
with severe T2DM. In conclusion, we have found that the expression
of the obesity gene FTO increases with T2DM severity. We hope that
the FTO gene can provide a reference value for the diagnosis and
treatment of T2DM in the future.
References
|
1
|
Dandona P, Aljada A and Bandyopadhyay A:
Inflammation: The link between insulin resistance, obesity and
diabetes. Trends Immunol. 25:4–7. 2004. View Article : Google Scholar : PubMed/NCBI
|
|
2
|
Sheehan MT: Current therapeutic options in
type 2 diabetes mellitus: A practical approach. Clin Med Res.
1:189–200. 2003. View Article : Google Scholar : PubMed/NCBI
|
|
3
|
Ballantyne GH, Gumbs A and Modlin IM:
Changes in insulin resistance following bariatric surgery and the
adipoinsular axis: Role of the adipocytokines, leptin, adiponectin
and resistin. Obes Surg. 15:692–699. 2005. View Article : Google Scholar : PubMed/NCBI
|
|
4
|
Imamura M and Maeda S: Genetics of type 2
diabetes: The GWAS era and future perspectives (Review). Endocr J.
58:723–739. 2011. View Article : Google Scholar : PubMed/NCBI
|
|
5
|
Loos RJ and Yeo GS: The bigger picture of
FTO: The first GWAS-identified obesity gene. Nat Rev Endocrinol.
10:51–61. 2014. View Article : Google Scholar : PubMed/NCBI
|
|
6
|
Claussnitzer M, Dankel SN, Kim KH, Quon G,
Meuleman W, Haugen C, Glunk V, Sousa IS, Beaudry JL, Puviindran V,
et al: FTO obesity variant circuitry and adipocyte browning in
humans. N Engl J Med. 373:895–907. 2015. View Article : Google Scholar : PubMed/NCBI
|
|
7
|
Hinney A, Nguyen TT, Scherag A, Friedel S,
Brönner G, Müller TD, Grallert H, Illig T, Wichmann HE, Rief W, et
al: Genome wide association (GWA) study for early onset extreme
obesity supports the role of fat mass and obesity associated gene
(FTO) variants. PLoS One. 2:e13612007. View Article : Google Scholar : PubMed/NCBI
|
|
8
|
Wang J, Mei H, Chen W, Jiang Y, Sun W, Li
F, Fu Q and Jiang F: Study of eight GWAS-identified common variants
for association with obesity-related indices in Chinese children at
puberty. Int J Obes. 36:542–547. 2012. View Article : Google Scholar
|
|
9
|
Abarin T, Yan Wu Y, Warrington N, Lye S,
Pennell C and Briollais L: The impact of breastfeeding on
FTO-related BMI growth trajectories: An application to the Raine
pregnancy cohort study. Int J Epidemiol. 41:1650–1660. 2012.
View Article : Google Scholar : PubMed/NCBI
|
|
10
|
Kunji ER, Aleksandrova A, King MS, Majd H,
Ashton VL, Cerson E, Springett R, Kibalchenko M, Tavoulari S,
Crichton PG, et al: The transport mechanism of the mitochondrial
ADP/ATP carrier. Biochim Biophys Acta. 1863:2379–2393. 2016.
View Article : Google Scholar : PubMed/NCBI
|
|
11
|
Rydén L, Standl E, Bartnik M, Van den
Berghe G, Betteridge J, de Boer MJ, Cosentino F, Jönsson B, Laakso
M, Malmberg K, et al Task Force on Diabetes and Cardiovascular
Diseases of the European Society of Cardiology (ESC), ; European
Association for the Study of Diabetes (EASD), : Guidelines on
diabetes, pre-diabetes, and cardiovascular diseases: Executive
summary. Eur Heart J. 28:88–136. 2007.PubMed/NCBI
|
|
12
|
Ribola FA, Cançado FB, Schoueri JH, De
Toni VF, Medeiros VH and Feder D: Effects of SGLT2 inhibitors on
weight loss in patients with type 2 diabetes mellitus. Eur Rev Med
Pharmacol Sci. 21:199–211. 2017.PubMed/NCBI
|
|
13
|
Szulinska M, Gibas-Dorna M,
Miller-Kasprzak E, Suliburska J, Miczke A, Walczak-Gałezewska M,
Stelmach-Mardas M, Walkowiak J and Bogdanski P: Spirulina maxima
improves insulin sensitivity, lipid profile, and total antioxidant
status in obese patients with well-treated hypertension: A
randomized double-blind placebo-controlled study. Eur Rev Med
Pharmacol Sci. 21:2473–2481. 2017.PubMed/NCBI
|
|
14
|
Miyazaki Y, Mahankali A and Matsuda M:
Effect of pioglitazone on abdominal fat distribution and insulin
sensitivity in patients with type 2 diabetes mellitus (T2DM).
Diabetes. 5:2992000.
|
|
15
|
Bhat A, Koul A, Rai E, Sharma S, Dhar MK
and Bamezai RN: PGC-1α Thr394Thr and Gly482Ser variants are
significantly associated with T2DM in two North Indian populations:
A replicate case-control study. Hum Genet. 121:609–614. 2007.
View Article : Google Scholar : PubMed/NCBI
|
|
16
|
Freathy RM, Timpson NJ, Lawlor DA, Pouta
A, Ben-Shlomo Y, Ruokonen A, Ebrahim S, Shields B, Zeggini E,
Weedon MN, et al: Common variation in the FTO gene alters
diabetes-related metabolic traits to the extent expected given its
effect on BMI. Diabetes. 57:1419–1426. 2008. View Article : Google Scholar : PubMed/NCBI
|
|
17
|
Gerken T, Girard CA, Tung YC, Webby CJ,
Saudek V, Hewitson KS, Yeo GS, McDonough MA, Cunliffe S, McNeill
LA, et al: The obesity-associated FTO gene encodes a
2-oxoglutarate-dependent nucleic acid demethylase. Science.
318:1469–1472. 2007. View Article : Google Scholar : PubMed/NCBI
|
|
18
|
Guo J, Ren W, Li A, Ding Y, Guo W, Su D,
Hu C, Xu K, Chen H, Xu X, et al: Fat mass and obesity-associated
gene enhances oxidative stress and lipogenesis in nonalcoholic
fatty liver disease. Dig Dis Sci. 58:1004–1009. 2013. View Article : Google Scholar : PubMed/NCBI
|
|
19
|
Robertson RP, Harmon J, Tran PO, Tanaka Y
and Takahashi H: Glucose toxicity in β-cells: Type 2 diabetes, good
radicals gone bad, and the glutathione connection. Diabetes.
52:581–587. 2003. View Article : Google Scholar : PubMed/NCBI
|
|
20
|
Kajimoto Y and Kaneto H: Role of oxidative
stress in pancreatic β-cell dysfunction. Ann N Y Acad Sci.
1011:168–176. 2004. View Article : Google Scholar : PubMed/NCBI
|
|
21
|
Speakman JR, Rance KA and Johnstone AM:
Polymorphisms of the FTO gene are associated with variation in
energy intake, but not energy expenditure. Obesity (Silver Spring).
16:1961–1965. 2008. View Article : Google Scholar : PubMed/NCBI
|
|
22
|
Wåhlén K, Sjölin E and Hoffstedt J: The
common rs9939609 gene variant of the fat mass- and
obesity-associated gene FTO is related to fat cell lipolysis. J
Lipid Res. 49:607–611. 2008. View Article : Google Scholar : PubMed/NCBI
|