Introduction
Understanding heterogeneous genetic alterations in
tumors is recognized as a key factor in advancing cancer therapy
(1–3). Lung cancers are classified into two
subtypes, non-small cell lung carcinoma (NSCLC) and small cell lung
carcinoma (SCLC), which harbor exclusive specific mutations:
RB1 in SCLC and CDKN2A (p16INK4A)
in NSCLC (4). Both the RB1
and CDKN2A genes are tightly associated with cell cycle
regulation, and CDKN2A regulates RB1 phosphorylation through
cyclin E and D1 (5,6). The crucial role of RB1 as a regulator
in cell cycle progression has been intensively investigated
(7–9). Accumulated data have demonstrated
mutually exclusive mutation patterns for genes encoding proteins
that function in the same biological pathway. For instance,
mutations of the KRAS or BRAF gene, which are
downstream of the EGFR signaling pathway, have not been found in
EGFR-mutated NSCLC (10,11),
and co-mutations of the TP53 and PIK3CA pair
(12) or the RB1 and
CDKN2A pair (13) rarely
occur in the same tumors. However, the biological meaning of such
mutually exclusive mutation patterns is not fully understood, even
though this exclusiveness does serve as an attractive target for
the development of novel therapeutics (14).
An understanding of differential regulation along
with distinct mutations in RB1 and CDKN2A is required
to identify molecular characteristics of the progression of SCLC
and NSCLC subtypes. Large-scale cell line-based high-throughput
transcriptome and proteome datasets facilitate the understanding of
molecular characterization of cancers through genome-wide
functional analyses. The National Cancer Institute (NCI) released
well-annotated sets of both DNA microarray data to detect the gene
expression and reverse-phase protein array (RPPA) data to detect
the total protein and phosphorylation on 60 well-characterized
cancer cell lines (15). Diverse
omics datasets on an expanded panel of >300 cancer cell lines
were also generated by GlaxoSmithKline (GSK) (16). Together with these datasets, the
extensive mutation profile on individual cell lines is available
from the COSMIC (Catalogue of Somatic Mutations in Cancer) database
(17). Through mutation-oriented
association studies on cell line-based omics data, we have reported
new targets and mechanisms for cancer regulation (3,18,19).
In the present study, the regulation of gene and
protein levels driven by RB1 or CDKN2A mutations in
lung cancer was analyzed using transcriptome and proteome datasets
obtained from 318 diverse cancer cell lines. We attempted to
identify the differentially regulated gene/protein signatures and
functional pathways specific to RB1 and CDKN2A
mutations. Furthermore, we experimentally investigated whether
double or complementary knockdown of RB1 or CDKN2A
gene expression has a specific effect on the reciprocal mutant
subtype in lung cancer cell lines. We expect that this study will
provide a useful resource for the regulation of lung cancer
progression using synergistic mechanisms of exclusive RB1 or
CDKN2A mutations.
Materials and methods
Data acquisition
The large-scale transcriptome dataset on 318 cancer
cell lines was obtained from the Cancer Biomedical Informatics Grid
(caBIG) website (https://cabig.nci.nih.gov/caArray_GSKdata) (16). This dataset, also known as the
GlaxoSmithKline (GSK) dataset, has 950 arrays performed in
triplicate for each cell line with the Affymetrix U133 Plus 2.0
Array chip. It was normalized to MAS5 and then transformed to a
log2 scale.
The reverse-phase protein array (RPPA) dataset to
detect protein expression and phosphorylation was generated in the
Functional Proteomics Core of the M.D. Anderson Cancer Center using
a total of 179 cancer cell lines, which were included in the
transcriptome dataset. These cell lines were purchased from several
vendors (American Type Culture Collection; Developmental
Therapeutics Program, National Cancer Institute; German Resource
Centre for Biological Material and European Collection of Animal
Cell Cultures) and grown in standard culture media as recommended
by the vendor. The genetic identity of cell lines was determined by
cross comparing all cell lines in this set (16,20).
The cells were maintained in RPMI-1640 supplemented with 5% fetal
bovine serum at 37°C in a humidified 5% CO2 atmosphere.
Proteins were harvested when the cells reached ~70% confluence. The
cells were lysed in buffer containing 1% Triton X-100, 50 mM HEPES
pH 7.4, 150 mM NaCl, 1.5 mM MgCl2, 1 mM ethylene glycol
tetraacetic acid, 100 mM NaF, 10 mM NaPPi, 10% glycerol, 1 mM
Na3VO4 and complete protease inhibitor
cocktail (Roche Diagnostics). Protein supernatants were isolated
using standard methods (21), and
the protein concentration was determined using the bicinchoninic
acid assay (22). Samples were
diluted to a uniform protein concentration and denatured in 1%
sodium dodecyl sulfate for 10 min at 95°C. Samples were stored at
−80°C until use. RPPA analysis was performed as described
previously (21,23,24).
A logarithmic value reflecting the relative amount of each protein
in each sample was generated for subsequent analyses. The RPPA
analysis was performed using a total of 115 antibodies.
The annotation of somatic mutation on all cell lines
was organized by the COSMIIC (Catalogue of Somatic Mutations in
Cancer) database (http://cancer.sanger.ac.uk/cosmic) (17).
Enrichment analysis of somatic
mutations
To describe the selectivity of mutation occurrence,
we calculated enrichment scores using an odds ratio between the
observed odds and expected odds. The observed odds score is the
ratio for the number of mutated cell lines in a specific cancer
type via the number of cell lines in a specific cancer type. The
expected odds score is the ratio for the number of mutated cell
lines vs. the total number of cell lines. In addition, the
probability of an odds ratio was calculated by the Fisher exact
test using the R open-source computing language, version 2.15. The
Fisher exact test uses a hypergeometric distribution to determine
the significance of the agreement between individual question pairs
(25).
Mutation-specific gene and protein
expression analysis
For the selection of RB1 and CDKN2A
mutation-specific gene and protein expression markers together with
excluding the subtype-dependent expressions, lung cancer cell lines
were classified into two groups: NSCLC and SCLC. Then, we divided
the cell lines of each subtype into two groups based on the
mutational status of RB1 and CDKN2A.
CDKN2A-mutant and wild-type cell lines were mainly
considered in the NSCLC type. RB1-mutant and wild-type cell
lines were considered in the SCLC type. As a result, in the
transcriptome dataset, we classified 9, 16, 22 and 24 cell line
samples into the following four groups, respectively: RB1wt
SCLC; RB1mt SCLC; CDKN2Awt NSCLC; and CDKN2Amt
NSCLC. In the RPPA dataset, we classified 4, 7, 4 and 16 cell line
samples into four groups, respectively: RB1wt SCLC;
RB1mt SCLC; CDKN2Awt NSCLC; and CDKN2Amt
NSCLC. The gene expression was detected using a log2
fold change value for the average difference of mutant and
wild-type cell lines. The significance was confirmed by a
t-test.
The patterns of gene expression were analyzed
through a hierarchical clustering method. The clustering and its
visualization on a heatmap were performed using the software
QCanvas (26). QCanvas can be
downloaded freely from the website http://compbio.sookmyung.ac.kr/~qcanvas.
Gene set enrichment analysis
Pathway analysis was performed using the GSEA (Gene
Set Enrichment Analysis) method (27). Gene sets, integrated from Reactome,
PID, KEGG, and Biocarta database, were obtained from the online
pathway database, MSigDB v3.1 (http://www.broadinstitute.org/gsea/msigdb). The
significantly (p<0.01) enriched gene sets among the results of
the GSEA were reorganized based on major functional categories in
each database.
Cell culture
NCI-60 lung cancer cell lines (NCI-H460, A549,
NCI-H322M, NCI-H226, EKVX, and NCI-H23) were obtained from National
Cancer Institute (NCI DTP), USA. NCI-H1993, NCI-H1935, NCI-H82 and
NCI-H524 were obtained from American Type Culture Collection
(ATCC). All cells were grown in RPMI-1640 medium (HyClone, USA)
with 10% FBS (HyClone) and 1% penicillin/streptomycin (Gibco, USA),
and maintained at 37°C in a humidified atmosphere at 5%
CO2
siRNA transfection and cell viability
assay
To detect cell viability after siRNA transfection,
the cells were seeded in a 96-well plate at a density of 5,000
cells per well. After adhering for 24 h, target siRNAs were added
in transfection medium (Gibco) for 6 h at 37°C in a CO2
incubator. siRB1 (L-003296-02), siCDKN2A (L-011007-00) and
non-targeting siRNA (D-001810-10) were purchased from Dharmacon
Inc. (Lafayette, CO, USA). After being cultured for 72 h at 37°C,
5% CO2, cell viability was detected using a
CellTiter-Blue Cell Viability Assay (Promega, Madison, WI,
USA).
Results and Discussion
RB1 and CDKN2A mutations in SCLC and
NSCLC cell lines
Genetic alterations affecting the same biological
pathway are generally not found in the same cancer cell.
Accordingly, exclusive mutation patterns of RB1 and
CDKN2A genes have been observed in the lung cancer subtypes
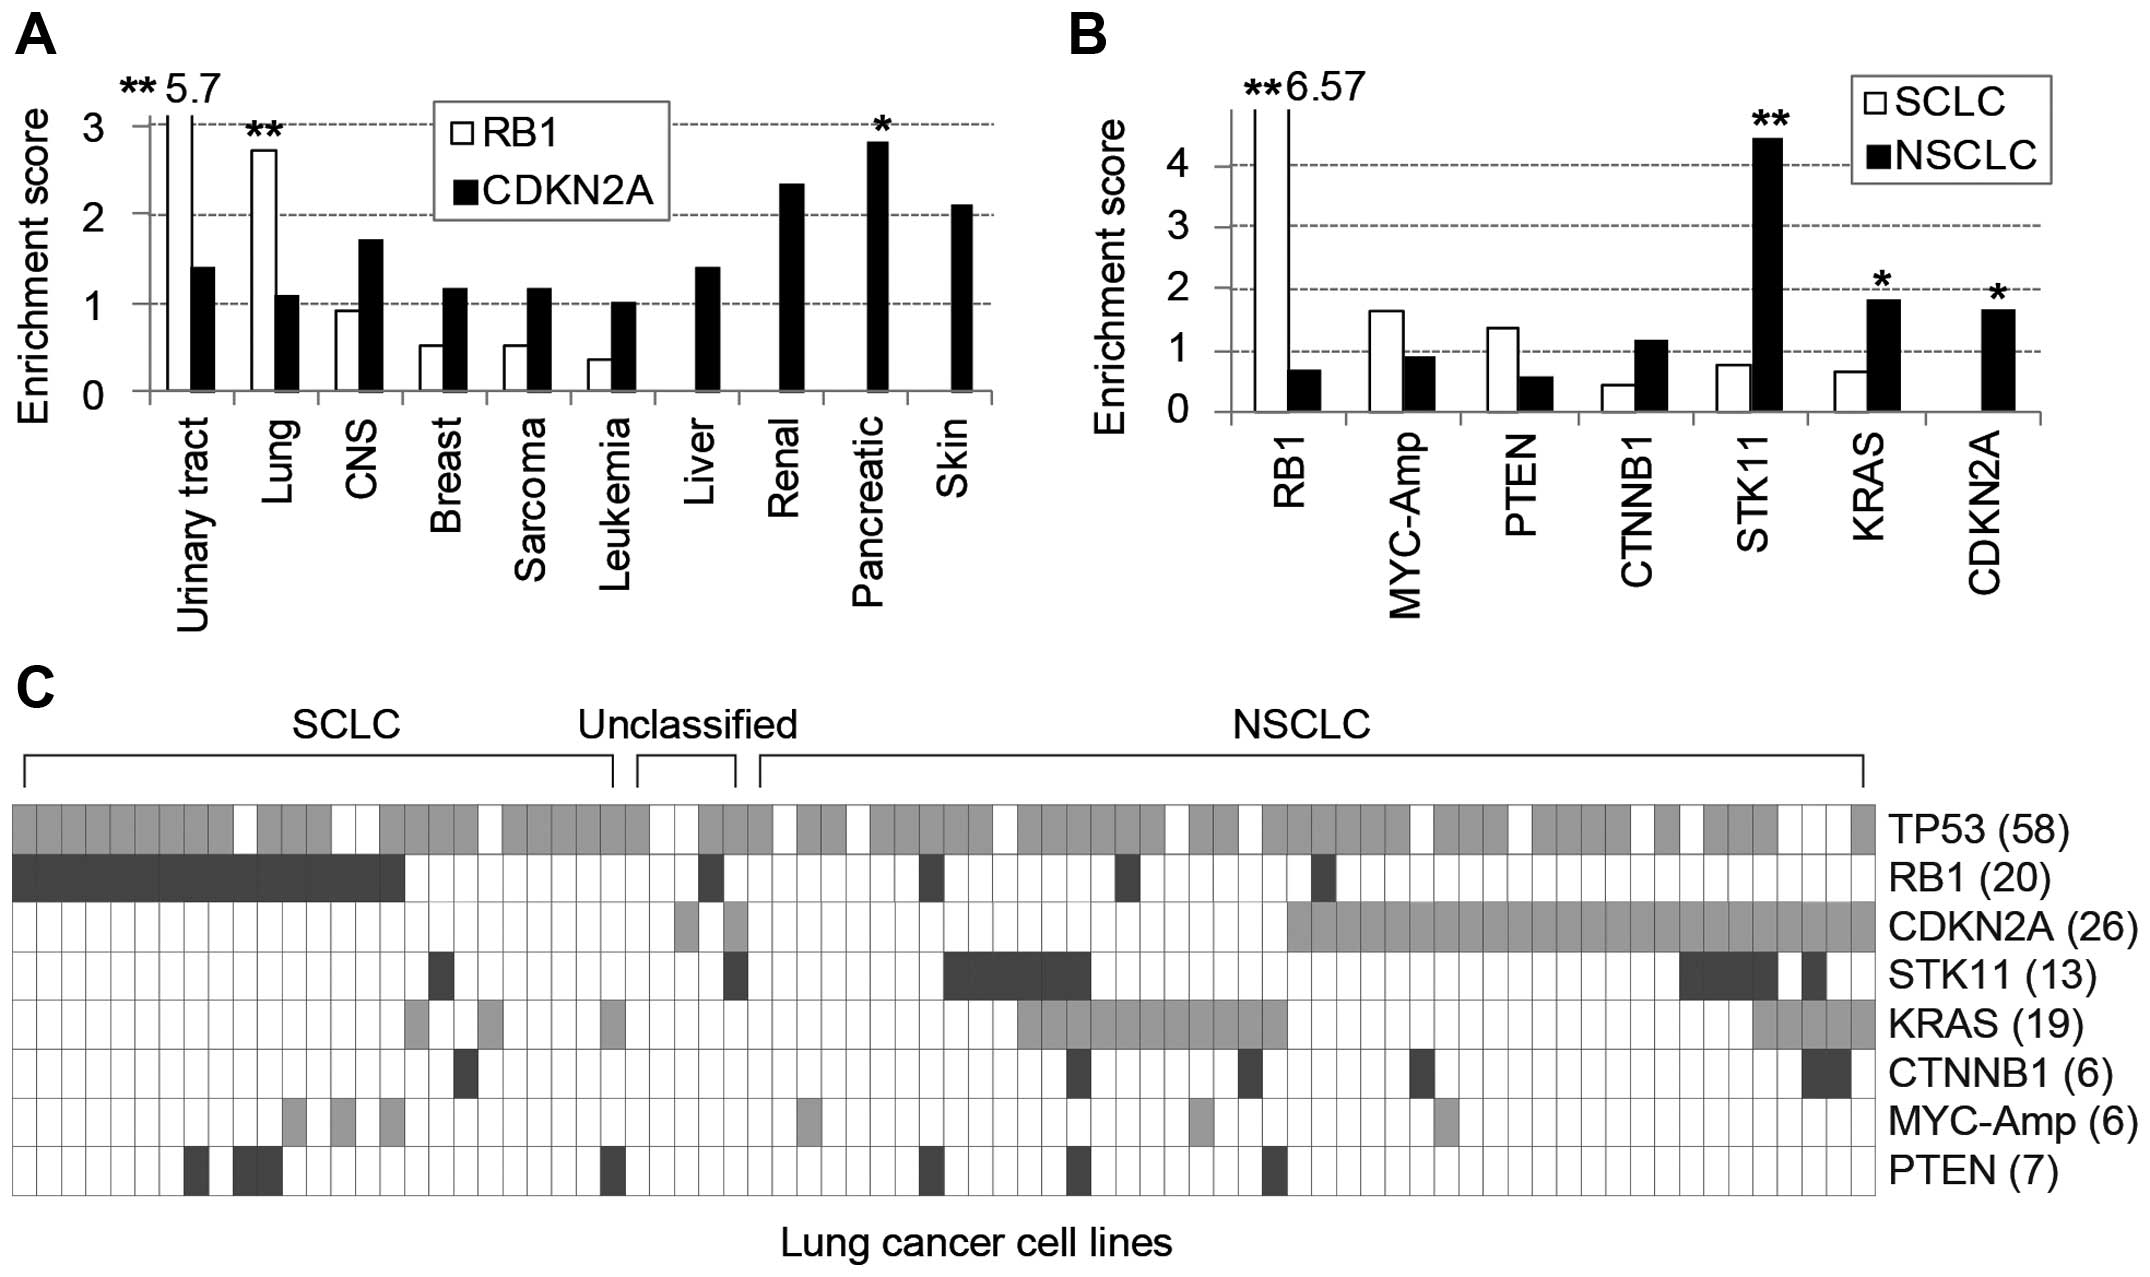
SCLC and NSCLC (4,13). Based on the analysis of mutation
frequencies across 318 cell lines, we found the general
exclusiveness of RB1 and CDKN2A mutations in diverse
cancer lineages (Fig. 1A).
RB1 mutations were significantly enriched in urinary tract
and lung cancer cell lines yet rarely found in liver, renal,
pancreatic and skin cancers, in which CDKN2A mutations were
frequent. Furthermore, among 71 lung cancer cell lines, 25
SCLC-derived cells were significantly enriched with RB1
mutations, whereas 46 NSCLCs predominantly contained STK11,
KRAS and CDKN2A mutations (Fig. 1B). Taken together, the mutations of
RB1 and CDKN2A genes, which belong to a common
functional pathway, were clearly exclusive from each other among
frequently mutated genes in diverse cancer cell lines (Fig. 1C).
Differential gene expression profiles
between RB1mt SCLCs and CDKN2Amt NSCLCs
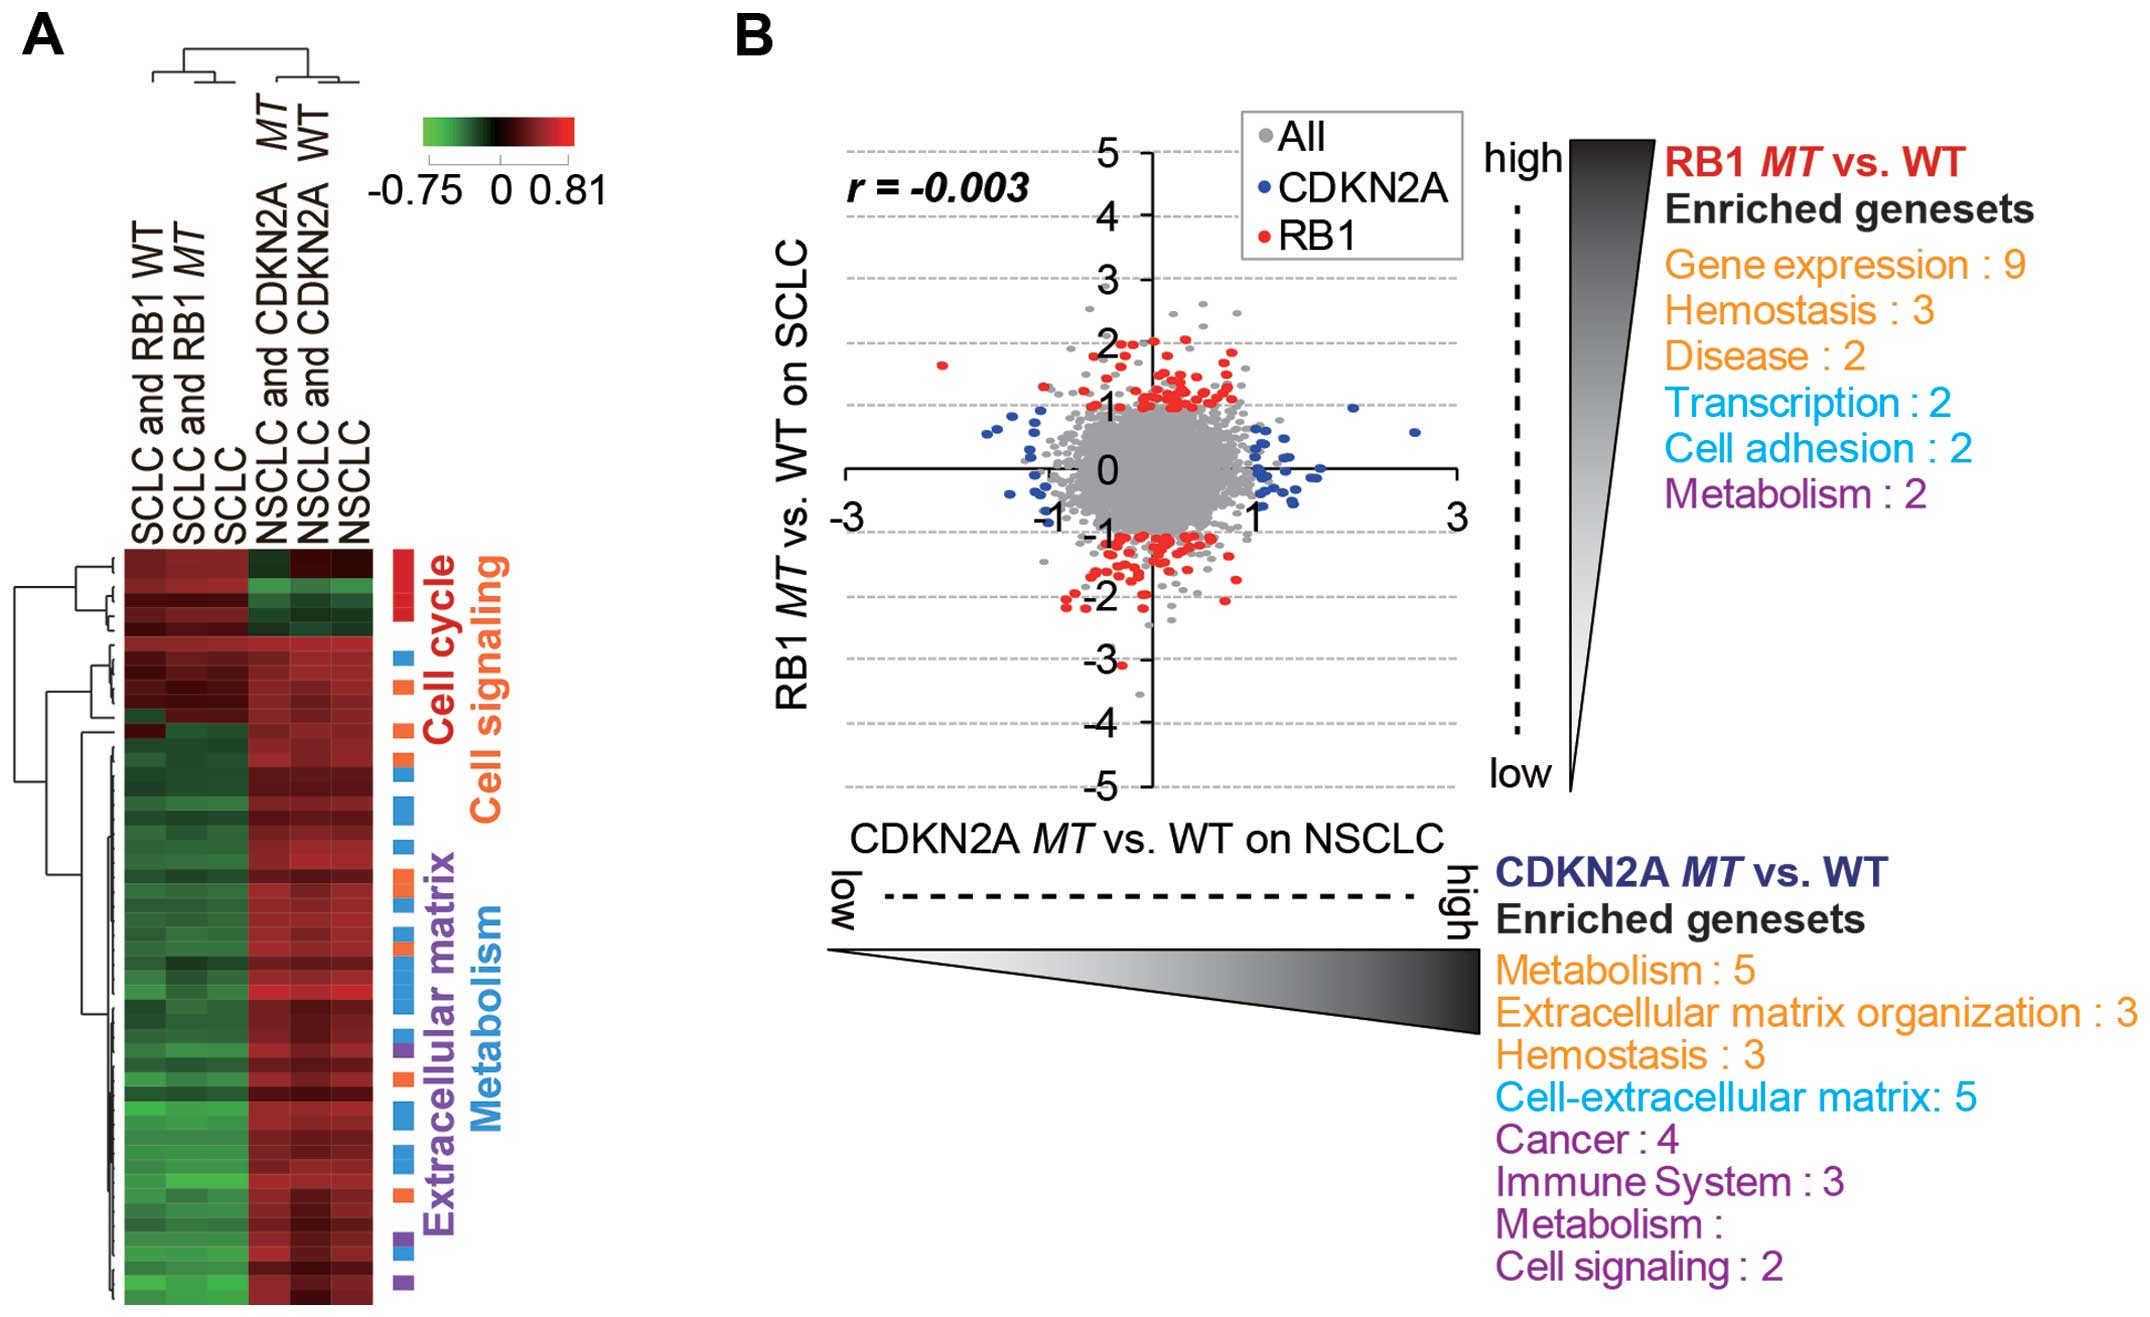
To find lineage-independent, mutation-specific gene
expression patterns, we classified 9, 16, 22 and 24 cell line
samples into four groups, RB1wt SCLC, RB1mt SCLC,
CDKN2Awt NSCLC and CDKN2Amt NSCLC, and analyzed the
group-specific gene expression patterns using DNA microarray data.
There was no general correlation of gene expression between the
SCLC and NSCLC cell lines (Fig.
2A), and significantly enriched gene sets were also different
between the lung subtypes. However, RB1mt SCLC and
CDKN2Amt NSCLC cells showed a negative correlation in gene
expression (Fig. 2B), whereas
RB1wt SCLC and CDKN2Awt NSCLC exhibited a positive
correlation (Fig. 2C). This
observation indicated that RB1 and CDKN2A mutations
caused lineage-specific distinctive changes in gene expression.
Our analysis showed that the lineage difference was
generally more important than RB1 and CDKN2A
mutational status in the differential gene expression pattern
(Fig. 3A). Thus, we attempted to
identify RB1mt- and CDKN2Amt-specific gene signatures
by separately analyzing SCLC and NSCLC cells (Fig. 3B). As a result, we were able to
identify distinct mutation-specific gene signatures for which
expression was significantly regulated (>2-fold change and
p<0.05) in each subtype (Tables
I and II). Of note, the
significantly over-enriched (p<0.01) gene sets (functional
categories of selected gene signatures) generally did not overlap
between the two mutation groups (Fig.
3B). The upregulated gene sets with RB1 mutation in SCLC
cell lines mainly belonged to functional categories of
transcription. The hit list included known target genes of E2F,
which are released and activated upon RB1 inactivation
(28). The upregulated genes upon
CDKN2A mutation in NSCLC cell lines were largely enriched in
the gene sets of extracellular matrix and metabolism. Genes related
to the extracellular matrix are known to be important factors for
enhancing tumorigenicity and promoting metastasis (29). Although CDKN2A and RB1 are known to
function in the same pathway of cell cycle regulation, inactivation
of the mutations might have a different functional role in cancer
development or progression in SCLC and NSCLC subtypes.
 | Table IThe RB1mt-specific gene
signatures in SCLC. |
Table I
The RB1mt-specific gene
signatures in SCLC.
| Upregulated genes
specific to RB1mt | Downregulated genes
specific to RB1mt |
|---|
|
|
|---|
| ProbeID | Symbol | log2
fold change | p-value | ProbeID | Symbol | log2
fold change | p-value |
|---|
| 231736_x_at | MGST1 | 2.083 | 0.001 | 202834_at | AGT | −3.059 | 0 |
| 218847_at | IGF2BP2 | 2.058 | 0.011 | 1566764_at | MACC1 | −2.16 | 0.035 |
| 202620_s_at | PLOD2 | 2.01 | 0.002 | 205501_at | PDE10A | −2.159 | 0.004 |
| 213139_at | SNAI2 | 2.002 | 0.016 | 204044_at | QPRT | −2.149 | 0.004 |
| 206332_s_at | IFI16 | 1.879 | 0.03 | 239503_at | Unknown | −2.041 | 0 |
| 235763_at | SLC44A5 | 1.829 | 0.009 | 208891_at | DUSP6 | −2.019 | 0.006 |
| 204646_at | DPYD | 1.828 | 0.005 | 1560652_at | Unknown | −1.943 | 0.019 |
| 202016_at | MEST | 1.817 | 0.003 | 203881_s_at | DMD | −1.937 | 0.006 |
| 226225_at | MCC | 1.717 | 0.045 | 208892_s_at | DUSP6 | −1.921 | 0.005 |
| 217028_at | CXCR4 | 1.675 | 0.023 | 206218_at | MAGEB2 | −1.732 | 0.013 |
| 214597_at | SSTR2 | 1.655 | 0.038 | 203132_at | RB1 | −1.709 | 0.006 |
| 210839_s_at | ENPP2 | 1.557 | 0.04 | 205305_at | FGL1 | −1.67 | 0.006 |
| 203038_at | PTPRK | 1.531 | 0.001 | 201328_at | ETS2 | −1.663 | 0.005 |
| 222553_x_at | OXR1 | 1.528 | 0.003 | 205110_s_at | FGF13 | −1.651 | 0.036 |
| 1558217_at | SLFN13 | 1.515 | 0.045 | 209365_s_at | ECM1 | −1.61 | 0.014 |
| 1565162_s_at | MGST1 | 1.493 | 0.016 | 210102_at | VWA5A | −1.597 | 0.005 |
| 204620_s_at | VCAN | 1.47 | 0.011 | 209468_at | LRP5 | −1.583 | 0.001 |
| 221731_x_at | VCAN | 1.44 | 0.018 | 1558882_at | LOC401233 | −1.574 | 0.032 |
| 218197_s_at | OXR1 | 1.409 | 0.006 | 219750_at | TMEM144 | −1.572 | 0.034 |
| 205229_s_at | COCH | 1.338 | 0.006 | 223748_at | SLC4A11 | −1.552 | 0.002 |
| 203184_at | FBN2 | 1.338 | 0.026 | 205601_s_at | HOXB5 | −1.511 | 0.023 |
| 205027_s_at | MAP3K8 | 1.311 | 0.004 | 209803_s_at | PHLDA2 | −1.495 | 0.038 |
| 204030_s_at | SCHIP1 | 1.308 | 0.038 | 212268_at | SERPINB1 | −1.467 | 0.001 |
| 241400_at | Unknown | 1.296 | 0.006 | 1569191_at | ZNF826 | −1.448 | 0.022 |
| 1555788_a_at | TRIB3 | 1.274 | 0.034 | 212188_at | KCTD12 | −1.43 | 0.002 |
| 211675_s_at | MDFIC | 1.272 | 0.012 | 241672_at | C13orf36 | −1.414 | 0.033 |
| 229465_s_at | PTPRS | 1.255 | 0.008 | 219305_x_at | FBXO2 | −1.337 | 0.015 |
| 225093_at | UTRN | 1.255 | 0.042 | 1554472_a_at | PHF20L1 | −1.317 | 0 |
| 205122_at | TMEFF1 | 1.251 | 0.01 | 203028_s_at | CYBA | −1.308 | 0.047 |
| 219489_s_at | NXN | 1.238 | 0.035 | 228726_at | Unknown | −1.303 | 0.01 |
| 225056_at | SIPA1L2 | 1.237 | 0.011 | 204158_s_at | TCIRG1 | −1.302 | 0.006 |
| 208949_s_at | LGALS3 | 1.235 | 0.021 | 211538_s_at | HSPA2 | −1.279 | 0.035 |
| 201063_at | RCN1 | 1.229 | 0.033 | 220082_at | PPP1R14D | −1.259 | 0.008 |
| 235244_at | CCDC58 | 1.184 | 0.032 | 203005_at | LTBR | −1.257 | 0.011 |
| 210978_s_at | TAGLN2 | 1.184 | 0.005 | 229964_at | C9orf152 | −1.23 | 0.036 |
| 233903_s_at | SGEF | 1.182 | 0.003 | 203961_at | NEBL | −1.212 | 0.032 |
| 205123_s_at | TMEFF1 | 1.177 | 0.019 | 224577_at | ERGIC1 | −1.206 | 0.002 |
| 200897_s_at | PALLD | 1.164 | 0.018 | 238021_s_at | CRNDE | −1.189 | 0.022 |
| 200916_at | TAGLN2 | 1.161 | 0.015 | 223041_at | CD99L2 | −1.182 | 0.001 |
| 215127_s_at | RBMS1 | 1.143 | 0.03 | 205586_x_at | VGF | −1.182 | 0.008 |
| 202887_s_at | DDIT4 | 1.141 | 0.005 | 239278_at | Unknown | −1.163 | 0.013 |
| 212636_at | QKI | 1.137 | 0.014 | 213689_x_at | FAM69A | −1.157 | 0.005 |
| 214877_at | CDKAL1 | 1.134 | 0.03 | 232099_at | PCDHB16 | −1.153 | 0.028 |
| 227197_at | SGEF | 1.129 | 0.005 | 219256_s_at | SH3TC1 | −1.153 | 0.005 |
| 224918_x_at | MGST1 | 1.12 | 0.02 | 227943_at | Unknown | −1.141 | 0.004 |
| 227522_at | CMBL | 1.08 | 0.007 | 210538_s_at | BIRC3 | −1.138 | 0.024 |
| 206385_s_at | ANK3 | 1.073 | 0.042 | 1568838_at | LOC100132169 | −1.117 | 0.032 |
| 226464_at | C3orf58 | 1.072 | 0.01 | 229872_s_at | LOC100132999 | −1.099 | 0.021 |
| 1568720_at | ZNF506 | 1.054 | 0.04 | 1555579_s_at | PTPRM | −1.09 | 0.043 |
| 201656_at | ITGA6 | 1.04 | 0.028 | 224997_x_at | H19 | −1.082 | 0.032 |
| 212190_at | SERPINE2 | 1.034 | 0.037 | 213005_s_at | KANK1 | −1.081 | 0.01 |
| 204995_at | CDK5R1 | 1.022 | 0.017 | 219371_s_at | KLF2 | −1.076 | 0.013 |
| 210512_s_at | VEGFA | 1.02 | 0.037 | 37408_at | MRC2 | −1.074 | 0.01 |
| 226419_s_at | FLJ44342 | 1.015 | 0.001 | 224391_s_at | SIAE | −1.059 | 0.01 |
| 210735_s_at | CA12 | 1.011 | 0.032 | 201329_s_at | ETS2 | −1.053 | 0.022 |
| 65588_at | LOC388796 | 1.002 | 0.009 | 205016_at | TGFA | −1.049 | 0.007 |
| 213857_s_at | CD47 | 1.001 | 0.002 | 227384_s_at | LOC727820 | −1.043 | 0.002 |
| 208622_s_at | EZR | 1.001 | 0.001 | 228010_at | PPP2R2C | −1.033 | 0.031 |
| | | | 209500_x_at |
TNFSF12/TNFSF13 | −1.031 | 0.019 |
| | | | 224576_at | ERGIC1 | −1.031 | 0.007 |
| | | | 236719_at | Unknown | −1.025 | 0.004 |
| | | | 227001_at | NIPAL2 | −1.021 | 0.006 |
| | | | 230722_at | BNC2 | −1.019 | 0.047 |
| | | | 204682_at | LTBP2 | −1.007 | 0.024 |
| Table IIThe CDKN2Amt-specific gene
signatures in NSCLC. |
Table II
The CDKN2Amt-specific gene
signatures in NSCLC.
| Upregulated genes
specific to CDKN2Amt | Downregulated genes
specific to CDKN2Amt |
|---|
|
|
|---|
| ProbeID | Symbol | log2
fold change | p-value | ProbeID | Symbol | log2
fold change | p-value |
|---|
| 236694_at | CYorf15A | 2.585 | 0.001 | 228956_at | UGT8 | −1.618 | 0.001 |
| 211980_at | COL4A1 | 1.978 | 0.006 | 209644_x_at | CDKN2A | −1.52 | 0.004 |
| 213725_x_at | XYLT1 | 1.654 | 0.023 | 225681_at | CTHRC1 | −1.396 | 0.014 |
| 204971_at | CSTA | 1.615 | 0.022 | 1554242_a_at | COCH | −1.373 | 0.008 |
| 209970_x_at | CASP1 | 1.566 | 0.001 | 218820_at | C14orf132 | −1.199 | 0.012 |
| 225688_s_at | PHLDB2 | 1.412 | 0.017 | 200884_at | CKB | −1.191 | 0.001 |
| 202638_s_at | ICAM1 | 1.388 | 0.011 | 227623_at | Unknown | −1.156 | 0.018 |
| 222453_at | CYBRD1 | 1.377 | 0.016 | 207558_s_at | PITX2 | −1.151 | 0.014 |
| 1562102_at | AKR1C1 | 1.344 | 0.048 | 236302_at | PPM1E | −1.151 | 0.009 |
| 208782_at | FSTL1 | 1.312 | 0.014 | 209198_s_at | SYT11 | −1.145 | 0.007 |
| 211340_s_at | MCAM | 1.299 | 0.002 | 1560023_x_at | Unknown | −1.097 | 0.01 |
| 210004_at | OLR1 | 1.299 | 0.01 | 214321_at | NOV | −1.094 | 0.035 |
| 202008_s_at | NID1 | 1.286 | 0.004 | 205229_s_at | COCH | −1.061 | 0.031 |
| 202350_s_at | MATN2 | 1.197 | 0.012 | 223551_at | PKIB | −1.045 | 0.046 |
| 239999_at | Unknown | 1.126 | 0.033 | 230130_at | Unknown | −1.04 | 0.049 |
| 205407_at | RECK | 1.117 | 0.014 | 212706_at |
LOC100286937/LOC100287164/RASA4 | −1.019 | 0.003 |
| 203304_at | BAMBI | 1.113 | 0.012 | | | | |
| 228698_at | SOX7 | 1.104 | 0.014 | | | | |
| 227051_at | Unknown | 1.088 | 0.036 | | | | |
| 201939_at | PLK2 | 1.082 | 0.017 | | | | |
| 209087_x_at | MCAM | 1.081 | 0.007 | | | | |
| 206165_s_at | CLCA2 | 1.067 | 0.025 | | | | |
| 227178_at | CUGBP2 | 1.067 | 0.012 | | | | |
| 227253_at | CP | 1.044 | 0.015 | | | | |
| 212262_at | QKI | 1.043 | 0.002 | | | | |
| 202998_s_at | LOXL2 | 1.039 | 0.006 | | | | |
| 214022_s_at | IFITM1 | 1.021 | 0.034 | | | | |
| 211366_x_at | CASP1 | 1.019 | 0.001 | | | | |
| 222446_s_at | BACE2 | 1.014 | 0.009 | | | | |
Specific change in total proteins and
phosphoproteins in RB1 and CDKN2A mutations
We characterized the differential regulation of
RB1 and CDKN2A mutations at the protein level using
RPPA data of 77 pan- and 38 phospho-antibodies for 89 proteins
across 179 cancer cell lines. Consistent with the patterns of gene
expression data, the overall protein expression and phosphorylation
status were inversely correlated between RB1mt SCLC and
CDKN2Amt NSCLC cell lines (Fig.
4). Thus, the mutational effect of RB1 and CDKN2A
genes were separately analyzed in SCLC and NSCLC cell lines
(Fig. 5). The results showed that
β-catenin was commonly over expressed in both RB1 and
CDKN2A mutants. Wnt/β-catenin overexpression has been
extensively reported in lung cancer (30), and the overexpression of β-catenin
might be maintained by the mutational effect of both RB1 and
CDKN2A genes. The RB1 mutation specifically regulated
PTEN, STAT, mTOR, p53 expression and MAPK phosphorylation in SCLC
cells. However, the CDKN2A mutation altered the expression
of JNK2 and cKIT and the phosphorylation status of AKT, STAT3 and
AMPKa.
MAPK (T202), which is significantly (p<0.05)
phosphorylated in RB1-mutated SCLC cancer cell lines, has an
important role in transcriptional regulation of targeting
transcription factors such as c-Jun, c-Fos, and c-Myc (31). This observation is consistent with
the DNA microarray data (Fig. 3B)
for RB1mt SCLC cells, which are enriched in the functional
categories of transcription. AKT is specifically phosphorylated
(S473, T308) in CDKN2Amt NSCLC and related to focal adhesion
(32), which is the enriched gene
set of CDKN2Amt NSCLC from DNA microarray analysis.
Furthermore, PTEN, which was overexpressed in RB1mt SCLC
cells (Fig. 5A), is a well-known
negative regulator of AKT activation (33), suggesting that AKT-mediated
signaling might be exclusively activated by CDKN2Amt in
NSCLC, not by RB1mt in SCLC. Both proteome and transcriptome
data analyses demonstrated that exclusive RB1 and
CDKN2A mutations in different subtypes of lung cancer
included a differential change of gene expression and protein
regulation, even though RB1 and CDKN2A are in the
same cell cycle-related pathway.
Synthetic lethality of reciprocal
regulation of RB1 and CDKN2A expression
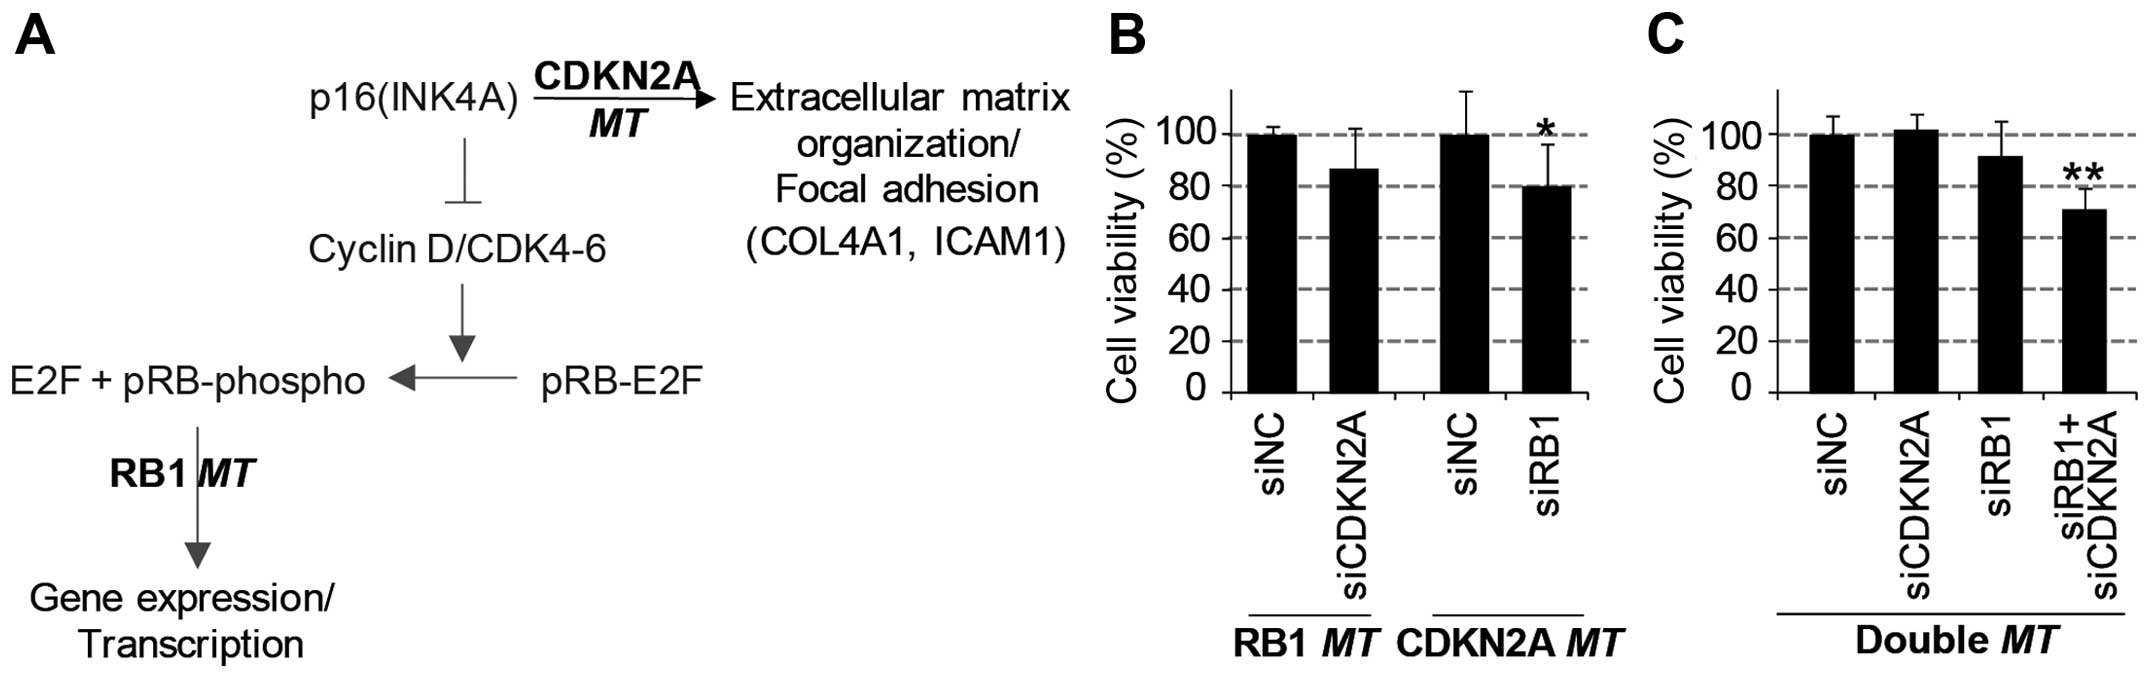
Through the systematic analysis of transcriptome and
proteome data, we found unique mRNA and protein regulation patterns
induced by the mutation of either the RB1 gene or the
CDKN2A gene (Fig. 6A).
Furthermore, we investigated the synergistic negative effect on
cancer growth by simultaneous functional loss (or knockdown) of
these two genes. We performed a viability assay with diverse lung
cancer cell lines with the combined knockdown of RB1 and
CDKN2A genes using siRNA-mediated gene depletion. As a
result, the knockdown of one of these genes decreased the viability
of cells harboring a mutation of the other gene (Fig. 6B). The viability of
CDKN2A-mutant cell lines was significantly decreased by
knockdown of RB1; similarly, RB1-mutant cell lines
were inhibited by CDKN2A depletion. Consistently, the
simultaneous depletion of RB1 and CDKN2A genes
significantly decreased the viability of lung cell lines harboring
wild-types of these genes (Fig.
6C). However, the single knockdown of either the RB1
gene or the CDKN2A gene did not effectively reduce viability
in these wild-type cell lines. In conclusion, the functional
inhibition of the RB1 or CDKN2A gene in
CDKN2Amt or RB1mt cancer cells, respectively, might
be a promising therapeutic approach in SCLC or NSCLC lung cancers.
The present study on differential proteome and transcriptome
profiles between two mutant groups provides mechanistic insights
into the synthetic lethality of RB1 and CDKN2A mutations.
Acknowledgements
This study was supported by Sookmyung Women's
University Research Grant 1-1303-0160.
References
|
1
|
Kim N, He N, Kim C, Zhang F, Lu Y, Yu Q,
Stemke-Hale K, Greshock J, Wooster R, Yoon S, et al: Systematic
analysis of genotype-specific drug responses in cancer. Int J
Cancer. 131:2456–2464. 2012. View Article : Google Scholar : PubMed/NCBI
|
|
2
|
Settleman J: Cell culture modeling of
genotype-directed sensitivity to selective kinase inhibitors:
Targeting the anaplastic lymphoma kinase (ALK). Semin Oncol.
36(Suppl 1): S36–S41. 2009. View Article : Google Scholar : PubMed/NCBI
|
|
3
|
He N, Kim N, Song M, Park C, Kim S, Park
EY, Yim HY, Kim K, Park JH, Kim KI, et al: Integrated analysis of
transcriptomes of cancer cell lines and patient samples reveals
STK11/LKB1-driven regulation of cAMP phosphodiesterase-4D. Mol
Cancer Ther. 13:2463–2473. 2014. View Article : Google Scholar : PubMed/NCBI
|
|
4
|
Knudsen ES and Knudsen KE: Tailoring to
RB: Tumour suppressor status and therapeutic response. Nat Rev
Cancer. 8:714–724. 2008. View
Article : Google Scholar
|
|
5
|
Xie Z and Liu D: Pathogenesis of molecular
signaling pathways changes in smoking-induced lung cancer. Zhongguo
Fei Ai Za Zhi. 12:1202–1205. 2009.in Chinese.
|
|
6
|
Serrano M, Hannon GJ and Beach D: A new
regulatory motif in cell-cycle control causing specific inhibition
of cyclin D/CDK4. Nature. 366:704–707. 1993. View Article : Google Scholar : PubMed/NCBI
|
|
7
|
Hernando E, Nahlé Z, Juan G,
Diaz-Rodriguez E, Alaminos M, Hemann M, Michel L, Mittal V, Gerald
W, Benezra R, et al: Rb inactivation promotes genomic instability
by uncoupling cell cycle progression from mitotic control. Nature.
430:797–802. 2004. View Article : Google Scholar : PubMed/NCBI
|
|
8
|
Dyson N: The regulation of E2F by
pRB-family proteins. Genes Dev. 12:2245–2262. 1998. View Article : Google Scholar : PubMed/NCBI
|
|
9
|
Classon M and Harlow E: The retinoblastoma
tumour suppressor in development and cancer. Nat Rev Cancer.
2:910–917. 2002. View
Article : Google Scholar : PubMed/NCBI
|
|
10
|
Kosaka T, Yatabe Y, Endoh H, Kuwano H,
Takahashi T and Mitsudomi T: Mutations of the epidermal growth
factor receptor gene in lung cancer: Biological and clinical
implications. Cancer Res. 64:8919–8923. 2004. View Article : Google Scholar : PubMed/NCBI
|
|
11
|
Shigematsu H, Lin L, Takahashi T, Nomura
M, Suzuki M, Wistuba II, Fong KM, Lee H, Toyooka S, Shimizu N, et
al: Clinical and biological features associated with epidermal
growth factor receptor gene mutations in lung cancers. J Natl
Cancer Inst. 97:339–346. 2005. View Article : Google Scholar : PubMed/NCBI
|
|
12
|
Singh B, Reddy PG, Goberdhan A, Walsh C,
Dao S, Ngai I, Chou TC, O-Charoenrat P, Levine AJ, Rao PH, et al:
p53 regulates cell survival by inhibiting PIK3CA in squamous cell
carcinomas. Genes Dev. 16:984–993. 2002. View Article : Google Scholar : PubMed/NCBI
|
|
13
|
Blanco R, Iwakawa R, Tang M, Kohno T,
Angulo B, Pio R, Montuenga LM, Minna JD, Yokota J and
Sanchez-Cespedes M: A gene-alteration profile of human lung cancer
cell lines. Hum Mutat. 30:1199–1206. 2009. View Article : Google Scholar : PubMed/NCBI
|
|
14
|
Etemadmoghadam D, Weir BA, Au-Yeung G,
Alsop K, Mitchell G, George J, Davis S, D'Andrea AD, Simpson K,
Hahn WC, et al; Australian Ovarian Cancer Study Group. Synthetic
lethality between CCNE1 amplification and loss of BRCA1. Proc Natl
Acad Sci USA. 110:19489–19494. 2013. View Article : Google Scholar : PubMed/NCBI
|
|
15
|
Shoemaker RH, Monks A, Alley MC, Scudiero
DA, Fine DL, McLemore TL, Abbott BJ, Paull KD, Mayo JG and Boyd MR:
Development of human tumor cell line panels for use in
disease-oriented drug screening. Prog Clin Biol Res. 276:265–286.
1988.PubMed/NCBI
|
|
16
|
Greshock J, Bachman KE, Degenhardt YY,
Jing J, Wen YH, Eastman S, McNeil E, Moy C, Wegrzyn R, Auger K, et
al: Molecular target class is predictive of in vitro response
profile. Cancer Res. 70:3677–3686. 2010. View Article : Google Scholar : PubMed/NCBI
|
|
17
|
Forbes SA, Bindal N, Bamford S, Cole C,
Kok CY, Beare D, Jia M, Shepherd R, Leung K, Menzies A, et al:
COSMIC: mining complete cancer genomes in the Catalogue of Somatic
Mutations in Cancer. Nucleic Acids Res. 39(Database): D945–D950.
2011. View Article : Google Scholar :
|
|
18
|
Kim N, He N and Yoon S: Cell line modeling
for systems medicine in cancers (Review). Int J Oncol. 44:371–376.
2014.
|
|
19
|
Jeong E, He N, Park H, Song M, Kim N, Lee
S and Yoon S: MACE: mutation-oriented profiling of chemical
response and gene expression in cancers. Bioinformatics.
31:1508–1514. 2015. View Article : Google Scholar
|
|
20
|
McDermott U, Sharma SV, Dowell L,
Greninger P, Montagut C, Lamb J, Archibald H, Raudales R, Tam A,
Lee D, et al: Identification of genotype-correlated sensitivity to
selective kinase inhibitors by using high-throughput tumor cell
line profiling. Proc Natl Acad Sci USA. 104:19936–19941. 2007.
View Article : Google Scholar : PubMed/NCBI
|
|
21
|
Vasudevan KM, Barbie DA, Davies MA,
Rabinovsky R, McNear CJ, Kim JJ, Hennessy BT, Tseng H, Pochanard P,
Kim SY, et al: AKT-independent signaling downstream of oncogenic
PIK3CA mutations in human cancer. Cancer Cell. 16:21–32. 2009.
View Article : Google Scholar : PubMed/NCBI
|
|
22
|
Craft CS, Zou W, Watkins M, Grimston S,
Brodt MD, Broekelmann TJ, Weinbaum JS, Teitelbaum SL, Pierce RA,
Civitelli R, et al: Microfibril-associated glycoprotein-1, an
extra-cellular matrix regulator of bone remodeling. J Biol Chem.
285:23858–23867. 2010. View Article : Google Scholar : PubMed/NCBI
|
|
23
|
Stemke-Hale K, Gonzalez-Angulo AM, Lluch
A, Neve RM, Kuo WL, Davies M, Carey M, Hu Z, Guan Y, Sahin A, et
al: An integrative genomic and proteomic analysis of PIK3CA, PTEN,
and AKT mutations in breast cancer. Cancer Res. 68:6084–6091. 2008.
View Article : Google Scholar : PubMed/NCBI
|
|
24
|
Tibes R, Qiu Y, Lu Y, Hennessy B, Andreeff
M, Mills GB and Kornblau SM: Reverse phase protein array:
validation of a novel proteomic technology and utility for analysis
of primary leukemia specimens and hematopoietic stem cells. Mol
Cancer Ther. 5:2512–2521. 2006. View Article : Google Scholar : PubMed/NCBI
|
|
25
|
Agresti A; John Wiley & Sons.
Categorical Data Analysis. Wiley Series in Probability and
Statistics. Wiley-Interscience; New York: 2002
|
|
26
|
Kim N, Park H, He N, Lee HY and Yoon S:
QCanvas: An Advanced Tool for Data Clustering and Visualization of
Genomics Data. Genomics Inform. 10:263–265. 2012. View Article : Google Scholar
|
|
27
|
Subramanian A, Tamayo P, Mootha VK,
Mukherjee S, Ebert BL, Gillette MA, Paulovich A, Pomeroy SL, Golub
TR, Lander ES, et al: Gene set enrichment analysis: a
knowledge-based approach for interpreting genome-wide expression
profiles. Proc Natl Acad Sci USA. 102:15545–15550. 2005. View Article : Google Scholar : PubMed/NCBI
|
|
28
|
Rocco JW and Sidransky D:
p16(MTS-1/CDKN2/INK4a) in cancer progression. Exp Cell Res.
264:42–55. 2001. View Article : Google Scholar : PubMed/NCBI
|
|
29
|
Gilkes DM, Semenza GL and Wirtz D: Hypoxia
and the extra-cellular matrix: drivers of tumour metastasis. Nat
Rev Cancer. 14:430–439. 2014. View Article : Google Scholar : PubMed/NCBI
|
|
30
|
Mazieres J, He B, You L, Xu Z and Jablons
DM: Wnt signaling in lung cancer. Cancer Lett. 222:1–10. 2005.
View Article : Google Scholar : PubMed/NCBI
|
|
31
|
Chang F, Steelman LS, Lee JT, Shelton JG,
Navolanic PM, Blalock WL, Franklin RA and McCubrey JA: Signal
transduction mediated by the Ras/Raf/MEK/ERK pathway from cytokine
receptors to transcription factors: potential targeting for
therapeutic intervention. Leukemia. 17:1263–1293. 2003. View Article : Google Scholar : PubMed/NCBI
|
|
32
|
Wang S and Basson MD: Akt directly
regulates focal adhesion kinase through association and serine
phosphorylation: Implication for pressure-induced colon cancer
metastasis. Am J Physiol Cell Physiol. 300:C657–C670. 2011.
View Article : Google Scholar : PubMed/NCBI
|
|
33
|
Song MS, Salmena L and Pandolfi PP: The
functions and regulation of the PTEN tumour suppressor. Nat Rev Mol
Cell Biol. 13:283–296. 2012.PubMed/NCBI
|