Cancer is the leading cause of morbidity and
mortality worldwide according to the data of the International
Agency for Research on Cancer (https://www.iarc.fr/), updated February, 2015. In
2012, there were an estimated 14 million new cancer cases and 8.2
million cancer-related deaths (1).
Multiple studies indicate that the most prevalent cancers are lung
(1.59 million deaths), liver (745,000 deaths), stomach (723,000
deaths), colorectal (694,000 deaths), breast (521,000 deaths) and
esophageal cancer (400,000 deaths) (1). Since aberrations in the transcriptional
expression are known to cause cancer, a primary approach to
understanding cancer is to identify oncogenic genes and elucidate
their roles in cancer regulation (2).
The achaete-scute complex-like (ASCL) gene family,
also referred to as ‘achaete-scute complex homolog’ or
‘achaete-scute family basic helix-loop-helix transcription factor’
and mammalian achaete-scute homologues (MASH), comprises five
family members (ASCL1-ASCL5; Table
I) (3,4). All ASCL genes encode basic
helix-loop-helix transcription factors that control the development
of the nervous system (2,3). Given the involvement of ASCL in
neuroblast cell fate determination, the ASCL family members are
also referred to as proneural genes. The function of the ASCL gene
family is highly conserved across all vertebrates; however, ASCL
family gene expression and their effect on target cells are not
restricted to the nervous system. For example, expression of ASCL
family members is detected in progenitor cells during muscle and
gut cell differentiation (5–7). These findings emphasize the
significance of ASCL genes during organogenesis. However, whether
ASCL family members play an integral role in cancer initiation and
progression has not been fully elucidated.
ASCL1 is briefly expressed during nervous system
development, including olfactory and autonomic neural development
(3). ASCL1 is also detected in
sympathetic neurons during early embryonic stages in humans
(4). In addition to its role during
development, ASCL1 overexpression has been associated with human
neuroendocrine cancers. However, whether ASCL1 plays a role in the
initiation and progression of other cancers remains unclear
(8,9).
Little is known on the function of the remaining
ASCL family members. ASCL3 is expressed in adult progenitor cells
that mature into acinar- and duct-type cells in murine salivary
glands (14). ASCL4 may play a role
during skin development and it exhibits a 7-fold higher expression
levels in fetal skin compared with adult skin (15). At present, the mechanism and function
of ASCL5 are yet to be determined. Although previous studies
describe a developmentally significant role for the ASCL gene
family, our overall understanding of their function during
development and their potential roles during tumorigenesis is
incomplete.
Major strives have been made to catalog the mRNA
expression profiles of numerous cancers in vast databases. One
advantage of these massive resources is to increase our ability to
identify potential biomarkers in specific tumors and to
characterize their molecular signatures. Since tumor initiation
coincides with alterations in normal gene expression, analysis of
the differential gene expression in tumor cells may reveal unique
tumor biomarkers. Thus, these databases, particularly the Oncomine
microarray database (16), were
utilized to gain a better understanding of the ASCL family role in
the initiation and progression of several tumors, aiming to provide
useful insights in prospective research into cancer association
with the ASCL gene family.
A meta-analysis was used to analyze the mRNA
expression of the ASCL family in clinical cancer specimens by
following the PRISMA guidelines (17,18)
Oncomine (www.oncomine.org), a web-based
microarray database, was used to analyze the mRNA expression of
ASCL in clinical cancer tissue (19). According to ‘Oncomine Platform
Overview Q1 2014,’ the database resource of Oncomine includes
upwards of 700 independent datasets with an estimated 90,000
microarray trials. Oncomine has standardized and organized the
datasets of public cancer microarray data into different cancer
type and subtypes (16,20).
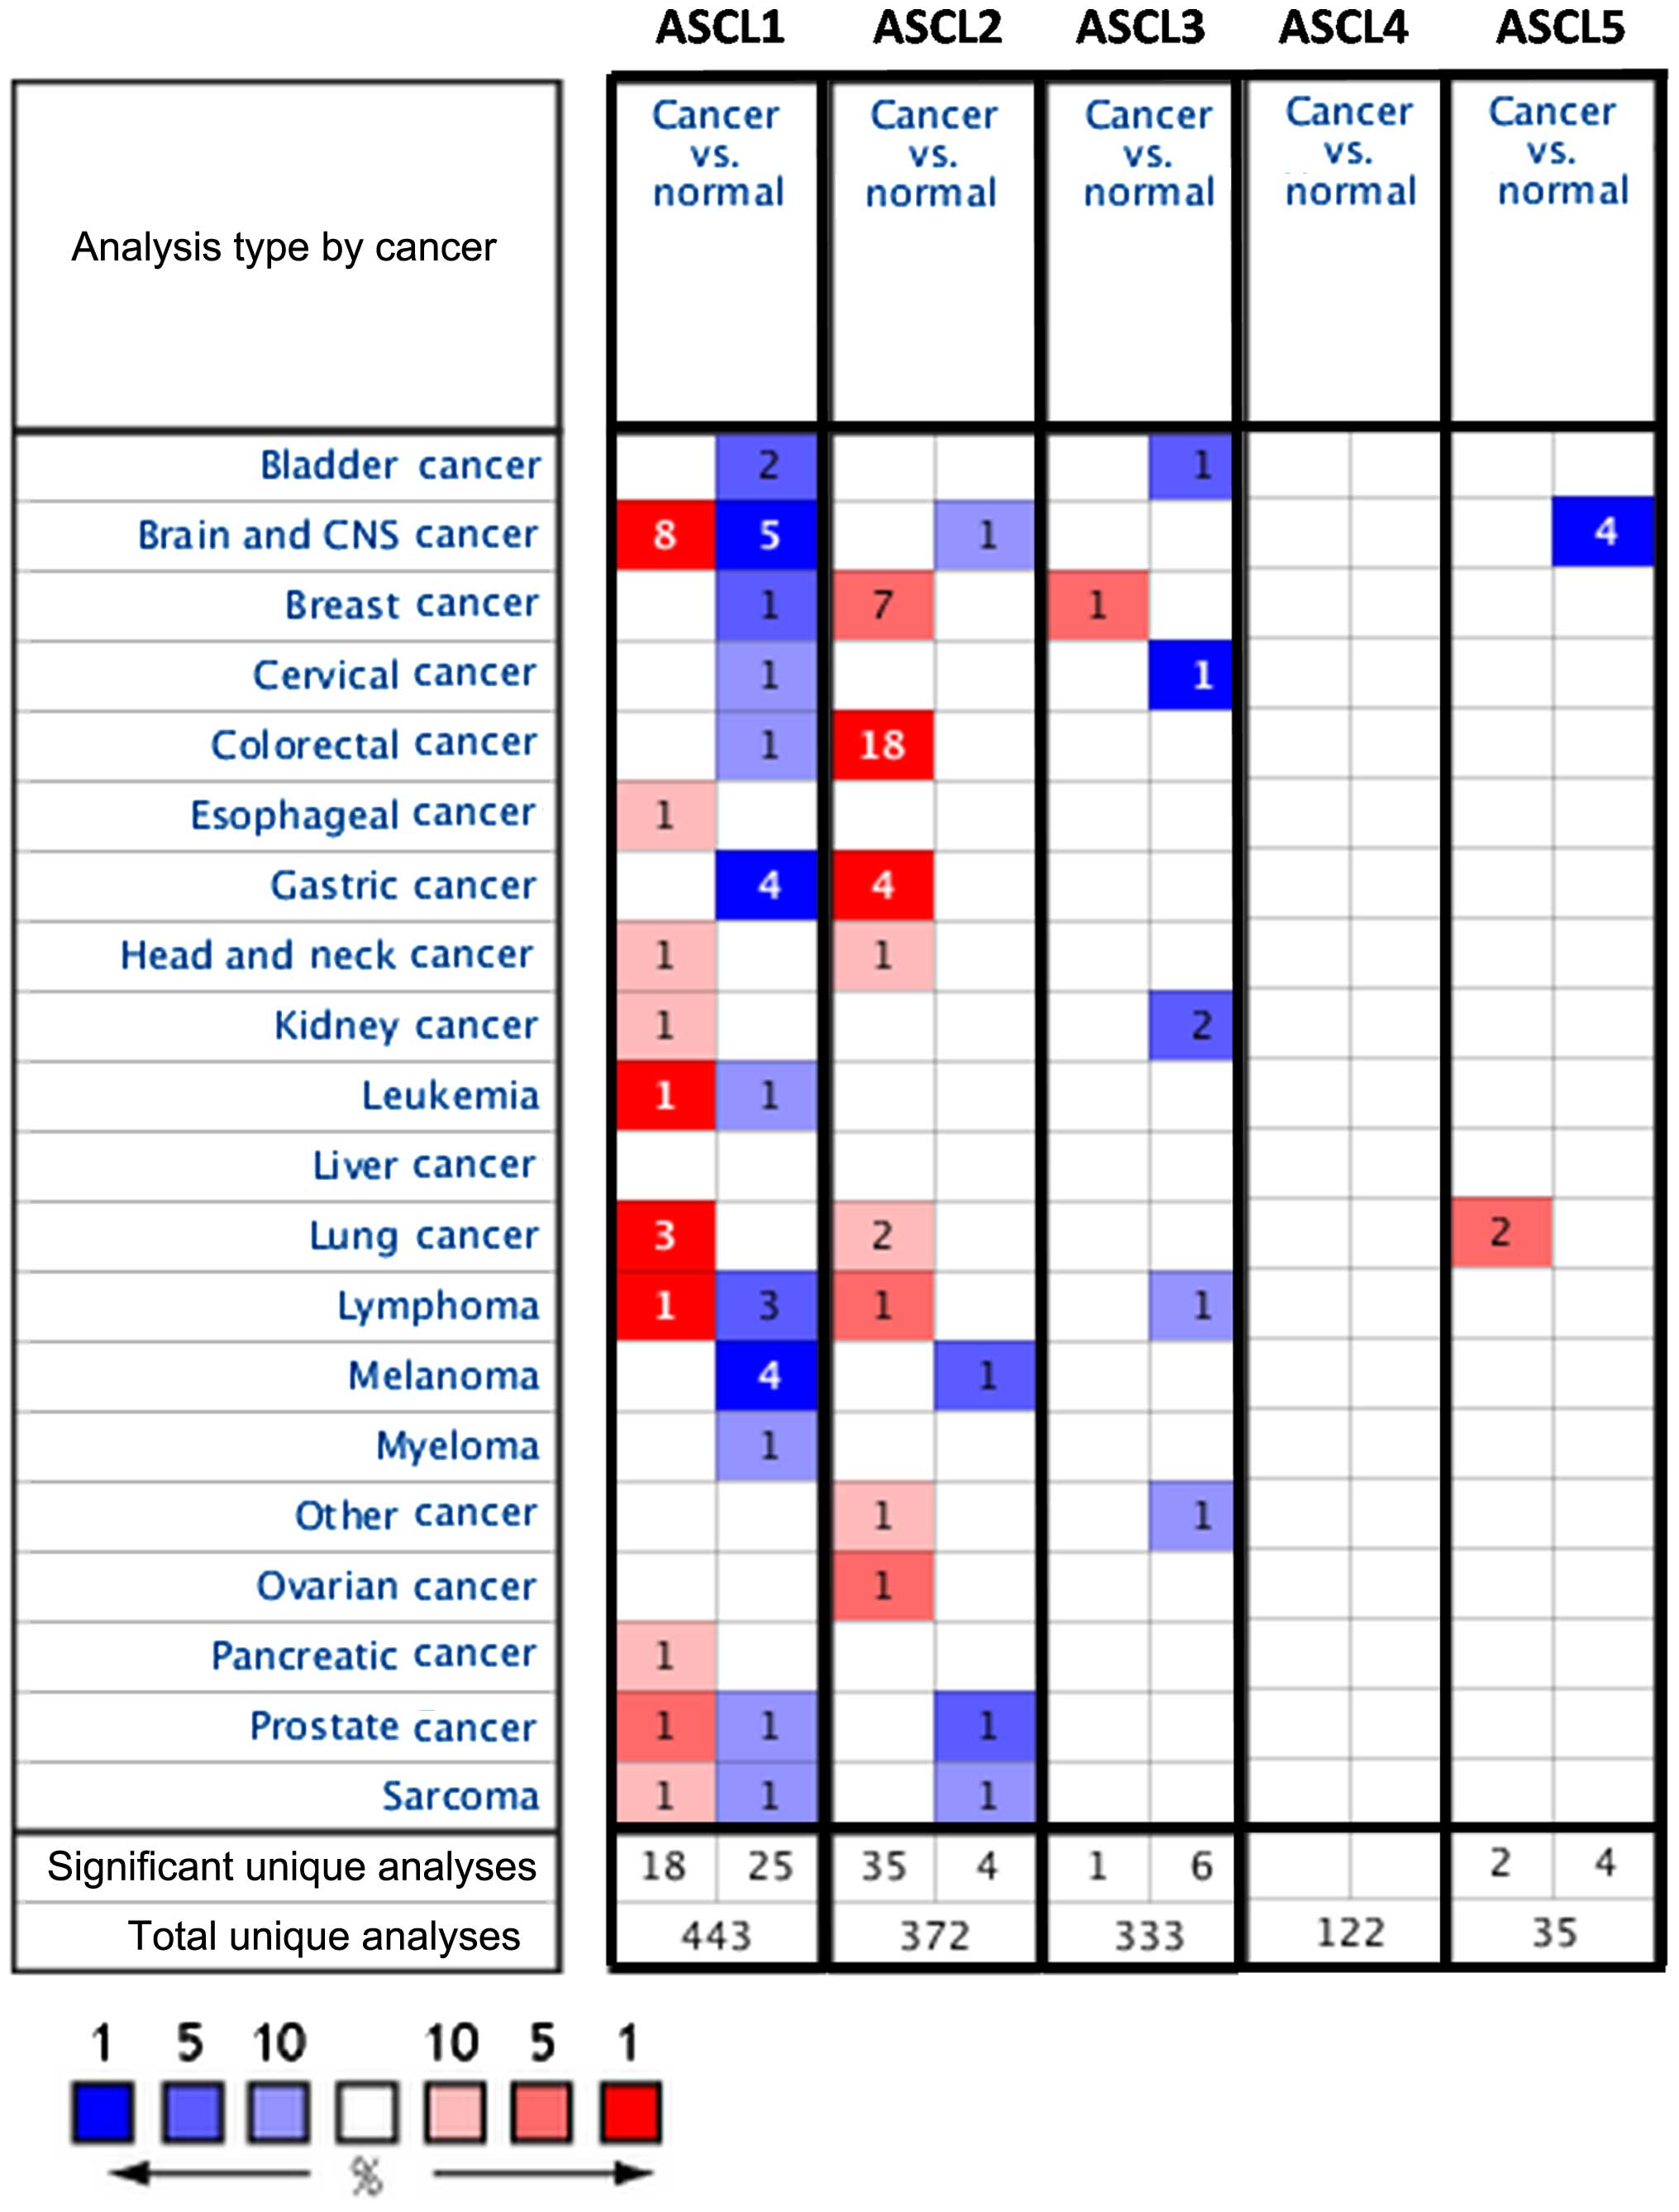
ASCL gene (ASCL1-5) expression in 20 cancer types
was investigated. Detailed information on ASCL genes, such as
tissue of origin, comparing mRNA expression with matched normal
tissue types, was displayed in groups. The gene summary view in
Oncomine was presented throughout the analysis with an alteration
in color, reflecting the degree of expression. The expression
coloration represents a gene with highest ranking in a particular
type of cancer based on the threshold analysis (Fig. 1).
The cancer vs. normal filter that only displayed
datasets investigating ASCL gene mRNA expression in the same tissue
of origin was selected. To be included in the study, all the data
had to satisfy the threshold with a P-value of <0.01, a fold
change of >1.5 and a gene rank percentile of <10%.
Statistical analyses were performed using the Oncomine default
algorithms, such as P-values, two-tailed Student's t-test, and
multiple testing corrections.
Several studies have identified potential roles for
ASCL family members in cancer development; however, our overall
understanding of ASCL family member function during tumor
initiation and progression is incomplete. To investigate a
potential alteration in ASCL family gene expression in different
types of cancer, we accessed the web-based Oncomine microarray
database to analyze 20 different types of cancer. Cancer tissue was
compared with normal tissue (control) and thresholds were set to
screen suitable datasets from the Oncomine database. To include
suitable datasets for further analysis, the gene expression in
cancer cells compared with that of normal tissue had to fulfill the
following threshold criteria: Fold change >1.5, P<0.01 and
gene rank percentile <10% (Fig.
1). Our analysis demonstrated alterations in ASCL gene family
expression in multiple cancer types, which may provide useful
information for future studies investigating the role of ASCL genes
in tumorigenesis.
The proneural transcriptional factor ASCL1/MASH1 is
essential for proper nervous system development (21). In the cerebrum, ASCL1 controls the
primitive as well as the late phases of neurogenesis, with the
division of radial glia progenitors and the radial migration of
post-mitotic neurons (22,23). ASCL1 controls the expression of
numerous target genes that are involved in cell cycle progression
and cytoskeletal reorganization associated with neuronal cell
migration (6,7). Recently, a potential oncogenic role for
ASCL1 in lung cancer has been reported (23); however, the role of ASCL1 in cancer
remains unclear. Our analysis indicated that ASCL1 is significantly
overexpressed in the majority of cancer types, such as cancers of
the brain, lung, head and neck, prostate, pancreas, kidney,
esophagus, leukemia, lymphoma and sarcoma (Fig. 1). ASCL1 also ranked in the top 1% of
overexpressed genes in leukemia, brain and lung cancer.
Importantly, our analysis indicated that ASCL1 is overexpressed in
the majority of brain cancers, such as glioblastoma,
oligodendroglioma, anaplastic astrocytoma, anaplastic
oligodendroglioma and anaplastic oligoastrocytoma. Compared with
normal tissue, ASCL1 exhibited a higher expression in brain tumor
tissues (P-values of 0.004–2.50E-21), and the ASCL1 gene ranked
1–7% in our meta-analysis results (Table II). We found that, in various lung
cancers, such as small-cell lung carcinoma and carcinoid tumors,
ASCL1 was significantly overexpressed (P-values of 0.002–3.53E-13)
and the gene ranked in the top 1–8% relative to the control. In
addition to brain tumors, ASCL1 was also highly expressed in acute
adult T-cell leukemia/lymphoma, with the gene ranking in the top
1%, a 3.76-fold change, and a P=3.43E-5. These data indicated that
ASCL1 expression varied in different types of leukemia. We also
observed that ASCL1 was highly expressed in leiomyosarcoma
(3.55-fold change, P=6.13E-4 and gene ranking in the top 7%),
prostate carcinoma (3.21-fold change, P=0.001 and gene ranking in
the top 1%), pancreatic adenocarcinoma (3.22-fold change, P=0.002
and gene ranking in the top 6%), renal oncocytoma (5.16-fold
change, P=0.002 and gene ranking in the top 8%) and Barrett's
esophagus (1.95-fold change, P=0.002 and gene ranking in the top
9%) (Table II).
In contrast to brain cancer and lymphomas, other
cancers exhibited a reduction in ASCL1 expression. Gastric cancer
and melanoma were among the top 1% of tumors that exhibited ASCL
downregulation. The reduction in the ASCL1 transcript level
suggested a tumor suppressor role, since tumor suppressor genes
tend to exhibit a low or reduced expression in tumor tissue
compared with normal tissue. Our analysis indicated lower ASCL1
expression in gastric, bladder and lung cancers. Evidence of this
trend is also supported by a previous study that specifically
evaluated a tumor suppressor gene in breast cancer datasets from
the Oncomine database, which revealed a significant downregulation
and low expression of the tumor suppressor gene ADAMTS1 in breast
carcinomas when compared with normal tissue (24). Another similar study on the SIRT3
tumor suppressor gene also revealed lower expression in various
tumor types (25). Given the pattern
of downregulation, we hypothesized that ASCL1 may also play a tumor
suppressor role in a subset of tissues. ASCL1 expression was
considerably downregulated in lymphoma (diffuse large B-cell
lymphoma, primary effusion lymphoma and mantle cell lymphoma). The
reduction in ASCL1 expression ranged from −1.61- to −2.08-fold
change, with P-values of 9.25E-4-1.15E-6 and the gene ranking in
the top 3–10%. Our bioinformatics analyses of gastric cancer
revealed that ASCL1 exhibited a lower expression in the majority of
gastric cancer subtypes, namely gastric mixed adenocarcinoma,
gastrointestinal stromal tumors and gastric intestinal-type
adenocarcinoma. The ASCL1 expression ranged from −1.60- to
−3.64-fold downregulation, with P-values of 0.002–1.06E-6 and the
gene ranking in the top 1–8%. ASCL1 exhibited a lower expression in
most types of melanoma, namely cutaneous melanoma, non-neoplastic
nevus, benign melanocytic skin nevus and monoclonal gammopathy of
undetermined significance. The ASCL1 transcript expression ranged
from −1.64- to −3.22-fold downregulation, with P-values of
0.003–2.27E-5 and the gene ranking in the top 1–10%. ASCL1 also
exhibited a lower expression in bladder cancer (−1.77-fold change,
P=2.36E-6 and gene ranking in the top 6%), invasive ductal breast
carcinoma (−1.59-fold change, P=5.03E-6 and gene ranking in the top
3%) and colon cancer (−3.58-fold change, P=9.57E-6 and gene ranking
in the top 7%) (Table II). These
analyses suggest that the effect of ASCL1 downregulation on
transcript expression may be an equally important alteration as
increased expression in cancer biology. Interestingly, ASCL1 was
found to be both up- and downregulated in brain tumors compared
with normal tissue. The conflicting expression profiles of ASCL1 in
the same type of cancer may be due to the wide-ranging categories
for each of the cancer subtypes (Table
II). This discrepancy may be a sample size issue arising from
the original publications' reported data including a low number of
samples from these tumor types. Collectively, our data suggest that
alterations in ASCL1 expression may adversely affect tissue
homeostasis, which may result in tumorigenesis.
ASCL2 is a basic helix-loop-helix transcription
factor that is expressed in neuronal precursors (26). ASCL2 is a target of the Wnt signaling
pathway and previous studies indicated that ASCL2 may regulate LGR5
in intestinal stem cells in response to Wnt signaling (9,27).
Moreover, ASCL2 is involved in T-helper cell (TH) 1 and TH17
differentiation (28).
ASCL2 is strongly expressed in colon cancer tissues
and cell lines (HT-29 and LS174T cells). Selective blockade of
ASCL2 disrupts tumor cell proliferation and migration in tumor
xenograft models (10,29,30), a
result consistent with our bioinformatics analysis (Fig. 1). This is particularly true in colon
cancer tissues compared with normal tissues; however, whether ASCL2
plays a role in initiation and progression of other tumor types
remains unclear.
ASCL2 expression was altered in 8 of 21 investigated
cancers and was commonly observed in colorectal, gastric, breast,
ovarian, testicular, lung and head and neck cancers, as well as
lymphoma (Fig. 1). However, based on
our bioinformatics analysis, our results were strikingly different.
Downregulation of ASCL2 was only observed in the top 5% and 9% of
underexpressed genes in melanoma, and brain and gastric cancers,
respectively (Fig. 1).
Our analysis revealed that ASCL2 expression is
significantly upregulated in various breast cancer subtypes, such
as invasive ductal, invasive lobular and medullary breast
carcinoma, with P-values of 0.009–4.39E-72, gene ranking 2–10% and
a fold change of 1.66–14.9 compared with normal tissues (Table III). In colorectal tumors, such as
adenocarcinoma of the colon, rectum, cecum or rectosigmoid region,
colonic adenoma, rectal adenoma, colon adenoma epithelia and colon
carcinoma epithelia, ASCL2 also exhibited significant upregulation
compared with normal tissues, with P-values of 3.60E-7-8.24E-52,
gene ranking 1–9% and a fold change of 5.64–31.35 (Table III).
In gastric cancers, such as diffuse gastric
adenocarcinoma, gastric intestinal-type adenocarcinoma and gastric
mixed adenocarcinoma, ASCL2 exhibited significant upregulation
compared with normal tissues, with P-values of 6.30E-4-1.74E-6,
gene ranking 1–5% and a fold change of 2.35–4.45. Additionally, we
found that ASCL2 is highly expressed in squamous cell lung
carcinoma (1.84-fold change, P=7.81E-8 and gene ranking in the top
9%), nodular lymphocyte-predominant Hodgkin's lymphoma (2.65-fold
change, P=7.61E-5 and gene ranking in the top 5%), nasopharyngeal
carcinoma (1.56-fold change, P=5.08E-4 and gene ranking in the top
10%), ovarian endometrioid adenocarcinoma (1.76-fold change,
P=0.001 and gene ranking in the top 3%); testicular seminoma
(3.21-fold change, P=0.007 and gene ranking in the top 6%)
(Table III).
Of note, lower ASCL2 gene expression levels were
found in certain cancer subtypes, such as brain and gastric cancer,
and melanoma. These subtypes included oligodendroglioma (−1.73-fold
change, P=4.42E-4 and gene ranking in the top 9%), gastrointestinal
stromal tumors (−2.59-fold change, P=4.59E-4 and gene ranking in
the top 9%), and cutaneous melanoma (−6.74-fold change, P=6.22E-4
and gene ranking in the top 5%) (Table
III). Thus, ASCL2 exhibited increased mRNA expression in some
cancer tissues and decreased expression in others. Overall, our
analysis indicated that ASCL2 was ranked in the top 10% of genes
involved in the regulation of breast, colorectal, lung, gastric,
head-neck, ovarian and testicular cancers and lymphoma, whereas in
brain cancer and melanoma it exhibited significant downregulation
compared with normal tissue (Table
III). These findings indicate that cell context-specific
alterations in ASCL2 expression may play a critical role in cancer
biology.
ASCL3 (Sgn1) belongs to the MASH gene family of
transcription factors that has been associated with cell fate
determination and contributes to the maintenance of the adult
salivary gland homeostasis (11,31). Our
database analysis indicated that ASCL3 was highly expressed in
invasive ductal breast carcinoma (2.26-fold change, P=0.002 and
gene ranking in the top 2%) compared with normal tissues (Table IV). Of the 21 analyzed tumor types,
5 exhibited a correlation with downregulation of ASCL3 (Table IV).
Analysis of various renal tumor subtypes indicated
that ASCL3 exhibited a lower expression in renal oncocytoma with a
fold change of −1.60, P=5.15E-16 and gene ranking in the top 3%.
ASCL3 expression is downregulated in cervical cancer with a fold
change of −1.65, P=1.24E-9 and gene ranking in the top 1%. In
superficial bladder cancer, we found that ASCL3 also exhibited a
lower expression, with a fold change of −1.63, P=1.16E-7 and the
gene ranking in the top 3%. In anaplastic large-cell lymphoma,
ASCL3 exhibited lower expression, with a fold change of −1.96,
P=1.58E-5 and the gene ranking in the top 8%. Melanomas and basal
cell skin carcinoma (also referred to as basalioma, the most common
malignant skin tumor), exhibited ASCL3 downregulation with a fold
change of −1.80, P=0.007 and the gene ranking in the top 10%
(Table IV). Thus, ASCL3 ranked in
the top 2% of genes exhibiting upregulation in breast cancer, while
in renal, cervical and bladder cancer, lymphoma and melanoma, ASCL3
displayed significant downregulation compared with normal tissues
(Table IV). These findings
indicated that ASCL3 may be differentially expressed in specific
types of cancer and that further investigation is required to
determine the mechanisms underlying the involvement of ASCL3 in
tumorigenesis.
ASCL4 (HASH4, bHLHa44) expression is associated with
skin development. ASCL4 exhibited a 7-fold higher expression in
fetal skin compared with adult skin (12). The role of ASCL4 in cellular function
remains elusive. Therefore, comparative genomic sequencing did not
reveal any function for this gene (32). ASCL4 expression did not satisfy the
selection criteria of the present study; therefore, it was not
selected for further investigation.
We were unable to obtain any data regarding ASCL5
based on the literature search through the PubMed database.
Analysis of the Gene Ontology database indicated that ASCL5 may be
involved in the regulation of DNA-templated transcription (33). Our bioinformatics analysis suggested
that ASCL5 was upregulated in lung cancer with a fold change of
1.96–3.71, P-values of 0.002–0.003 and the gene ranking 5–9%.
However, ASCL5 was downregulated in the majority of types of brain
tumors, such as glioblastoma, anaplastic oligoastrocytoma,
anaplastic oligodendroglioma and oligodendroglioma, with a fold
change of −3.10 to −5.50, P-values of 0.002–5.25E-12 and the gene
ranking 1–6% (Table V). To the best
of our knowledge, our bioinformatics analysis is the first report
to provide any information regarding the potential role of ASCL5 in
tumorigenesis.
Previous studies have suggested that ASCL2 is
strongly expressed in colon cancer tissues and cell lines (HT-29
and LS174T cells) and that selective blockade of ASCL2 results in
the inhibition of xenograft tumor growth, proliferation, invasion
and migration (10,29,30).
ASCL2 may promote colorectal (30),
lung (35) and gastric cancer
(36), suggesting a crucial role for
ASCL2 involvement in tumor development. These data are consistent
with our bioinformatics analysis (Fig.
1). Strikingly, ASCL2 expression analysis indicated increased
mRNA expression in some cancer tissues and decreased expression in
others. ASCL2 is in the top 10% of genes exhibiting overexpression
in breast, colorectal, lung, gastric, head-neck, ovarian and
testicular cancers, as well as lymphoma. However, brain tumor and
melanoma subtypes exhibited significant reductions in the
expression of ASCL2 when compared with normal tissues (Table III). Of note, ASCL3 expression
displayed a wide range of mRNA levels in various cancers. ASCL3 was
in the top 2% of overexpressed genes in breast cancer. Conversely,
in lymphomas, melanomas, renal, cervical and bladder cancers, ASCL3
expression was significantly reduced compared with that in normal
tissues (Table IV). Expression
analysis of ASCL5 suggested a correlation between elevated ASCL5
expression and lung cancer development. ASCL5 was one of highly
expressed genes, ranking 5–9% in lung cancer. Interestingly, ASCL5
was downregulated in most types of brain tumors, such as
glioblastoma, anaplastic oligoastrocytoma and anaplastic
oligodendroglioma. The decrease in fold change ranged from −3.10 to
−5.50, the P-values ranged from 0.002 to 5.25E-12, with the gene
ranking 1–6% (Table V).
Intriguingly, ASCL members exhibited increased expression in some
cancer tissues and decreased expression in others. This is
particularly apparent for ASCL2, ASCL3 and ASCL5 that displayed
mRNA expression changes (either up-or downregulated in specific
cancers). According to these data, both the up- and downregulation
of ASCL genes may play an important role in tumor development. The
emerging view of the unique developmental niche of ASCL members in
early progenitors of diverse neural lineages suggests a potentially
critical role in injury response, wound healing and tumorigenesis.
However, a limited number of studies to date suggest that these
ASCL members may contribute significantly to cancer development.
The available data collectively suggest that alterations in the
expression of ASCL genes may affect cellular behavior, such as cell
proliferation, thereby initiating tumor development. The present
study demonstrated that ASCL members may be involved in tumor
development and introduces ASCL genes as potential candidates for
future prognostic and therapeutic targets.
Computational analyses and data mining were
performed using the system provided by the Bioinformatics Core at
the National Cheng Kung University, supported by the National
Science Council, Taiwan. We would also like to thank the Ministry
of Science and Technology for the grants MOST103-2325-B006-012 (to
MDL) and 104-2917-I-006-002 (to CYW) and the National Cancer
Institute (USA) for the R01 CA180039 grant (to ZW).
|
1
|
Forman D, Ferlay J, Stewart B and Wild C:
The global and regional burden of cancer. World cancer report.
64–185. 2014.
|
|
2
|
Hanahan D and Weinberg RA: Hallmarks of
cancer: The next generation. Cell. 144:646–674. 2011. View Article : Google Scholar : PubMed/NCBI
|
|
3
|
Guillemot F, Lo LC, Johnson JE, Auerbach
A, Anderson DJ and Joyner AL: Mammalian achaete-scute homolog-1 is
required for the early development of olfactory and autonomic
neurons. Cell. 75:463–476. 1993. View Article : Google Scholar : PubMed/NCBI
|
|
4
|
Gestblom C, Grynfeld A, Ora I, Ortoft E,
Larsson C, Axelson H, Sandstedt B, Cserjesi P, Olson EN and Påhlman
S: The basic helix-loop-helix transcription factor dHAND, a marker
gene for the developing human sympathetic nervous system, is
expressed in both high- and low-stage neuroblastomas. Lab Invest.
79:67–79. 1999.PubMed/NCBI
|
|
5
|
Mizuguchi R, Kriks S, Cordes R, Gossler A,
Ma QF and Goulding M: ASCL1 and GSH1/2 control inhibitory and
excitatory cell fate in spinal sensory interneurons. Nat Neurosci.
9:770–778. 2006. View
Article : Google Scholar : PubMed/NCBI
|
|
6
|
Pattyn A, Simplicio N, van Doorninck JH,
Goridis C, Guillemot F and Brunet JF: ASCL1/MASH1 is required for
the development of central serotonergic neurons. Nat Neurosci.
7:589–595. 2004. View
Article : Google Scholar : PubMed/NCBI
|
|
7
|
Ge WH, He F, Kim KJ, Blanchi B, Coskun V,
Nguyen L, Wu X, Zhao J, Heng JI, Martinowich K, et al: Coupling of
cell migration with neurogenesis by proneural bHLH factors. Proc
Natl Acad Sci USA. 103:1319–1324. 2006. View Article : Google Scholar : PubMed/NCBI
|
|
8
|
Borges M, Linnoila RI, van de Velde HJ,
Chen H, Nelkin BD, Mabry M, Baylin SB and Ball DW: An achaete-scute
homologue essential for neuroendocrine differentiation in the lung.
Nature. 386:852–855. 1997. View
Article : Google Scholar : PubMed/NCBI
|
|
9
|
Ball DW, Azzoli CG, Baylin SB, Chi D, Dou
S, Donis-Keller H, Cumaraswamy A, Borges M and Nelkin BD:
Identification of a human achaete-scute homolog highly expressed in
neuroendocrine tumors. Proc Natl Acad Sci USA. 90:5648–5652. 1993.
View Article : Google Scholar : PubMed/NCBI
|
|
10
|
Guillemot F, Nagy A, Auerbach A, Rossant J
and Joyner AL: Essential role of MASH-2 in extraembryonic
development. Nature. 371:333–336. 1994. View Article : Google Scholar : PubMed/NCBI
|
|
11
|
Schuijers J, Junker JP, Mokry M, Hatzis P,
Koo BK, Sasselli V, van der Flier LG, Cuppen E, van Oudenaarden A
and Clevers H: ASCL2 acts as an R-spondin/WNT-responsive switch to
control stemness in intestinal crypts. Cell Stem Cell. 16:158–170.
2015. View Article : Google Scholar : PubMed/NCBI
|
|
12
|
van der Flier LG, van Gijn ME, Hatzis P,
Kujala P, Haegebarth A, Stange DE, Begthel H, van den Born M,
Guryev V, Oving I, et al: Transcription factor achaete scute-like 2
controls intestinal stem cell fate. Cell. 136:903–912. 2009.
View Article : Google Scholar : PubMed/NCBI
|
|
13
|
Tian Y, Pan Q, Shang Y, Zhu R, Ye J, Liu
Y, Zhong X, Li S, He Y, Chen L, et al: MicroRNA-200 (miR-200)
cluster regulation by achaete scute-like 2 (ASCL2): Impact on the
epithelial-mesenchymal transition in colon cancer cells. J Biol
Chem. 289:36101–36115. 2014. View Article : Google Scholar : PubMed/NCBI
|
|
14
|
Rugel-Stahl A, Elliott ME and Ovitt CE:
Ascl3 marks adult progenitor cells of the mouse salivary gland.
Stem Cell Res. 8:379–387. 2012. View Article : Google Scholar : PubMed/NCBI
|
|
15
|
Jonsson M, Björntorp Mark E, Brantsing C,
Brandner JM, Lindahl A and Asp J: HASH4, a novel human
achaete-scute homologue found in fetal skin. Genomics. 84:859–866.
2004. View Article : Google Scholar : PubMed/NCBI
|
|
16
|
Rhodes DR, Kalyana-Sundaram S, Mahavisno
V, Varambally R, Yu J, Briggs BB, Barrette TR, Anstet MJ,
Kincead-Beal C, Kulkarni P, et al: Oncomine 3.0: Genes, pathways,
and networks in a collection of 18,000 cancer gene expression
profiles. Neoplasia. 9:166–180. 2007. View Article : Google Scholar : PubMed/NCBI
|
|
17
|
Ewald JA, Downs TM, Cetnar JP and Ricke
WA: Expression microarray meta-analysis identifies genes associated
with Ras/MAPK and related pathways in progression of
muscle-invasive bladder transition cell carcinoma. PLoS One.
8:e554142013. View Article : Google Scholar : PubMed/NCBI
|
|
18
|
Moher D, Liberati A, Tetzlaff J and Altman
DG: PRISMA Group: Preferred reporting items for systematic reviews
and meta-analyses: The PRISMA statement. BMJ. 339:b25352009.
View Article : Google Scholar : PubMed/NCBI
|
|
19
|
Rhodes DR and Chinnaiyan AM: Integrative
analysis of the cancer transcriptome. Nat Genet. 37:S31–S37. 2005.
View Article : Google Scholar : PubMed/NCBI
|
|
20
|
Rhodes DR, Yu JJ, Shanker K, Deshpande N,
Varambally R, Ghosh D, Barrette T, Pandey A and Chinnaiyan AM:
ONCOMINE: A cancer microarray database and integrated data-mining
platform. Neoplasia. 6:1–6. 2004. View Article : Google Scholar : PubMed/NCBI
|
|
21
|
Casarosa S, Fode C and Guillemot F: MASH1
regulates neurogenesis in the ventral telencephalon. Development.
126:525–534. 1999.PubMed/NCBI
|
|
22
|
Pacary E, Heng JL, Azzarelli R, Riou P,
Castro D, Lebel-Potter M, Parras C, Bell DM, Ridley AJ, Parsons M
and Guillemot F: Proneural transcription factors regulate different
steps of cortical neuron migration through Rnd-mediated inhibition
of RhoA signaling. Neuron. 69:1069–1084. 2011. View Article : Google Scholar : PubMed/NCBI
|
|
23
|
Augustyn A, Borromeo M, Wang T, Fujimoto
J, Shao C, Dospoy PD, Lee V, Tan C, Sullivan JP, Larsen JE, et al:
ASCL1 is a lineage oncogene providing therapeutic targets for
high-grade neuroendocrine lung cancers. Proc Natl Acad Sci USA.
111:14788–14793. 2014. View Article : Google Scholar : PubMed/NCBI
|
|
24
|
Martino-Echarri E, Fernández-Rodríguez R,
Rodríguez-Baena FJ, Barrientos-Durán A, Torres-Collado AX,
Plaza-Calonge Mdel C, Amador-Cubero S, Cortés J, Reynolds LE,
Hodivala-Dilke KM, et al: Contribution of ADAMTS1 as a tumor
suppressor gene in human breast carcinoma. Linking its tumor
inhibitory properties to its proteolytic activity on nidogen-1 and
nidogen-2. Int J Cancer. 133:2315–2324. 2013. View Article : Google Scholar : PubMed/NCBI
|
|
25
|
Kim HS, Patel K, Muldoon-Jacobs K, Bisht
KS, Aykin-Burns N, Pennington JD, van der Meer R, Nguyen P, Savage
J, Owens KM, et al: SIRT3 is a mitochondria-localized tumor
suppressor required for maintenance of mitochondrial integrity and
metabolism during stress. Cancer Cell. 17:41–52. 2010. View Article : Google Scholar : PubMed/NCBI
|
|
26
|
Johnson JE, Birren SJ and Anderson DJ: Two
rat homologues of drosophila achaete-scute specifically expressed
in neuronal precursors. Nature. 346:858–861. 1990. View Article : Google Scholar : PubMed/NCBI
|
|
27
|
Yan KS and Kuo CJ: ASCL2 reinforces
intestinal stem cell identity. Cell Stem Cell. 16:105–106. 2015.
View Article : Google Scholar : PubMed/NCBI
|
|
28
|
Liu XD, Chen X, Zhong B, Wang A, Wang X,
Chu F, Nurieva RI, Yan X, Chen P, van der Flier LG, et al:
Transcription factor achaete-scute homologue 2 initiates follicular
T-helper-cell development. Nature. 507:513–518. 2014. View Article : Google Scholar : PubMed/NCBI
|
|
29
|
Zhu R, Yang YT, Tian Y, Bai J, Zhang X, Li
X, Peng Z, He Y, Chen L, Pan Q, et al: ASCL2 knockdown results in
tumor growth arrest by miRNAs-302b-related inhibition of colon
cancer progenitor cells. Plos One. 7:e321702012. View Article : Google Scholar : PubMed/NCBI
|
|
30
|
Ziskin JL, Dunlap D, Yaylaoglu M, Fodor
IK, Forrest WF, Patel R, Ge N, Hutchins GG, Pine JK, Quirke P, et
al: In situ validation of an intestinal stem cell signature in
colorectal cancer. Gut. 62:1012–1023. 2013. View Article : Google Scholar : PubMed/NCBI
|
|
31
|
Bullard T, Koek L, Roztocil E, Kingsley
PD, Mirels L and Ovitt CE: ASCL3 expression marks a progenitor
population of both acinar and ductal cells in mouse salivary
glands. Dev Biol. 320:72–78. 2008. View Article : Google Scholar : PubMed/NCBI
|
|
32
|
Amid C, Bahr A, Mujica A, Sampson N, Bikar
SE, Winterpacht A, Zabel B, Hankeln T and Schmidt ER: Comparative
genomic sequencing reveals a strikingly similar architecture of a
conserved syntenic region on human chromosome 11p15.3 (including
gene ST5) and mouse chromosome 7. Cytogenet Cell Genet. 93:284–290.
2001. View Article : Google Scholar : PubMed/NCBI
|
|
33
|
Ashburner M, Ball CA, Blake JA, Botstein
D, Butler H, Cherry JM, Davis AP, Dolinski K, Dwight SS, Eppig JT,
et al: Gene Ontology: Tool for the unification of biology. The Gene
Ontology Consortium. Nat Genet. 25:25–29. 2000. View Article : Google Scholar : PubMed/NCBI
|
|
34
|
Lenhart R, Kirov S, Desilva H, Cao J, Lei
M, Johnston K, Peterson R, Schweizer L, Purandare A, Ross-Macdonald
P, et al: Sensitivity of small cell lung cancer to BET inhibition
is mediated by regulation of ASCL1 gene expression. Mol Cancer
Ther. 14:2167–2174. 2015. View Article : Google Scholar : PubMed/NCBI
|
|
35
|
Hu XG, Chen L, Wang QL, Zhao XL, Tan J,
Cui YH, Liu XD, Zhang X and Bian XW: Elevated expression of ASCL2
is an independent prognostic indicator in lung squamous cell
carcinoma. J Clin Pathol. 69:313–318. 2016. View Article : Google Scholar : PubMed/NCBI
|
|
36
|
Sureban SM, Qu D and Houchen CW:
Regulation of miRNAs by agents targeting the tumor stem cell
markers DCLK1, MSI1, LGR5, and BMI1. Curr Pharmacol Rep. 1:217–222.
2015. View Article : Google Scholar : PubMed/NCBI
|
|
37
|
López-Carballo G, Moreno L, Masia S, Pérez
P and Barettino D: Activation of the phosphatidylinositol
3-kinase/Akt signaling pathway by retinoic acid is required for
neural differentiation of SH-SY5Y human neuroblastoma cells. J Biol
Chem. 277:25297–25304. 2002. View Article : Google Scholar : PubMed/NCBI
|
|
38
|
Letinic K, Zoncu R and Rakic P: Origin of
GABAergic neurons in the human neocortex. Nature. 417:645–649.
2002. View Article : Google Scholar : PubMed/NCBI
|
|
39
|
Persson P, Jögi A, Grynfeld A, Påhlman S
and Axelson H: HASH-1 and E2-2 are expressed in human neuroblastoma
cells and form a functional complex. Biochem Biophys Res Commun.
274:22–31. 2000. View Article : Google Scholar : PubMed/NCBI
|
|
40
|
Wang XY, el H Dakir, Naizhen X,
Jensen-Taubman SM, DeMayo FJ and Linnoila RI: Achaete-scute
homolog-1 linked to remodeling and preneoplasia of pulmonary
epithelium. Lab Invest. 87:527–539. 2007. View Article : Google Scholar : PubMed/NCBI
|
|
41
|
de Pontual L, Népote V, Attié-Bitach T, Al
Halabiah H, Trang H, Elghouzzi V, Levacher B, Benihoud K, Augé J,
Faure C, et al: Noradrenergic neuronal development is impaired by
mutation of the proneural HASH-1 gene in congenital central
hypoventilation syndrome (Ondine's curse). Hum Mol Genet.
12:3173–3180. 2003. View Article : Google Scholar : PubMed/NCBI
|
|
42
|
Ito T, Udaka N, Okudela K, Yazawa T and
Kitamura H: Mechanisms of neuroendocrine differentiation in
pulmonary neuroendocrine cells and small cell carcinoma. Endocr
Pathol. 14:133–139. 2003. View Article : Google Scholar : PubMed/NCBI
|
|
43
|
Kunnimalaiyaan M, Traeger K and Chen H:
Conservation of the NOTCH1 signaling pathway in gastrointestinal
carcinoid cells. Am J Physiol Gastrointest Liver Physiol.
289:G636–G642. 2005.PubMed/NCBI
|
|
44
|
Kim HJ, McMillan E, Han F and Svendsen CN:
Regionally specified human neural progenitor cells derived from the
mesencephalon and forebrain undergo increased neurogenesis
following overexpression of ASCL1. Stem cells. 27:390–398. 2009.
View Article : Google Scholar : PubMed/NCBI
|
|
45
|
Nakayama H, Scott IC and Cross JC: The
transition to endoreduplication in trophoblast giant cells is
regulated by the mSNA zinc finger transcription factor. Dev Biol.
199:150–163. 1998. View Article : Google Scholar : PubMed/NCBI
|
|
46
|
Nishiyama A, Xin L, Sharov AA, Thomas M,
Mowrer G, Meyers E, Piao Y, Mehta S, Yee S, Nakatake Y, et al:
Uncovering early response of gene regulatory networks in ESCs by
systematic induction of transcription factors. Cell Stem Cell.
5:420–433. 2009. View Article : Google Scholar : PubMed/NCBI
|
|
47
|
Tanaka M, Gertsenstein M, Rossant J and
Nagy A: Mash2 acts cell autonomously in mouse spongiotrophoblast
development. Dev Biol. 190:55–65. 1997. View Article : Google Scholar : PubMed/NCBI
|
|
48
|
Oh-McGinnis R, Bogutz AB and Lefebvre L:
Partial loss of ASCL2 function affects all three layers of the
mature placenta and causes intrauterine growth restriction. Dev
Biol. 351:277–286. 2011. View Article : Google Scholar : PubMed/NCBI
|
|
49
|
Yoshida S, Ohbo K, Takakura A, Takebayashi
H, Okada T, Abe K and Nabeshima Y: SGN1, a basic helix-loop-helix
transcription factor delineates the salivary gland duct cell
lineage in mice. Dev Biol. 240:517–530. 2001. View Article : Google Scholar : PubMed/NCBI
|
|
50
|
Rolland T, Tasan M, Charloteaux B, Pevzner
SJ, Zhong Q, Sahni N, Yi S, Lemmens I, Fontanillo C, Mosca R, et
al: A proteome-scale map of the human interactome network. Cell.
159:1212–1226. 2014. View Article : Google Scholar : PubMed/NCBI
|
|
51
|
Sun LX, Hui AM, Su Q, Vortmeyer A,
Kotliarov Y, Pastorino S, Passaniti A, Menon J, Walling J, Bailey
R, et al: Neuronal and glioma-derived stem cell factor induces
angiogenesis within the brain. Cancer Cell. 9:287–300. 2006.
View Article : Google Scholar : PubMed/NCBI
|
|
52
|
Bredel M, Bredel C, Juric D, Harsh GR,
Vogel H, Recht LD and Sikic BI: Functional network analysis reveals
extended gliomagenesis pathway maps and three novel MYC-interacting
genes in human gliomas. Cancer Res. 65:8679–8689. 2005. View Article : Google Scholar : PubMed/NCBI
|
|
53
|
Liang Y, Diehn M, Watson N, Bollen AW,
Aldape KD, Nicholas MK, Lamborn KR, Berger MS, Botstein D, Brown PO
and Israel MA: Gene expression profiling reveals molecularly and
clinically distinct subtypes of glioblastoma multiforme. Proc Natl
Acad Sci USA. 102:5814–5819. 2005. View Article : Google Scholar : PubMed/NCBI
|
|
54
|
Lee J, Kotliarova S, Kotliarov Y, Li A, Su
Q, Donin NM, Pastorino S, Purow BW, Christopher N, Zhang W, et al:
Tumor stem cells derived from glioblastomas cultured in bFGF and
EGF more closely mirror the phenotype and genotype of primary
tumors than do serum-cultured cell lines. Cancer Cell. 9:391–403.
2006. View Article : Google Scholar : PubMed/NCBI
|
|
55
|
Murat A, Migliavacca E, Gorlia T, Lambiv
WL, Shay T, Hamou MF, de Tribolet N, Regli L, Wick W, Kouwenhoven
MC, et al: Stem cell-related ‘self-renewal’ signature and high
epidermal growth factor receptor expression associated with
resistance to concomitant chemoradiotherapy in glioblastoma. J Clin
Oncol. 26:3015–3024. 2008. View Article : Google Scholar : PubMed/NCBI
|
|
56
|
French PJ, Swagemakers SM, Nagel JH,
Kouwenhoven MC, Brouwer E, van der Spek P, Luider TM, Kros JM, van
den Bent MJ and Smitt PA Sillevis: Gene expression profiles
associated with treatment response in oligodendrogliomas. Cancer
Res. 65:11335–11344. 2005. View Article : Google Scholar : PubMed/NCBI
|
|
57
|
Cancer Genome Atlas Research Network, .
Comprehensive genomic characterization defines human glioblastoma
genes and core pathways. Nature. 455:1061–1068. 2008. View Article : Google Scholar : PubMed/NCBI
|
|
58
|
Shai R, Shi T, Kremen TJ, Horvath S, Liau
LM, Cloughesy TF, Mischel PS and Nelson SF: Gene expression
profiling identifies molecular subtypes of gliomas. Oncogene.
22:4918–4923. 2003. View Article : Google Scholar : PubMed/NCBI
|
|
59
|
Bhattacharjee A, Richards WG, Staunton J,
Li C, Monti S, Vasa P, Ladd C, Beheshti J, Bueno R, Gillette M, et
al: Classification of human lung carcinomas by mRNA expression
profiling reveals distinct adenocarcinoma subclasses. Proc Natl
Acad Sci USA. 98:13790–13795. 2001. View Article : Google Scholar : PubMed/NCBI
|
|
60
|
Garber ME, Troyanskaya OG, Schluens K,
Petersen S, Thaesler Z, Pacyna-Gengelbach M, van de Rijn M, Rosen
GD, Perou CM, Whyte RI, et al: Diversity of gene expression in
adenocarcinoma of the lung. Proc Natl Acad Sci USA. 98:13784–13789.
2001. View Article : Google Scholar : PubMed/NCBI
|
|
61
|
Choi YL, Tsukasaki K, O'Neill MC, Yamada
Y, Onimaru Y, Matsumoto K, Ohashi J, Yamashita Y, Tsutsumi S,
Kaneda R, et al: A genomic analysis of adult T-cell leukemia.
Oncogene. 26:1245–1255. 2007. View Article : Google Scholar : PubMed/NCBI
|
|
62
|
Zhan FH, Barlogie B, Arzoumanian V, Huang
Y, Williams DR, Hollmig K, Pineda-Roman M, Tricot G, van Rhee F,
Zangari M, et al: A gene expression signature of benign monoclonal
gammopathy evident in multiple myeloma is linked to good prognosis.
Blood. 109:1692–1700. 2006. View Article : Google Scholar : PubMed/NCBI
|
|
63
|
Basso K, Margolin AA, Stolovitzky G, Klein
U, Dalla-Favera R and Califano A: Reverse engineering of regulatory
networks in human B cells. Nat Genet. 37:382–390. 2005. View Article : Google Scholar : PubMed/NCBI
|
|
64
|
Frierson HF Jr, El-Naggar AK, Welsh JB,
Sapinoso LM, Su AI, Cheng J, Saku T, Moskaluk CA and Hampton GM:
Large scale molecular analysis identifies genes with altered
expression in salivary adenoid cystic carcinoma. Am J Pathol.
161:1315–1323. 2002. View Article : Google Scholar : PubMed/NCBI
|
|
65
|
Detwiller KY, Fernando NT, Segal NH, Ryeom
SW, D'Amore PA and Yoon SS: Analysis of hypoxia-related gene
expression in sarcomas and effect of hypoxia on RNA interference of
vascular endothelial cell growth factor A. Cancer Res.
65:5881–5889. 2005. View Article : Google Scholar : PubMed/NCBI
|
|
66
|
Cho JY, Lim JY, Cheong JH, Park YY, Yoon
SL, Kim SM, Kim SB, Kim H, Hong SW, Park YN, et al: Gene expression
signature-based prognostic risk score in gastric cancer. Clin
Cancer Res. 17:1850–1857. 2011. View Article : Google Scholar : PubMed/NCBI
|
|
67
|
LaTulippe E, Satagopan J, Smith A, Scher
H, Scardino P, Reuter V and Gerald WL: Comprehensive gene
expression analysis of prostate cancer reveals distinct
transcriptional programs associated with metastatic disease. Cancer
Res. 62:4499–4506. 2002.PubMed/NCBI
|
|
68
|
Grasso CS, Wu YM, Robinson DR, Cao X,
Dhanasekaran SM, Khan AP, Quist MJ, Jing X, Lonigro RJ, Brenner JC,
et al: The mutational landscape of lethal castration-resistant
prostate cancer. Nature. 487:239–243. 2012. View Article : Google Scholar : PubMed/NCBI
|
|
69
|
Iacobuzio-Donahue CA, Maitra A, Olsen M,
Lowe AW, van Heek NT, Rosty C, Walter K, Sato N, Parker A, Ashfaq
R, et al: Exploration of global gene expression patterns in
pancreatic adenocarcinoma using cDNA microarrays. Am J Pathol.
162:1151–1162. 2003. View Article : Google Scholar : PubMed/NCBI
|
|
70
|
Yusenko MV, Kuiper RP, Boethe T, Ljungberg
B, van Kessel AG and Kovacs G: High-resolution DNA copy number and
gene expression analyses distinguish chromophobe renal cell
carcinomas and renal oncocytomas. BMC Cancer. 9:1522009. View Article : Google Scholar : PubMed/NCBI
|
|
71
|
Hao Y, Triadafilopoulos G, Sahbaie P,
Young HS, Omary MB and Lowe AW: Gene expression profiling reveals
stromal genes expressed in common between Barrett's esophagus and
adenocarcinoma. Gastroenterology. 131:925–933. 2006. View Article : Google Scholar : PubMed/NCBI
|
|
72
|
D'Errico M, de Rinaldis E, Blasi MF, Viti
V, Falchetti M, Calcagnile A, Sera F, Saieva C, Ottini L, Palli D,
et al: Genome-wide expression profile of sporadic gastric cancers
with microsatellite instability. Eur J Cancer. 45:461–469. 2009.
View Article : Google Scholar
|
|
73
|
Wang Q, Wen YG, Li DP, Xia J, Zhou CZ, Yan
DW, Tang HM and Peng ZH: Upregulated INHBA expression is associated
with poor survival in gastric cancer. Med Oncol. 29:77–83. 2012.
View Article : Google Scholar : PubMed/NCBI
|
|
74
|
Cui JA, Chen YB, Chou WC, Sun L, Chen L,
Suo J, Ni Z, Zhang M, Kong X, Hoffman LL, et al: An integrated
transcriptomic and computational analysis for biomarker
identification in gastric cancer. Nucleic Acids Res. 39:1197–1207.
2011. View Article : Google Scholar : PubMed/NCBI
|
|
75
|
Dyrskjøt L, Kruhøffer M, Thykjaer T,
Marcussen N, Jensen JL, Møller K and Ørntoft TF: Gene expression in
the urinary bladder: A common carcinoma in situ gene expression
signature exists disregarding histopathological classification.
Cancer Res. 64:4040–4048. 2004. View Article : Google Scholar : PubMed/NCBI
|
|
76
|
Zhao H, Langerød A, Ji Y, Nowels KW,
Nesland JM, Tibshirani R, Bukholm IK, Kåresen R, Botstein D,
Børresen-Dale AL and Jeffrey SS: Different gene expression patterns
in invasive lobular and ductal carcinomas of the breast. Mol Biol
Cell. 15:2523–2536. 2004. View Article : Google Scholar : PubMed/NCBI
|
|
77
|
Sabates-Bellver J, Van der Flier LG, de
Palo M, Cattaneo E, Maake C, Rehrauer H, Laczko E, Kurowski MA,
Bujnicki JM, Menigatti M, et al: Transcriptome profile of human
colorectal adenomas. Mol Cancer Res. 5:1263–1275. 2007. View Article : Google Scholar : PubMed/NCBI
|
|
78
|
Haqq C, Nosrati M, Sudilovsky D, Crothers
J, Khodabakhsh D, Pulliam BL, Federman S, Miller JR III, Allen RE,
Singer MI, et al: The gene expression signatures of melanoma
progression. Proc Natl Acad Sci USA. 102:6092–6097. 2005.
View Article : Google Scholar : PubMed/NCBI
|
|
79
|
Talantov D, Mazumder A, Yu JX, Briggs T,
Jiang Y, Backus J, Atkins D and Wang Y: Novel genes associated with
malignant melanoma but not benign melanocytic lesions. Clin Cancer
Res. 11:7234–7242. 2005. View Article : Google Scholar : PubMed/NCBI
|
|
80
|
Riker AI, Enkemann SA, Fodstad O, Liu S,
Ren S, Morris C, Xi Y, Howell P, Metge B, Samant RS, et al: The
gene expression profiles of primary and metastatic melanoma yields
a transition point of tumor progression and metastasis. Bmc Med
Genomics. 1:132008. View Article : Google Scholar : PubMed/NCBI
|
|
81
|
Curtis C, Shah SP, Chin SF, Turashvili G,
Rueda OM, Dunning MJ, Speed D, Lynch AG, Samarajiwa S, Yuan Y, et
al: The genomic and transcriptomic architecture of 2,000 breast
tumours reveals novel subgroups. Nature. 486:346–352.
2012.PubMed/NCBI
|
|
82
|
Finak G, Bertos N, Pepin F, Sadekova S,
Souleimanova M, Zhao H, Chen H, Omeroglu G, Meterissian S, Omeroglu
A, et al: Stromal gene expression predicts clinical outcome in
breast cancer. Nat Med. 14:518–527. 2008. View Article : Google Scholar : PubMed/NCBI
|
|
83
|
Radvanyi L, Singh-Sandhu D, Gallichan S,
Lovitt C, Pedyczak A, Mallo G, Gish K, Kwok K, Hanna W, Zubovits J,
et al: The gene associated with trichorhinophalangeal syndrome in
humans is overexpressed in breast cancer. Proc Natl Acad Sci USA.
102:11005–11010. 2005. View Article : Google Scholar : PubMed/NCBI
|
|
84
|
Gaedcke J, Grade M, Jung K, Camps J, Jo P,
Emons G, Gehoff A, Sax U, Schirmer M, Becker H, et al: Mutated KRAS
results in overexpression of DUSP4, a MAP-kinase phosphatase and
SMYD3, a histone methyltransferase, in rectal carcinomas. Genes
Chrom Cancer. 49:1024–1034. 2010. View Article : Google Scholar : PubMed/NCBI
|
|
85
|
Kaiser S, Park YK, Franklin JL, Halberg
RB, Yu M, Jessen WJ, Freudenberg J, Chen X, Haigis K, Jegga AG, et
al: Transcriptional recapitulation and subversion of embryonic
colon development by mouse colon tumor models and human colon
cancer. Genome Biol. 8:R1312007. View Article : Google Scholar : PubMed/NCBI
|
|
86
|
Hong Y, Downey T, Eu KW, Koh PK and Cheah
PY: A ‘metastasis-prone’ signature for early-stage mismatch-repair
proficient sporadic colorectal cancer patients and its implications
for possible therapeutics. Clin Exp Metastasis. 27:83–90. 2010.
View Article : Google Scholar : PubMed/NCBI
|
|
87
|
Skrzypczak M, Goryca K, Rubel T, Paziewska
A, Mikula M, Jarosz D, Pachlewski J, Oledzki J and Ostrowski J:
Modeling oncogenic signaling in colon tumors by multidirectional
analyses of microarray data directed for maximization of analytical
reliability. PLoS One. 5:e130912010. View Article : Google Scholar : PubMed/NCBI
|
|
88
|
Hou J, Aerts J, den Hamer B, van Ijcken W,
den Bakker M, Riegman P, van der Leest C, van der Spek P, Foekens
JA, Hoogsteden HC, et al: Gene expression-based classification of
non-small cell lung carcinomas and survival prediction. Plos One.
5:e103122010. View Article : Google Scholar : PubMed/NCBI
|
|
89
|
Brune V, Tiacci E, Pfeil I, Döring C,
Eckerle S, van Noesel CJ, Klapper W, Falini B, von Heydebreck A,
Metzler D, et al: Origin and pathogenesis of nodular
lymphocyte-predominant Hodgkin lymphoma as revealed by global gene
expression analysis. J Exp Med. 205:2251–2268. 2008. View Article : Google Scholar : PubMed/NCBI
|
|
90
|
Sengupta S, den Boon JA, Chen IH, Newton
MA, Dahl DB, Chen M, Cheng YJ, Westra WH, Chen CJ, Hildesheim A, et
al: Genome-wide expression profiling reveals EBV-associated
inhibition of MHC class I expression in nasopharyngeal carcinoma.
Cancer Res. 66:7999–8006. 2006. View Article : Google Scholar : PubMed/NCBI
|
|
91
|
Lu KH, Patterson AP, Wang L, Marquez RT,
Atkinson EN, Baggerly KA, Ramoth LR, Rosen DG, Liu J, Hellstrom I,
et al: Selection of potential markers for epithelial ovarian cancer
with gene expression arrays and recursive descent partition
analysis. Clin Cancer Res. 10:3291–3300. 2004. View Article : Google Scholar : PubMed/NCBI
|
|
92
|
Skotheim RI, Lind GE, Monni O, Nesland JM,
Abeler VM, Fosså SD, Duale N, Brunborg G, Kallioniemi O, Andrews PW
and Lothe RA: Differentiation of human embryonal carcinomas in
vitro and in vivo reveals expression profiles relevant to normal
development. Cancer Res. 65:5588–5598. 2005. View Article : Google Scholar : PubMed/NCBI
|
|
93
|
Arredouani MS, Lu B, Bhasin M, Eljanne M,
Yue W, Mosquera JM, Bubley GJ, Li V, Rubin MA, Libermann TA and
Sanda MG: Identification of the transcription factor single-minded
homologue 2 as a potential biomarker and immunotherapy target in
prostate cancer. Clin Cancer Res. 15:5794–5802. 2009. View Article : Google Scholar : PubMed/NCBI
|
|
94
|
Turashvili G, Bouchal J, Baumforth K, Wei
W, Dziechciarkova M, Ehrmann J, Klein J, Fridman E, Skarda J,
Srovnal J, et al: Novel markers for differentiation of lobular and
ductal invasive breast carcinomas by laser microdissection and
microarray analysis. BMC Cancer. 7:552007. View Article : Google Scholar : PubMed/NCBI
|
|
95
|
Jones J, Otu H, Spentzos D, Kolia S, Inan
M, Beecken WD, Fellbaum C, Gu X, Joseph M, Pantuck AJ, et al: Gene
signatures of progression and metastasis in renal cell cancer. Clin
Cancer Res. 11:5730–5739. 2005. View Article : Google Scholar : PubMed/NCBI
|
|
96
|
Pyeon D, Newton NA, Lambert PF, den Boon
JA, Sengupta S, Marsit CJ, Woodworth CD, Connor JP, Haugen TH,
Smith EM, et al: Fundamental differences in cell cycle deregulation
in human papillomavirus-positive and human papillomavirus-negative
head/neck and cervical cancers. Cancer Res. 67:4605–4619. 2007.
View Article : Google Scholar : PubMed/NCBI
|
|
97
|
Piccaluga PP, Agostinelli C, Califano A,
Rossi M, Basso K, Zupo S, Went P, Klein U, Zinzani PL, Baccarani M,
et al: Gene expression analysis of peripheral T cell lymphoma,
unspecified, reveals distinct profiles and new potential
therapeutic targets. J Clin Invest. 117:823–834. 2007. View Article : Google Scholar : PubMed/NCBI
|
|
98
|
Cancer Genome Atlas Network, .
Comprehensive molecular characterization of human colon and rectal
cancer. Nature. 487:330–337. 2012. View Article : Google Scholar : PubMed/NCBI
|