Introduction
Dysregulated epigenetic processes play a critical
role in cancer onset and progression. In contrast to DNA mutations,
epigenetic modifications are reversible, thus suitable for
pharmacological interventions. Lysine-specific demethylase 1
(LSD1), also known as KDM1A or AOF2, specifically remove the methyl
group from mono and demethylated histone H3 at lysine 4 (1) or lysine 9 (2). Overexpression of LSD1 is observed in
many types of cancer including prostate cancer (3,4), ovarian
cancer (5), breast cancer (6), esophageal squamous cancer (7), colorectal cancer (8), acute myeloid leukemia (9) and small cell lung cancer (10) and is associated with the poor survival
rate of cancer patients. Machinery by which LSD1 regulates cancer
progression has been widely investigated. LSD1 was found to sustain
the leukemogenic potential of MLL-AF9 leukemia stem cells (11). LSD1 was also found to inhibit the
expression of myeloid differentiation-associated genes that
decreased the differentiation of leukemia cells, and LSD1
inhibition reactivated the ATRA (all-trans-retinoic acid)
differentiation pathway in acute myeloid leukemia (AML), thus
sensitizing AML cells to ATRA (9). In
addition to leukemia, a number of studies have demonstrated the
important role of LSD1 in solid tumors. LSD1 specifically interacts
with the androgen receptor (2), the
estrogen receptor (12) or large
chromatin-modifying corepressor complexes (13,14), and
regulates prostate cancer (15).
Although these studies reveal roles for LSD1 in solid tumors, the
underlying epigenetic mechanism is still poorly understood.
Cancer cells undergo extensive metabolic
reprogramming to sustain tumor growth. In addition to well-known
glycolysis and glutamine metabolism, lipid metabolism has attracted
great interest in tumorigenesis. Lipids form a diverse group of
water-insoluble biomolecules that include triacylglycerides,
glycerophospholipids, SPs, sterols and others. There is increasing
evidence that lipids play critical roles in tumorigenesis and
progression, especially as second messengers or hormones in
signaling (16). Changes in lipid
metabolism affect many cancer cell processes, including cell
growth, proliferation, motility, autophagy (17) and apoptosis (18). Therefore, the study of lipid
metabolism is of great significance to elucidate the pathogenesis
of tumors and to discover effective therapeutic targets for tumors.
Among the different types of lipids, SPs regulate various
biological processes by controlling the signaling functions of
cancer cell signal transduction network (19,20). Cer
and sphingosine are two bioactive SPs which are produced through
three main pathways, including the de novo synthesis
pathway, SM hydrolysis and the salvage pathway under cellular
stress (19,21). Their decreases are associated with
tumorigenesis and progression. Under the treatment of chemotherapy,
radiation and oxidative stress, the levels of Cer and sphingosine
are induced which then mediate cell death, senescence and cell
cycle arrest (22). In contrast, high
levels of sphingosine-1-phosphate (S1P), SM and glucosylceramide
which are members of the SPs possess anti-apoptotic roles (23,24).
Although the above-mentioned studies indicate the critical
characters of SPs in cancer cells, lipid metabolic contributions to
cancer cell epigenetic alterations are largely unknown. LSD1 is
implicated in cancer cell metabolism and may regulate glycolytic
and mitochondrial metabolism in hepatocellular carcinoma (HCC)
cells (25) and esophageal cancer
(26). However, few studies have
investigated the impact of LSD1 in the lipidomic profiling of
cancer cells, and the lipidome remodeling of cancer cells regulated
by LSD1 remain largely elusive.
Lipidomics was recently developed to study the total
lipid composition of a body. With more than 180,000 different
molecular species, lipids form a vast class of biomolecules, and
all of these lipids possess a unique chemical structure and
biological activities. Recent advances in technologies such as
spectroscopy, chromatography and most importantly in MS (mass
spectrometry) make lipidomics a mature field such as genomics,
transcriptomics, proteomics and metabolomics. Recently, the
application of LC/MS-MS (liquid chromatography-tandem mass
spectrometry) facilitates the precise profiling of lipid species
even including those low abundance lipid classes (27). The analysis of lipid profiling in
cancer cells provides an unbiased method by which to fully
understand the mechanism of cancer inhibitors, meanwhile providing
a benefit to lipid biomarker development.
In the present study, we performed an
ultra-performance liquid chromatography (UPLC) ESI-Q-TOF-MS
(electrospray ionization quadrupole time of flight mass
spectrometry)-based lipidomics approach to investigate the LSD1
medicated lipid profiling in human cancer cells. ZY0511, a novel,
potent selective LSD1 inhibitor with a half maximal inhibitory
concentration (IC50) value of 1.7 nM, which was
previously developed by our group, was used as a specific LSD1
probe (28). Our research indicated
that LSD1 inhibitor ZY0511 modified the lipidome of cancer cells
especially the level of sphingolipids Cer and SM which indicates a
critical role of LSD1 in lipid metabolism. These findings promote a
better understanding of the correlation between LSD1 and lipid
metabolism in cancer.
Materials and methods
Preparation and enzyme activity
detection of ZY0511
ZY0511 [chemical name:
(E)-N′-(2,3-dihydro-1H-inden-1-ylidene) benzohydrazides] was
synthesized at the State Key Laboratory of Biotherapy, Sichuan
University (Sichuan, China) and was purified to >99% purity as
determined by high performance liquid chromatography (HPLC). Its
structural formula is shown in a previous study (28). For in vitro assays, ZY0511 was
dissolved in DMSO for which the final concentration was no more
than 0.1% (v/v) after addition to the cells. The detection of
enzyme activity of ZY0511 was also performed as described in a
previous study (28).
Cell culture and reagents
HeLa (human cervical cancer cell line) and HCT116
(human colorectal cancer cell line) were purchased from the
American Type Culture Collection (ATCC). Cells were maintained in
RPMI-1640 media or DMEM media (Gibco; Thermo Fisher Scientific,
Inc.) supplemented with 10% fetal bovine serum (FBS) (Hyclone; GE
Healthcare), 100 U ml−1 penicillin (Sigma-Aldrich; Merck
KGaA) and 100 µg ml−1 streptomycin (Sigma-Aldrich; Merck
KGaA) at 37°C in a humidified atmosphere containing 5%
CO2. All cancer cell lines were maintained according to
ATCC recommended procedures.
Sample preparation and extraction
HeLa and HCT116 cells were treated with 2 µM ZY0511
for 48 h. Sample extraction process was according to the Folch
method (29). Briefly, cells were
collected and washed with cold PBS, then 300 µl chloroform was
added, followed by being vortexed for 10 sec. Then, 150 µl methyl
alcohol was added, and the samples were vortexed for 15–20 min at
4°C. Finally, 135 µl 0.9% NaCl solution was added, followed by
centrifugation for 1,500 × g for 3 min. This procedure separated
the suspension into three phases: A water phase at the top, a
denatured protein phase in the middle, and a lipid phase at the
bottom. The lipid phase of each sample was collected and evaporated
to dryness under a stream of nitrogen, and then frozen at −80°C for
further study.
UPLC/Q-TOF-MS
Individual MS was run for ‘each’ cell homogenate in
the study. Each experiment was repeated 6 times independently and
the samples were not pooled. The dried lipid samples were
reconstituted with acetonitrile:isopropanol (7:3, v/v) solution
(300 µl per mg of lipids), followed by ultrasonicated and
centrifuged at 14,000 × g for 10 min. The 100 µl supernatant was
transferred to insert pipes (Agilent Technologies, Inc.), and then
separated by an ACQUITY UPLC (Waters Ltd.) and analyzed by
ESI-Q-TOF-MS (Waters Ltd.). The injection volume was 3 µl, and the
column which was used for separation was ACQUITY UPLC HSS T3 column
(1.8 µm, 2.1×100 mm; Waters Ltd.) and the work temperature was
55°C. The mobile phase A was acetonitrile:water (4:6, v/v) with 5
mM ammonium acetate added. The mobile phase B was isopropanol:water
(9:1, v/v) with 5 mM ammonium acetate added. The flow rate of the
mobile phase was 0.4 ml/min. A linear gradient was used as follows:
40–70% B at 0–3 min, 70–95% B at 3–14 min, 95% B at 14–15.5 min.
The column was equilibrated for 3.5 min before injection, giving a
total run time of 20 min.
At the end of the ultra-high liquid phase
separation, the MS was operated in the positive and negative
ionization modes, respectively. The capillary voltage was 2.5 kV
and the sample cone voltage was 30 V in positive ionization modes.
The capillary voltage was 2.5 kV and the sample cone voltage was
−25 V in negative ionization modes. The source temperature was
120°C, the desolation gas flow was 800 liters/h, and the cone gas
flow was 20 liters/h. The mass of 50–1,200 (m/z) was acquisition
under altering full scan and all ion fragmentation scan mode. A
lock spray was required for analyses to ensure accuracy. Under the
positive ion mode, the accurate [M + H]+ was 556.2771,
while the negative ion mode, the accurate [M + H]− was
554.2615. The data were collected in the continuous mode using
MassLynx (version 1.0; Waters Ltd.).
Data processing
The original data collected from MS were imported
with Progenesis QI software (version 2.0; Waters) to align, match
and correct peaks. Then peaks were picked and lipids metabolites
were identified by referring to the Human Metabolome Database
(www.hmdb.ca) and the Lipid Maps Database
(www.lipidmaps.org). The score of mass
error, fragment and isotope similarity help identify the lipids in
the Progenesis QI software. Then data sheets from the Progenesis QI
software were obtained and absolute intensities of all identified
compounds were recalculated to the relative abundances of the lipid
molecules. After that, the data were exported to EZinfo software
(version 2.0; Umetrics), and data analysis was performed to obtain
group clusters such as unsupervised principal components analysis
(PCA) and supervised orthogonal partial least squares discriminant
analysis (OPLS-DA). The variable importance (VIP >1) was
obtained from EZinfo software and P<0.05 (Student's t-test) of
each identified metabolite was obtained from Progenesis QI to
estimate the significance of the changes in the metabolites between
the control and treated group. Volcano plot and pathway analysis
were performed by MetaboAnalyst (http://www.metaboanalyst.ca) which is an online
metabolomic analysis software.
Real-time quantitative PCR
RNA was extracted using Total Miniprep kit (Axygen).
cDNA was synthesized using SuperScript IV Reverse Transcriptase
(Thermo Fisher Scientific, Inc.). The amount of cDNA was then
quantified by the Bio-Rad CFX Real-Time PCR detection system using
SYBR Green SuperMix (Bio-Rad, Inc.) and the primer sequences are
listed in Table I. All samples were
tested in triplicate and expression levels were normalized to
β-actin mRNA. The reaction process was as follows: Initial
denaturation: 95°C, 30 sec; denaturation: 95°C, 5 sec; annealing
and elongation: 60°C, 20 sec; cycles: 40. The expression was
calculated with the comparative method (2−ΔΔCq)
(30).
 | Table I.Primer sequences of qPCR. |
Table I.
Primer sequences of qPCR.
| Name | Forward | Reverse |
|---|
| SPTLC1 |
CAGTGCTATTCCTGCTTACTCT |
TTCTTTTAGTAGTCGCTCGAGG |
| SPTLC3 |
CGTGGATTATTTACGGGTTCAC |
CAGAGGAACAACAGAAGCATTC |
| CERS2 |
GGAGTCAGCCAAGATGTTTAAC |
CCAGTCGGGTGATGATAAAAAC |
| CERS4 |
CAGTTTCAACGAGTGGTTTTGG |
CAGGCCAATGAATCTCTCAAAG |
| CERS5 |
CTTCGAGCGATTTATTGCCAAA |
CTCCAGCCTTTTCTTATCAGGA |
| CERS6 |
AAGACGCAATCAGGAGAAGCCAAG |
AGCAATGCCTCGTATTCCACAACC |
| DEGS1 |
GGAGCTGATGGCGTCGATGTAG |
AAGTGACCTGTGCCACGGTATTG |
| DEGS2 |
CAGCCCTTCTTCTACTCACTAC |
ATAGTAGGAGTAGGTCTCGTGG |
| SGPL1 |
CGTGATTTTGACATCTACCGAC |
TGGTCTTCGCTTTAGGATTCTT |
| SGPP1 |
CTGGTGTTCTCTAGTTTGCCTA |
GTGAGTTTGGTTGAAGTTGTCA |
| SMPD1 |
ATCTGGAAGGCAAAGGTGTG |
CAGAGGCAGAGCAGAGGAAC |
| SMPD2 |
CAAGGTGAGGACTTGCCTGT |
ACCATTGTGTTGCCTTCCTC |
| SMPD3 |
AGTCACCCAAGCCACATTTC |
GCAGCAACTGTCCAACAGAA |
| SMPD4 |
TTCGCTTGAGTCTGGGAGTT |
CCCAACTAGCGGGAACTACA |
| ENPP7 |
CTCAGGATATGCAGCGAACA |
CTTCTTTGCCATCACAAGCA |
| β-actin |
CATGTACGTTGCTATCCAGGC |
CTCCTTAATGTCACGCACGAT |
Gene correlation analysis
UCSC Xena (http://xena.ucsc.edu/) is an open database which is
used to explore and download The Cancer Genome Atlas (TCGA
datasets) (31). The gene expression
RNAseq data (IlluminaHiSeq) of all cervical squamous cell carcinoma
and endocervical adenocarcinoma (CESC) and colon adenocarcinoma
(COAD) clinical samples collected by TCGA were downloaded from UCSC
Xena. Then gene correlation analysis including Pearson analysis and
statistical analysis of all clinical samples was carried out by
GraphPad Prism 8.0.1 (GraphPad Software, Inc.).
Statistical analysis
All data are represented as means ± SD as indicated
in the figure legends. Comparisons between two groups such as the
control group and the treated group were analyzed using unpaired,
two tailed t-test. P-value <0.05 was considered indicative of
statistical significance. The Pearson's correlation test was used
to investigate the correlation between gene expression. GraphPad
Prism 8.0.1 was used for statistical analysis.
Results
Orthogonal projections to latent
structures discriminant analysis (OPLS-DA) model
We previously found that ZY0511 possessed strong
LSD1 inhibition activity, and markedly inhibited human cancer cell
growth (28,32). In previous research, we explored the
anti-proliferative activity of ZY0511 for long-term treatment such
as 72 and 96 h and the growth of cancer cells was inhibited. Thus,
we collected the lipids of cancer cells for the 48 h treatment and
ZY0511 was used as a specific probe to explore the role of LSD1 in
cancer lipid metabolism. The OPLS-DA model was performed to analyze
the metabolite differences after ZY0511 treatment. The results
showed a clear differentiation between the control groups and the
ZY0511-treated groups in the two cell lines (Fig. 1). Both the Q2 and
R2 values of the two cell line models were >0.5 in
the positive and negative ion modes [(A) HeLa pos and (B) HeLa neg;
(D) HCT116 pos and (E) HCT116 neg] which indicated the good
prediction abilities of these two models.
Meanwhile, the original data were transported to
online MetaboAnalyst software to obtain volcano spots of these two
cell line models. As shown in Fig. 1C and
F, important features were selected by volcano spots with fold
change >2 and P<0.05 (the dotted lines in Fig. 1C and F represent the thresholds). All
of these results indicate that the ZY0511 treatment significantly
modified the lipid profile in these cancer cell lines.
ZY0511 treatment modifies the lipidome
of cancer cells
Lipidomic profiles in the HeLa and HCT116 cells were
significantly altered by ZY0511 treatment for 48 h. The
distinguished lipid metabolites in these two cell line models,
which satisfied VIP >1 and P<0.05, are summarized by class
(Fig. 2,Fig. 3,4). The
top metabolites with a fold-change in the cancer cells are shown in
Tables II and III. As glycerophospholipids (GLs) and SPs
are the main types of lipids in cells and are correlated with many
biological processes, we primarily focused on the change in these
two types of lipid metabolites.
 | Figure 2.Comparative GL profile expression in
the HeLa model. Heatmap display of unsupervised hierarchical
clustering of altered lipids in GLs including (A) PS, (B) PC, (C)
PE, (D) PI, (E) PG and (F) PA (n=6). Data are normalized by the
mean value of each group. VIP >1 and P<0.05 are required for
all displayed features. Statistical analysis for individual lipid
species data is based on the unpaired two-tailed Student t-test.
GL, glycerophospholipid; PS, phosphatidylserine; PC,
phosphatidylcholine; PE, phosphatidylethanolamine; PI,
phosphatidylinositol; PG, phosphatidylglycerol; PA, phosphatidic
acid. |
 | Figure 4.Comparative SP profile expression in
the HeLa and HCT116 models. Heatmap display of unsupervised
hierarchical clustering of altered lipids in SPs including (A) Cer,
CerP, GluCer and LacCer in the HeLa model (n=6), (B) SM in the HeLa
model (n=6), (C) Cer, CerP, GluCer and LacCer in the HCT116 model
(control group: n=5; treated group: n=6), and (D) SM in the HCT116
model (control group: n=5; treated group: n=6). Data are normalized
by the mean value of each group. VIP >1 and P<0.05 are
required for all displayed features. Statistical analysis for
individual lipid species data are based on the unpaired two-tailed
Student t-test. SP, sphingolipid; Cer, ceramide; CerP, ceramide
phosphate; GluCer, glucosylceramide; LacCer, lactosylceramide; SM,
sphingomyelin. |
| Table II.The top metabolites with fold-change
in the HeLa cell model following ZY0511 treatment. |
Table II.
The top metabolites with fold-change
in the HeLa cell model following ZY0511 treatment.
| Compound ID | Compound | P-value | Log10p | Score | Isotope
similarity | m/z | Retention time
(min) | log2 (FC) |
|---|
| HMDB02421 | 7-Sulfocholic
acid | 1.64E-15 | 14.79 | 55.60 | 87.14 | 487.24 | 3.88 | 17.11 |
| LMFA08020108 | N-oleoyl
threonine | 2.72E-06 | 5.57 | 39.80 | 77.53 | 767.62 | 8.45 | 11.78 |
| LMGP04050033 | PG(17:0/0:0) | 2.18E-06 | 5.66 | 41.10 | 91.83 | 543.29 | 2.27 | 7.03 |
| HMDB11767 |
Cer(d18:0/23:0) | 6.56E-04 | 3.18 | 40.10 | 64.14 | 682.63 | 7.97 | 5.72 |
| HMDB04957 | Cer
(d18:1/25:0) | 9.29E-03 | 2.03 | 43.90 | 88.51 | 708.65 | 7.96 | 5.52 |
| LMGL02010311 | DG(16:0/0:0/16:0)
(d5) | 1.42E-09 | 8.85 | 38.90 | 95.94 | 591.57 | 12.76 | 5.12 |
| HMDB11146 |
DG(16:0e/18:0/0:0) | 7.94E-08 | 7.10 | 42.40 | 95.25 | 605.55 | 12.02 | 4.94 |
| LMGP10020071 |
PA(O-20:0/22:0) | 4.88E-08 | 7.31 | 36.50 | 82.39 | 773.65 | 7.20 | 4.86 |
| HMDB07166 |
DG(18:0/20:1(11Z)/0:0) | 7.14E-08 | 7.15 | 52.80 | 95.97 | 633.58 | 12.51 | 4.80 |
| LMGP04050008 | PG(16:0/0:0) | 1.34E-02 | 1.87 | 46.70 | 93.26 | 507.27 | 2.08 | 4.74 |
| LMFA08020128 | N-oleoyl
glutamine | 5.33E-05 | 4.27 | 41.90 | 97.97 | 409.31 | 4.49 | 4.47 |
| LMGL03011253 |
TG(18:0/20:3(8Z,11Z,14Z)/21:0)[iso6] | 5.08E-09 | 8.29 | 36.10 | 72.93 | 977.85 | 12.12 | 4.30 |
| HMDB11636 | Salicyl CoA | 1.06E-02 | 1.97 | 35.90 | 85.83 | 903.20 | 11.55 | 4.15 |
| LMGP10010598 |
PA(20:3(8Z,11Z,14Z)/18:0) | 4.13E-02 | 1.38 | 37.20 | 88.84 | 771.51 | 4.12 | 4.13 |
| HMDB07156 |
DG(18:0/16:0/0:0) | 2.57E-08 | 7.59 | 40.60 | 99.36 | 619.53 | 7.07 | 4.11 |
| HMDB07187 |
DG(18:1(11Z)/18:0/0:0) | 2.01E-08 | 7.70 | 43.10 | 97.28 | 605.55 | 12.02 | 4.02 |
| LMFA01020381 | 17:4(2E,4E,9E,11E)
(8Me[R],10Me,15Me[R]) | 4.50E-02 | 1.35 | 58.60 | 99.76 | 303.23 | 2.34 | 3.96 |
| HMDB44730 |
TG(18:0/16:0/20:1(11Z)) | 5.20E-08 | 7.28 | 49.70 | 96.38 | 906.85 | 12.49 | 3.88 |
| HMDB11769 |
Cer(d18:0/24:1(15Z)) | 5.09E-11 | 10.29 | 40.00 | 95.73 | 650.65 | 7.43 | 3.79 |
| HMDB43920 |
TG(16:0/18:0/18:1(11Z)) | 1.09E-07 | 6.96 | 53.40 | 96.63 | 878.82 | 11.99 | 3.66 |
| HMDB44569 |
TG(16:0/20:5(5Z,8Z,11Z,14Z,17Z)/24:1(15Z)) | 2.59E-07 | 6.59 | 41.30 | 90.86 | 980.86 | 11.92 | 3.55 |
| HMDB07098 |
DG(16:0/16:0/0:0) | 9.62E-10 | 9.02 | 46.10 | 98.60 | 551.50 | 11.45 | 3.55 |
| HMDB56138 |
DG(14:1n5/0:0/20:1n9) | 5.88E-08 | 7.23 | 38.30 | 91.85 | 575.50 | 4.65 | 3.52 |
| HMDB07129 |
DG(16:1(9Z)/18:0/0:0) | 3.94E-08 | 7.40 | 38.80 | 96.57 | 617.51 | 6.41 | 3.51 |
| LMGP10010881 |
PA(18:1(9Z)/16:1(9Z)) | 5.33E-08 | 7.27 | 33.90 | 65.36 | 671.46 | 5.09 | −3.22 |
| LMGP02010655 |
PE(18:2(9Z,12Z)/14:0) | 2.00E-05 | 4.70 | 36.70 | 87.20 | 686.47 | 4.49 | −3.25 |
| HMDB12097 | SM(d18:1/14:0) | 6.71E-09 | 8.17 | 54.30 | 93.88 | 675.54 | 3.93 | −3.29 |
| HMDB08834 |
PE(14:0/20:1(11Z)) | 2.01E-05 | 4.70 | 39.50 | 90.78 | 700.53 | 5.03 | −3.39 |
| HMDB60423 |
7,8-Dihydro-7-hydroxy-8-S-glutathionyl-benzo[a]pyrene | 3.97E-02 | 1.40 | 30.50 | 58.63 | 1151.36 | 5.17 | −3.41 |
| HMDB07934 | PC(15:0/15:0) | 8.42E-09 | 8.07 | 41.50 | 98.34 | 706.54 | 4.52 | −3.44 |
| HMDB07182 |
DG(18:1(11Z)/14:0/0:0) | 1.86E-08 | 7.73 | 38.90 | 97.33 | 549.49 | 4.58 | −3.45 |
| HMDB07103 |
DG(16:0/18:2(9Z,12Z)/0:0) | 7.83E-09 | 8.11 | 40.70 | 95.09 | 615.50 | 5.82 | −3.67 |
| LMGP01010459 | PC(13:0/15:0) | 1.73E-09 | 8.76 | 40.10 | 91.34 | 678.51 | 4.01 | −3.78 |
| HMDB08002 |
PC(16:1(9Z)/16:1(9Z)) | 1.09E-09 | 8.96 | 48.60 | 91.11 | 730.54 | 4.20 | −4.20 |
| HMDB07998 |
PC(16:1(9Z)/14:0) | 1.17E-09 | 8.93 | 36.00 | 82.85 | 702.51 | 4.77 | −4.41 |
| HMDB07932 | PC(15:0/14:0) | 6.97E-10 | 9.16 | 37.30 | 84.39 | 690.51 | 5.41 | −4.43 |
| LMGP02010047 |
PE(18:3(9Z,12Z,15Z)/16:0) | 9.49E-03 | 2.02 | 35.40 | 84.44 | 714.51 | 4.28 | −4.79 |
| HMDB08828 |
PE(14:0/18:1(9Z)) | 4.39E-06 | 5.36 | 42.20 | 69.24 | 688.50 | 4.93 | −4.84 |
| LMGP03010607 |
PS(20:3(8Z,11Z,14Z)/19: 1(9Z)) | 1.12E-02 | 1.95 | 40.10 | 96.80 | 870.55 | 4.55 | −5.02 |
| HMDB04884 | Trihexosylceramide
(d18:1/26:1(17Z)) | 9.62E-07 | 6.02 | 32.90 | 66.67 | 1146.82 | 4.69 | −12.62 |
| Table III.The top metabolites with fold-change
in the HCT116 cell model following ZY0511 treatment. |
Table III.
The top metabolites with fold-change
in the HCT116 cell model following ZY0511 treatment.
| Compound ID | Compound | P-value | Log10p | Score | Isotope
similarity | m/z | Retention time
(min) | Log2 FC |
|---|
| HMDB59643 |
3-Beta-hydroxy-4-beta-methyl-5-alpha-cholest-7-ene-4-alpha-carbaldehyde | 2.05E-09 | 8.69 | 44.40 | 86.16 | 429.38 | 2.39 | 3.35 |
| HMDB13407 |
PC(o-16:0/20:4(8Z,11Z,14Z,17Z)) | 3.50E-05 | 4.46 | 36.40 | 83.61 | 790.57 | 4.94 | 1.97 |
| HMDB08048 |
PC(18:0/20:4(5Z,8Z,11Z,14Z)) | 2.19E-06 | 5.66 | 51.50 | 82.44 | 832.58 | 5.21 | 1.85 |
| HMDB04973 | Glucosylceramide
(d18:1/20:0) | 3.45E-06 | 5.46 | 36.50 | 89.03 | 736.61 | 4.52 | 1.80 |
| HMDB59637 |
3-(3,5-Diiodo-4-hydroxyphenyl)
pyruvate | 4.09E-05 | 4.39 | 34.90 | 81.79 | 862.67 | 5.94 | 1.77 |
| HMDB08237 |
PC(18:4(6Z,9Z,12Z,15Z)/18:2(9Z,12Z)) | 1.85E-06 | 5.73 | 53.90 | 89.65 | 778.54 | 4.26 | −1.78 |
| HMDB08826 | PE(14:0/18:0) | 6.33E-06 | 5.20 | 37.90 | 92.34 | 692.52 | 4.19 | −1.81 |
| LMGP04030076 |
PG(P-20:0/20:1(11Z)) | 9.41E-06 | 5.03 | 37.60 | 89.16 | 815.62 | 3.85 | −1.81 |
| HMDB07780 |
DG(22:6(4Z,7Z,10Z,13Z,16Z,19Z)/20:4(8Z,11Z,14Z,17Z)/0:0) | 5.74E-07 | 6.24 | 36.80 | 89.59 | 706.54 | 4.43 | −1.86 |
| LMGP02030091 |
PE(P-20:0/22:4(7Z,10Z,13Z,16Z)) | 1.27E-06 | 5.90 | 40.70 | 88.83 | 788.59 | 4.47 | −1.89 |
| HMDB10169 | SM(d18:1/16:0) | 4.49E-07 | 6.35 | 38.90 | 94.38 | 702.57 | 4.29 | −1.92 |
| HMDB12095 |
SM(d18:0/24:1(15Z)) | 8.75E-08 | 7.06 | 46.20 | 88.34 | 832.73 | 9.96 | −1.96 |
| HMDB12097 | SM(d18:1/14:0) | 8.88E-07 | 6.05 | 49.50 | 85.30 | 675.54 | 3.85 | −1.98 |
| LMGP03030016 |
PS(P-16:0/19:0) | 3.40E-07 | 6.47 | 39.30 | 89.79 | 744.55 | 4.39 | −2.01 |
| LMFA03010114 | PGE2alpha dimethyl
amine | 3.38E-07 | 6.47 | 27.90 | 45.76 | 733.60 | 3.85 | −2.17 |
| LMGL03014248 |
TG(14:0/16:1(9Z)/17:1(9Z))[iso6] | 1.70E-08 | 7.77 | 45.70 | 89.34 | 806.72 | 9.86 | −2.18 |
| HMDB42819 |
TG(14:0/20:4(8Z,11Z,14Z,17Z)/16:1(9Z)) | 1.98E-07 | 6.70 | 45.20 | 94.08 | 825.69 | 10.18 | −2.19 |
| LMGL03012631 |
TG(12:0/12:0/15:1(9Z))[iso3] | 4.50E-07 | 6.35 | 36.80 | 91.91 | 659.57 | 3.85 | −2.22 |
| LMSP02050006 |
CerP(d18:1/22:0) | 3.63E-08 | 7.44 | 43.00 | 90.34 | 746.57 | 4.67 | −2.28 |
| LMGL03013324 |
TG(12:0/16:0/17:1(9Z))[iso6] | 1.86E-08 | 7.73 | 39.80 | 92.81 | 780.70 | 9.79 | −2.32 |
| HMDB07008 |
DG(14:0/14:0/0:0) | 1.60E-08 | 7.80 | 54.60 | 98.21 | 495.44 | 10.08 | −2.41 |
| LMGL03013217 |
TG(12:0/14:0/18:1(9Z))[iso6] | 7.48E-08 | 7.13 | 51.80 | 96.67 | 766.69 | 9.47 | −2.46 |
| HMDB48568 |
TG(16:1(9Z)/14:1(9Z)/18:1(11Z)) | 1.89E-08 | 7.72 | 53.30 | 85.73 | 818.72 | 9.69 | −2.55 |
| LMGL03013351 |
TG(12:0/16:1(9Z)/18:1(9Z))[iso6] | 2.66E-08 | 7.58 | 53.90 | 87.71 | 792.71 | 9.57 | −2.66 |
| HMDB42061 |
TG(14:0/14:0/14:0) | 1.53E-07 | 6.81 | 36.70 | 87.25 | 740.67 | 9.39 | −2.70 |
| HMDB08002 |
PC(16:1(9Z)/16:1(9Z)) | 4.37E-08 | 7.36 | 54.40 | 90.01 | 730.54 | 4.14 | −2.81 |
| HMDB07016 |
DG(14:0/18:2(9Z,12Z)/0:0) | 1.61E-07 | 6.79 | 51.50 | 92.84 | 547.47 | 9.65 | −2.83 |
| LMGL02010336 |
DG(12:0/18:1(9Z)/0:0)[iso2] | 2.08E-07 | 6.68 | 34.70 | 73.05 | 521.46 | 10.16 | −3.02 |
| HMDB07998 |
PC(16:1(9Z)/14:0) | 4.56E-08 | 7.34 | 56.70 | 94.17 | 704.52 | 4.04 | −3.12 |
| LMGL03013464 |
TG(12:0/18:1(9Z)/18:3(9Z,12Z,15Z))[iso6] | 1.32E-08 | 7.88 | 37.00 | 83.31 | 816.70 | 9.24 | −3.12 |
| LMGL03012619 |
TG(13:0/13:0/13:0) | 1.59E-05 | 4.80 | 33.50 | 71.95 | 661.58 | 4.00 | −3.23 |
| LMGP01011245 | PC(8:0/20:0) | 1.81E-07 | 6.74 | 38.90 | 90.68 | 678.51 | 3.95 | −3.25 |
| HMDB42752 |
TG(14:0/18:3(9Z,12Z,15Z)/15:0) | 1.78E-07 | 6.75 | 51.50 | 81.65 | 804.70 | 9.41 | −3.38 |
| HMDB42271 |
TG(14:0/14:1(9Z)/14:0) | 5.32E-08 | 7.27 | 38.40 | 95.33 | 743.61 | 8.81 | −3.78 |
| LMGL03012665 |
TG(12:0/16:1(9Z)/16:1(9Z))[iso3] | 2.07E-08 | 7.68 | 48.30 | 87.49 | 769.63 | 8.92 | −3.82 |
| LMGL03012632 |
TG(12:0/12:0/16:0)[iso3] | 4.22E-07 | 6.37 | 37.80 | 85.80 | 712.64 | 8.72 | −3.99 |
| HMDB47887 |
TG(14:1(9Z)/14:1(9Z)/18:1(11Z)) | 1.50E-08 | 7.82 | 42.50 | 85.85 | 790.69 | 9.09 | −3.99 |
| HMDB07041 |
DG(14:1(9Z)/16:1(9Z)/0:0) | 1.94E-08 | 7.71 | 44.00 | 91.73 | 519.44 | 9.65 | −4.00 |
| LMGL03013241 |
TG(12:0/14:1(9Z)/16:1(9Z))[iso6] | 1.16E-07 | 6.94 | 41.00 | 81.09 | 741.60 | 8.33 | −4.46 |
| LMGL03013208 |
TG(12:0/14:0/14:1(9Z))[iso6] | 3.42E-06 | 5.47 | 39.30 | 97.98 | 715.58 | 8.13 | −5.24 |
Compared with the control group, ZY0511 treatment
resulted in marked alterations of GLs and SPs. In HeLa cells, most
of the GLs were decreased after ZY0511 treatment (Fig. 2A-C) including phosphatidylserine (PS),
phosphatidylcholine (PC) and phosphatidylethanolamine (PE). PS
upregulation in cancer cells can inhibit the immune response and
promote tumorigenesis (33), which
suggest PS downregulation could benefit tumor inhibition. In
addition, the altered levels of phosphatidylinositol (PI),
phosphatidic acid (PA) and phosphatidylglycerol (PG) were
undetermined (Fig. 2D-F). The levels
of long-chain PIs such as PI (16:0/22:3) and PI (18:0/20:4) were
increased by ZY0511, while the levels of short-chain PIs such as PI
(18:0/18:2) and PI (14:0/22:1) were decreased (Fig. 2D). In addition, the expression of PA
and PG changed randomly independent of the length of chains and
saturability of the lipids. In the HCT116 models, we found that
most of the PSs (Fig. 3A), PGs
(Fig. 3C) and PEs (Fig. 3D) were decreased by ZY0511 treatment,
only a few of the PCs such as PC (16:1/20:3), PC (18:0/18:1) and PC
(18:0/24:4) were increased by ZY0511 treatment (Fig. 3B). Inhibition of PC phospholipase
activity was found to decrease ovarian cancer cell proliferation
(34), which suggest that the
increase of PC expression is closely related to the occurrence of
tumors. As cancer cells are highly proliferating and need plenty of
GLs for its membrane production, the decrease in GLs after ZY0511
treatment may be an important reason for the anti-proliferative
effect of ZY0511 against cancer cells (35).
ZY0511 treatment resulted in marked alterations in
SP metabolism. A significant increase in anti-survival metabolites
Cer and marked decrease in pro-survival metabolites
glucosylceramide (GluCer) and lactosylceramide (LacCer) were
observed in the two cell lines after ZY0511 treatment (Fig. 4A and C). The cellular level of SM was
decreased by ZY0511 (Fig. 4B and D).
These results suggested that the Cer synthesis in the cancer cells
was activated following ZY0511 treatment. The hydrolysis from SM to
Cer may also be promoted by ZY0511 exposure. A high level of Cer
was found to lead to an obvious increase in apoptosis in cancer
such as in leukemic (36) and HeLa
cells (37). The roles of Cer
biogenesis were later revealed which are required for BAX
integration in HeLa cells (37). LSD1
plays an important role in the process of apoptosis (9), the association between LSD1 and
apoptosis may be due to the induction of Cer in cells after LSD1
inhibition.
In conclusion, cellular lipid metabolism was
obviously dysregulated by ZY0511. Most of the GLs including PC, PS
and PE were downregulated in the two cell line models. More
importantly, the levels of bioactive metabolites of SP metabolism
such as Cer and SM were influenced to a great degree which may be a
possible anticancer mechanism of ZY0511.
The lipid metabolism especially SP
metabolism is significantly modified by ZY0511
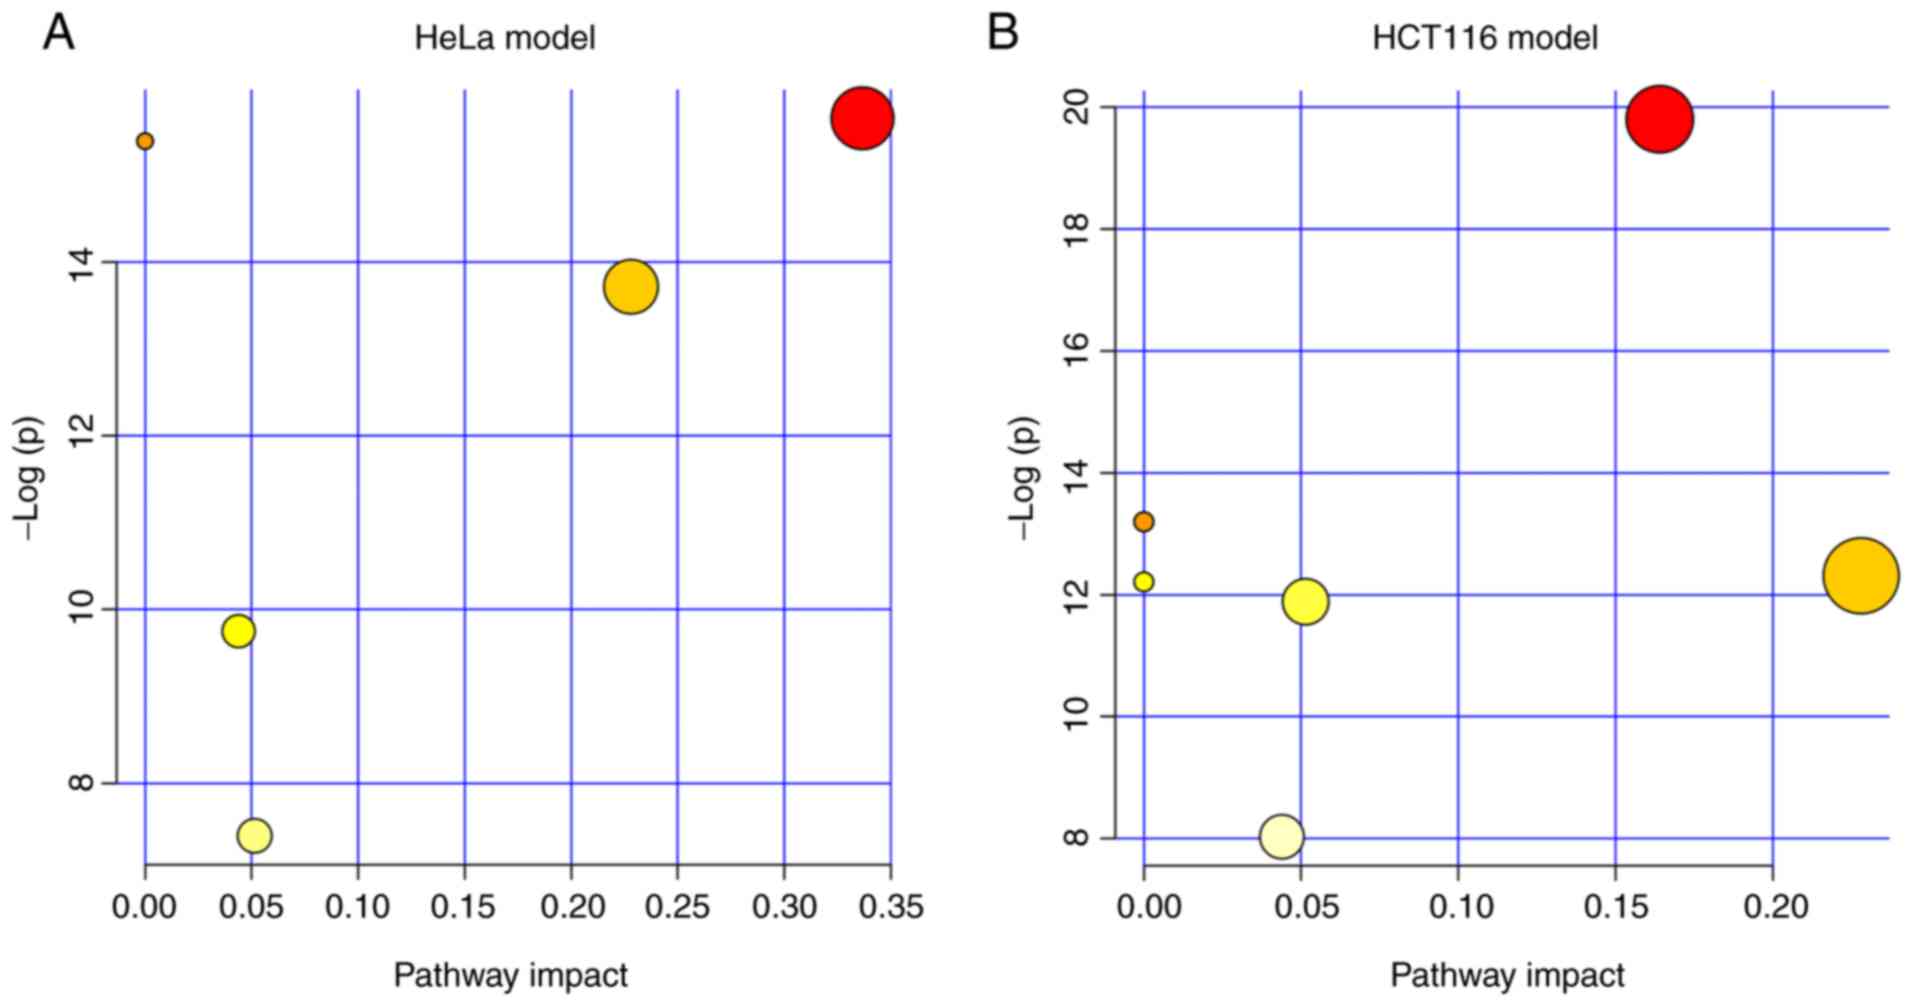
Next, we explored which pathway was markedly
modified by the treatment of ZY0511. We performed pathway
enrichment analysis in MetaboAnalyst. The results showed the lipid
metabolism pathways which were altered by ZY0511 including SP
metabolism, GL metabolism, arachidonic acid metabolism and others.
Among these pathways, SP metabolism was the most dysregulated
pathway under the inhibition of LSD1 by ZY0511 in both cell line
models (Fig. 5A and B). In HeLa
cells, four metabolites including LacCer (d18:1/24:1(15Z)), Cer
(d18:0/24:1), GluCer (d18:1/16:0) and SM (d18:1/26:0) hit the SP
metabolism. In HCT116 cells, GluCer (d18:1/20:0), SM (d18:1/16:0)
and GalCer (d18:1/16:0) hit the sphingolipid metabolism. Among
these, Cer (d18:0/24:1) in HeLa cells was upregulated, while the
other metabolites were downregulated. Interestingly, the detailed
altered SPs were different which may be attributed to different
lipid compositions of these two cell lines.
In addition, we found that the GL metabolism was
also modified by ZY0511. The altered metabolites by ZY0511 such as
PE (14:0/18:0) and PC (22:0/20:0) in the HCT116 cells are members
of the GL metabolism, and these two metabolites were both
downregulated. Meanwhile, in HeLa cells, PE (14:0/18:1(11Z)) and PC
(18:1(9Z)/18:1(9Z)) hit the GL metabolism either which was
obviously downregulated by ZY0511. The detailed information
concerning the pathway analysis of the two cell line models are
summarized in Tables IV and V. The above suggested lipid metabolism
especially SP and GL metabolism were significantly remodeled which
suggests that LSD1 may play a critical role in cancer lipid
metabolism.
| Table IV.Results from the pathway analysis of
the HeLa model. |
Table IV.
Results from the pathway analysis of
the HeLa model.
| Pathways | Total Cmpd | Hits | Raw p | -Log(p) | FDR p | Impact |
|---|
| Sphingolipid
metabolism | 25 | 4 | 1.591E-07 | 15.654 | 3.623E-07 | 0.33667 |
| Arachidonic acid
metabolism | 62 | 1 | 2.070E-07 | 15.391 | 3.623E-07 | 0 |
| Linoleic acid
metabolism | 15 | 1 | 2.070E-07 | 15.391 | 3.623E-07 | 0 |
| α-linolenic acid
metabolism | 29 | 1 | 2.070E-07 | 15.391 | 3.623E-07 | 0 |
| Glycerophospholipid
metabolism | 39 | 2 | 1.106E-06 | 13.715 | 1.548E-06 | 0.22806 |
|
Glycosylphosphatidylinositol (GPI)-anchor
biosynthesis | 14 | 1 | 5.828E-05 | 9.7502 | 6.800E-05 | 0.0439 |
| Glycerolipid
metabolism | 32 | 1 | 6.144E-04 | 7.3948 | 6.144E-04 | 0.05145 |
| Table V.Result from pathway analysis of the
HCT116 model. |
Table V.
Result from pathway analysis of the
HCT116 model.
| Pathways | Total Cmpd | Hits | Raw p | -Log(p) | FDR p | Impact |
|---|
| Sphingolipid
metabolism | 25 | 3 | 2.510E-09 | 19.802 | 2.010E-08 | 0.16404 |
| Arachidonic acid
metabolism | 62 | 1 | 1.860E-06 | 13.196 | 3.710E-06 | 0 |
| Linoleic acid
metabolism | 15 | 1 | 1.860E-06 | 13.196 | 3.710E-06 | 0 |
| α-Linolenic acid
metabolism | 29 | 1 | 1.860E-06 | 13.196 | 3.710E-06 | 0 |
| Glycerophospholipid
metabolism | 39 | 2 | 4.500E-06 | 12.311 | 6.640E-06 | 0.22806 |
| Fatty acid
metabolism | 50 | 1 | 4.980E-06 | 12.211 | 6.640E-06 | 0 |
| Glycerolipid
metabolism | 32 | 1 | 6.890E-06 | 11.885 | 7.880E-06 | 0.05145 |
|
Glycosylphosphatidylinositol (GPI)-anchor
biosynthesis | 14 | 1 | 3.260E-04 | 8.0286 | 3.260E-04 | 0.0439 |
The Cer synthesis process is markedly
induced by ZY0511
In both cell line models, SP metabolism was found to
be the most modified pathway under the exposure of ZY0511 (Fig. 5). Based on the increased level of Cer
and decreased levels of SM and GluCer, we concluded that the Cer
synthesis process was induced by LSD1 inhibition. By qPCR assay, we
detected the expression of key Cer synthesis enzymes including SPTL
(serine palmitoyltransferase), CERS (ceramide synthases), DEGS
(dihydroceramide desaturases) and SMases (sphingomyelinases). We
found that expression of ceramide synthases SPTLC1, SPTLC3, CERS2,
CERS4, CERS5, CERS6, DEGS1 and DEGS2 were markedly increased by
LSD1 inhibition (HeLa-0511 cells compared to HeLa cells and
HCT116-0511 cells compared to HCT116 cells) (Fig. 6). Meanwhile, the hydrolysis of SM was
also enhanced by the treatment of ZY0511 as the expression of
sphingomyelin phosphodiesterase (SMPD1, SMPD2, SMPD3, SMPD4) and
ectonucleotide pyrophosphatase/phosphodiesterase family member 7
(ENPP7) were markedly increased (Fig.
6). These results were consistent with the accumulation of Cer
and the decrease in SM in lipidomic detection.
 | Figure 6.Expression of ceramide synthesis
enzymes. The expression of de novo synthesis enzymes (SPTL1,
SPTL3, CERS2, CERS4, CERS5, CERS6, DEGS1 and DEGS2), hydrolysis of
sphingomyelin enzymes (SMPD1, SMPD2, SMPD3, SMPD4 and ENPP7) and
the salvage pathway enzymes (SGPP1 and SGPL1) were determined after
ZY0511 exposure in HeLa and HCT116 cells (HeLa-0511 cells compared
to HeLa cells and HCT116-0511 cells compared to HCT116 cells).
*P<0.05, **P<0.01, ***P<0.001, based on the unpaired
two-tailed Student t-test. SPTL, serine palmitoyltransferase; CERS,
ceramide synthase; DEGS, dihydroceramide desaturases; SGPP1,
sphingosine-1-phosphate phosphatase 1; SGPL1,
sphingosine-1-phosphate lyase 1; SMPD, sphingomyelin
phosphodiesterase; ENPP7, ectonucleotide
pyrophosphatase/phosphodiesterase family member 7. |
Based on the important roles of SP and S1P in
tumors, the expression of related metabolic genes was evaluated as
well. ZY0511 significantly increased the expression levels of SGPL1
and SGPP1 which catalyze sphingosine production. Inhibition of
SGPP1 and SGPL1 was found to cause the accumulation of S1P in
cancer cells, promote the invasion of gastric cancer cells
(38), and reduce the overall
survival of patients (39). Thus, the
increasing level of SGPL1 and SGPP1 induced by ZY0511 would benefit
cancer therapy.
Next, we explored whether there is a correlation
between the expression of metabolic enzymes and LSD1 in tumor
patients. The TCGA database was applied to perform the analysis.
The results showed that although expression of many proteins were
changed after exposure to LSD1 inhibitors, only the expression of
SMPD1 and SMPD3 were negatively correlated with LSD1 in tumor
samples of patients (Fig. 7) and
SMPD1 and SMPD3 may be direct targets of LSD1 in cancer. The
induction of other enzymes such as SPTLC1, SPTLC3, CERS2, CERS4,
DEGS1, DEGS2, SGPP1 by ZY0511 may not be due to the direct effects
of LSD1 inhibition.
Collectively, the cellular Cer production can be
induced by LSD1 inhibition. LSD1 may regulate cancer cell survival
through modulating the expression of SMPD1 and SMPD3.
Discussion
Although targeting lysine specific demethylase 1
(LSD1) is a promising strategy for cancer therapy, its underlying
mechanism is still poorly understood. In the present study, we
performed a thorough lipidomic analysis of human cancer cells by
using ZY0511, a novel LSD1 inhibitor as a probe, which aimed at a
better understanding of the anticancer mechanism of LSD1
inhibitors. We demonstrated that ZY0511 profoundly modified the
cancer cell lipidome, especially sphingolipid (SP) metabolism. The
increase in Cer and decrease in SM were significantly observed and
Cer synthase pathways including de novo synthesis,
hydrolysis of SM and the salvage pathway were activated by ZY0511
treatment. These findings were of particular interest which
provided a link between LSD1 and cancer cell lipid metabolism
especially SP metabolism (Fig. 8).
Based on the finding that lipid remodeling is an important
alteration in cancer cells, our findings provide a novel view
underlying LSD1 regulation of cancer progression.
The incidence and development of tumor is a complex
disease process which is affected by many factors, including
genetic factors and environmental factors. Cancer cells grow
rapidly, divide uncontrollably, and even metastasize from one organ
to another. Tumor cells receive various signal stimulation, which
is then transmitted to the cell and the nucleus, activating the
expression of tumor-related genes, promoting tumor invasion to
surrounding tissues and intravascular regeneration. The cell
membrane is involved in all these biological processes and is
mainly composed of lipids and proteins, among which lipids occupy
more than 50% of the whole cell membrane component (40). In addition, lipids are highly needed
to supply energy for the rapid proliferation of tumor cells
(41). Lipids such as Cer and SM, are
bioactive and act as signal molecules or signal molecule precursors
to regulate a variety of cellular functions and biological
processes. For example, in the condition of chemotherapy or
oxidative stress, the content of Cer and sphingosine increases
sharply, inducing cell senescence and even death. Cer was found to
induce apoptosis in tumor cells as early as 1993, and is involved
in the induction of mitochondrial apoptosis through mitochondrial
outer membrane permeabilization which is a possible mechanism for
radiation-induced apoptosis (42). In
our research, ZY0511 was used as an antitumor small molecule which
promoted the accumulation of Cer in tumor cells and induced cell
apoptosis as previously reported (43). Meanwhile, various research has
indicated that the antitumor effect of LSD1 inhibitors relies on
its apoptosis induction ability which furthermore verified the
relation between LSD1 and apoptosis (44,45). LSD1
inhibitor JL1037 was found to upregulate pro-apoptotic protein BAX
and downregulate anti-apoptotic proteins Bcl-2 and Bcl-XL which
cause obvious apoptosis of cancer cells (42). Our research hints that LSD1 may
regulate cell apoptosis through modulating the expression of
sphingolipid metabolism genes and there is no research that has
previously reported the association between LSD1 and sphingolipid
metabolism. Our results provided a novel view of the role of LSD1
in cancer progression and lays the theoretical foundation for LSD1
inhibitor application in the clinic.
In present study, levels of Cer were increased upon
the treatment of LSD1 inhibitor. Gutierrez et al showed that
Cer induces early apoptosis of human cervical cancer cells by
inhibiting reactive oxygen species (ROS) decay, diminishing the
intracellular concentration of glutathione and increasing nuclear
factor (NF)-κB translocation (46).
Cer was also found to contribute to the cellular resistance to
doxorubicin including breast, ovary, cervical, and colon cancer
cells through upregulation of the gene expression of GCS (47). In colon cancer cells, Cer enhanced
FasL-induced cytotoxicity by tumor-specific cytotoxic T lymphocytes
(48). With the increase in Cer, we
also found a decrease in SM in cells by ZY0511. SM was found to be
a chemo-preventive agent in azoxymethane (AOM)-induced colon cancer
model of wild-type and p53+/− mice (49). However, SM may play a different role
in hypoxic conditions. Klutzny et al found that the
inhibition of acid sphingomyelinase in colon cancer caused cellular
SM accumulation, which induced cancer cell death specifically in
hypoxic tumor spheroids (50).
Because of the critical role of Cer in biological
process including cell growth, cancer metastasis and apoptosis, a
large number of research studies have focused on the exploration of
the role of Cer synthase enzymes in cancer. It has been reported
that anticancer drugs can upregulate the activity of SMPD1 which
catalyzes the production of Cer from SM and promotes cancer cell
apoptosis (51). However,
SMPD1 deficiency was found to reduce tumor development in a
manner associated with significant enhancement of Th1-mediated and
cytotoxic T-cell-mediated antitumor immunity (52) which suggests the dual role of SMPD1 in
different types of tumors. As a Cer-generating enzyme, SMPD3 is
implicated in growth arrest, apoptosis and exosome secretion and
its deficiency prevents doxorubicin-induced growth arrest (53). In addition, possibly owing to reduced
Cer generation, ENPP7 deficiency resulted in increased tumor
size and number in mouse models of colon cancer induced by AOM and
dextran sulfate sodium (54). In the
present study, we demonstrated the upregulation of SMPD1, SMPD2,
SMPD3, SMPD4 and ENPP7 after the treatment of ZY0511, most of which
act as a tumor suppressor catalyzing the generation of Cer. Most
important, we performed gene expression analysis of these genes and
LSD1, which showed that SMPD1 and SMPD3 may be
direct targets of LSD1 as there was a significant negative
correlation between these genes and LSD1. Our research for
the first time confirmed the regulatory role of LSD1 in the
expression of SM hydrolysis genes. We explored the potential
upstream regulatory mechanism of SM hydrolysis genes including
SMPD1 and SMPD3. As SMPD1 and SMPD3 are
tumor-suppressor genes, our research provides a novel strategy by
which to regulate the SM hydrolysis process through an LSD1
inhibitor. However, the lack of immunoblotting data for the key
enzymes including SPTLC1, SPTLC3, CERS2, CERS4, CERS5, CERS6,
DEGS1, DEGS2, SMPD1, SMPD2, SMPD3, SMPD4, ENPP7, SGPP1 and SGPL1,
is a limitation of the present study which requires further
exploration.
Cancer metabolism and epigenetics can be a cause or
consequence of malignant transformation. It is now well established
that cell lipid metabolism and epigenetics interact with each
other, and cells exploit this molecular link (55). JMJD3 was identified unexpectedly as a
gene-specific transcriptional partner of SIRT1 and activates
mitochondrial fatty acid β-oxidation promoting genes, including
FGF21, CPT1A and MCAD (56), which suggests the close link between
histone demethylation and cell metabolism. Loss of KDM4B may
impair energy expenditure, adaptive thermogenesis, and adipose
tissue lipolysis, resulting in obesity and associated metabolic
dysfunction (57). When
lysine-specific histone demethylase 2 (LSD2) is lost, proper
expression of lipid metabolism genes becomes compromised, leading
to an increased susceptibility to toxic cell damage in response to
fatty acid exposure (58). As a
homologous gene of LSD2, LSD1 ablation was found to trigger
metabolic reprogramming of brown adipose tissue resulting in the
accumulation of di- and triacylglycerides (59). In our research, we also found the
upregulation of diacylglycerides and triacylglycerides in cancer
cells especially HeLa cells after LSD1 inhibition by ZY0511 which
is in agreement with a previous study (59). Since the pathway analysis results
indicated that the most significantly altered pathway was
sphingolipid metabolism, we further investigated the expression of
sphingolipid metabolic genes after ZY0511 treatment. The importance
of glycerolipids such as di- and triacylglycerides in the process
of regulating cancer progression by LSD1 requires further
exploration.
In conclusion, we investigated the anticancer
mechanism of LSD1 inhibitor ZY0511 from the view of lipid
metabolism. The lipidome of cancer cells were significantly
modified by ZY0511. We found obvious upregulation of Cer and
downregulation of SM in cancer cells. Our study further confirms
the important role of LSD1 in regulating cancer cell sphingolipid
metabolism.
Acknowledgements
Not applicable.
Funding
This work was supported by Project of the National
Natural Sciences Foundation of China (81773198), National Keypoint
Research and Invention Program of the China Ministry of Science and
Technology (MOST-2016YFC1303200), National S&T Major project
(2018ZX09201018), Science and Technology Innovation Program of
Shanxi Provincial Education Department (2020L0177) and Funding for
Doctoral Research of Shanxi Province (3C322019039).
Availability of data and materials
The datasets analyzed during the current study are
available in the Mendeley Data repository, https://data.mendeley.com/datasets/vjm2z4vd9j/1.
Authors' contributions
YZ an XC conceived the concept of the study. YLi,
XQ, LT, YLin, SY and HZ performed the experiments. ZZ synthesized
compound ZY0511. YLi wrote the paper and conducted all of the
experiments. All authors read and approved the manuscript and agree
to be accountable for all aspects of the research in ensuring that
the accuracy or integrity of any part of the work are appropriately
investigated and resolved.
Ethics approval and consent to
participate
Not applicable.
Patient consent for publication
Not applicable.
Competing interests
The authors state that they have no competing
interests.
Glossary
Abbreviations
Abbreviations:
|
LSD1
|
lysine specific demethylase 1
|
|
AML
|
acute myeloid leukemia
|
|
S1P
|
sphingosine-1-phosphate
|
|
GCS
|
glucosylceramide synthase
|
|
CERK
|
ceramide kinase
|
|
AC
|
acid ceramidase
|
|
SPHK
|
sphingosine kinase
|
|
UPLC/Q-TOF-MS
|
ultra-performance liquid
chromatography-quadrupole time of flight mass spectrometry
|
|
PCA
|
principal component analysis
|
|
OPLS-DA
|
supervised orthogonal partial least
squares discriminant analysis
|
|
VIP
|
variable importance
|
|
GL
|
glycerophospholipid
|
|
SP
|
sphingolipid
|
|
PS
|
phosphatidylserine
|
|
PC
|
phosphatidylcholine
|
|
PE
|
phosphatidylethanolamine
|
|
PI
|
phosphatidylinositol
|
|
PA
|
phosphatidic acid
|
|
PG
|
phosphatidylglycerol
|
|
Cer
|
ceramide
|
|
GluCer
|
glucosylceramide
|
|
LacCer
|
lactosylceramide
|
|
CerP
|
ceramide phosphate
|
|
SM
|
sphingomyelin
|
|
SPTL
|
serine palmitoyltransferase
|
|
CERS
|
ceramide synthase
|
|
DEGS
|
dihydroceramide desaturases
|
|
SGPP1
|
sphingosine-1-phosphate phosphatase
1
|
|
SGPL1
|
sphingosine-1-phosphate lyase 1
|
References
|
1
|
Shi Y, Lan F, Matson C, Mulligan P,
Whetstine JR, Cole PA, Casero RA and Shi Y: Histone demethylation
mediated by the nuclear amine oxidase homolog LSD1. Cell.
119:941–953. 2004. View Article : Google Scholar : PubMed/NCBI
|
|
2
|
Metzger E, Wissmann M, Yin N, Müller JM,
Schneider R, Peters AH, Günther T, Buettner R and Schüle R: LSD1
demethylates repressive histone marks to promote
androgen-receptor-dependent transcription. Nature. 437:436–439.
2005. View Article : Google Scholar : PubMed/NCBI
|
|
3
|
Cai C, He HH, Chen S, Coleman I, Wang H,
Fang Z, Chen S, Nelson PS, Liu XS, Brown M and Balk SP: Androgen
receptor gene expression in prostate cancer is directly suppressed
by the androgen receptor through recruitment of lysine-specific
demethylase 1. Cancer Cell. 20:457–471. 2011. View Article : Google Scholar : PubMed/NCBI
|
|
4
|
Sehrawat A, Gao L, Wang Y, Bankhead A III,
McWeeney SK, King CJ, Schwartzman J, Urrutia J, Bisson WH, Coleman
DJ, et al: LSD1 activates a lethal prostate cancer gene network
independently of its demethylase function. Proc Natl Acad Sci USA.
115:E4179–E4188. 2018. View Article : Google Scholar : PubMed/NCBI
|
|
5
|
Shao G, Wan X, Lai W, Wu C, Jin J, Liu X,
Wei Y, Lin Q, Zhang L and Shao Q: Inhibition of lysine-specific
demethylase 1 prevents proliferation and mediates cisplatin
sensitivity in ovarian cancer cells. Oncol Lett. 15:9025–9032.
2018.PubMed/NCBI
|
|
6
|
Wang Y, Zhang H, Chen Y, Sun Y, Yang F, Yu
W, Liang J, Sun L, Yang X, Shi L, et al: LSD1 is a subunit of the
NuRD complex and targets the metastasis programs in breast cancer.
Cell. 138:660–672. 2009. View Article : Google Scholar : PubMed/NCBI
|
|
7
|
Hoshino I, Takahashi M, Akutsu Y, Murakami
K, Matsumoto Y, Suito H, Sekino N, Komatsu A, Iida K, Suzuki T, et
al: Genome-wide ChIP-seq data with a transcriptome analysis reveals
the groups of genes regulated by histone demethylase LSD1
inhibition in esophageal squamous cell carcinoma cells. Oncol Lett.
18:872–881. 2019.PubMed/NCBI
|
|
8
|
Ding J, Zhang ZM, Xia Y, Liao GQ, Pan Y,
Liu S, Zhang Y and Yan ZS: LSD1-mediated epigenetic modification
contributes to proliferation and metastasis of colon cancer. Br J
Cancer. 109:994–1003. 2013. View Article : Google Scholar : PubMed/NCBI
|
|
9
|
Schenk T, Chen WC, Gollner S, Göllner S,
Howell L, Jin L, Hebestreit K, Klein HU, Popescu AC, Burnett A, et
al: Inhibition of the LSD1 (KDM1A) demethylase reactivates the
all-trans-retinoic acid differentiation pathway in acute myeloid
leukemia. Nat Med. 18:605–611. 2012. View Article : Google Scholar : PubMed/NCBI
|
|
10
|
Mohammad HP, Smitheman KN, Kamat CD, Soong
D, Federowicz KE, Van Aller GS, Schneck JL, Carson JD, Liu Y,
Butticello M, et al: A DNA hypomethylation signature predicts
antitumor activity of LSD1 inhibitors in SCLC. Cancer Cell.
28:57–69. 2015. View Article : Google Scholar : PubMed/NCBI
|
|
11
|
Harris WJ, Huang X, Lynch JT, Spencer GJ,
Hitchin JR, Li Y, Ciceri F, Blaser JG, Greystoke BF, Jordan AM, et
al: The histone demethylase KDM1A sustains the oncogenic potential
of MLL-AF9 leukemia stem cells. Cancer Cell. 21:473–487. 2012.
View Article : Google Scholar : PubMed/NCBI
|
|
12
|
Lim S, Janzer A, Becker A, Zimmer A,
Schüle R, Buettner R and Kirfel J: Lysine-specific demethylase 1
(LSD1) is highly expressed in ER-negative breast cancers and a
biomarker predicting aggressive biology. Carcinogenesis.
31:512–520. 2010. View Article : Google Scholar : PubMed/NCBI
|
|
13
|
Shi YJ, Matson C, Lan F, Iwase S, Baba T
and Shi Y: Regulation of LSD1 histone demethylase activity by its
associated factors. Mol Cell. 19:857–864. 2005. View Article : Google Scholar : PubMed/NCBI
|
|
14
|
Lee MG, Wynder C, Cooch N and Shiekhattar
R: An essential role for CoREST in nucleosomal histone 3 lysine 4
demethylation. Nature. 437:432–435. 2005. View Article : Google Scholar : PubMed/NCBI
|
|
15
|
Ketscher A, Jilg CA, Willmann D, Hummel B,
Imhof A, Rüsseler V, Hölz S, Metzger E, Müller JM and Schüle R:
LSD1 controls metastasis of androgen-independent prostate cancer
cells through PXN and LPAR6. Oncogenesis. 3:e1202014. View Article : Google Scholar : PubMed/NCBI
|
|
16
|
Liscovitch M and Cantley LC: Lipid second
messengers. Cell. 77:329–334. 1994. View Article : Google Scholar : PubMed/NCBI
|
|
17
|
Rabinowitz JD and White E: Autophagy and
metabolism. Science. 330:1344–1348. 2010. View Article : Google Scholar : PubMed/NCBI
|
|
18
|
Huang C and Freter C: Lipid metabolism,
apoptosis and cancer therapy. Int J Mol Sci. 16:924–949. 2015.
View Article : Google Scholar : PubMed/NCBI
|
|
19
|
Hannun YA and Bell RM: Lysosphingolipids
inhibit protein kinase C: Implications for the sphingolipidoses.
Science. 235:670–674. 1987. View Article : Google Scholar : PubMed/NCBI
|
|
20
|
Dressler KA, Mathias S and Kolesnick RN:
Tumor necrosis factor-alpha activates the sphingomyelin signal
transduction pathway in a cell-free system. Science. 255:1715–1718.
1992. View Article : Google Scholar : PubMed/NCBI
|
|
21
|
Hannun YA and Obeid LM: Principles of
bioactive lipid signalling: Lessons from sphingolipids. Nat Rev Mol
Cell Biol. 9:139–150. 2008. View Article : Google Scholar : PubMed/NCBI
|
|
22
|
Ogretmen B and Hannun YA: Biologically
active sphingolipids in cancer pathogenesis and treatment. Nat Rev
Cancer. 4:604–616. 2004. View Article : Google Scholar : PubMed/NCBI
|
|
23
|
Cuvillier O, Pirianov G, Kleuser B, Vanek
PG, Coso OA, Gutkind S and Spiegel S: Suppression of
ceramide-mediated programmed cell death by sphingosine-1-phosphate.
Nature. 381:800–803. 1996. View Article : Google Scholar : PubMed/NCBI
|
|
24
|
Lee MJ, Van Brocklyn JR, Thangada S, Liu
CH, Hand AR, Menzeleev R, Spiegel S and Hla T:
Sphingosine-1-phosphate as a ligand for the G protein-coupled
receptor EDG-1. Science. 279:1552–1555. 1998. View Article : Google Scholar : PubMed/NCBI
|
|
25
|
Sakamoto A, Hino S, Nagaoka K, Anan K,
Takase R, Matsumori H, Ojima H, Kanai Y, Arita K and Nakao M:
Lysine demethylase LSD1 coordinates glycolytic and mitochondrial
metabolism in hepatocellular carcinoma cells. Cancer Res.
75:1445–1456. 2015. View Article : Google Scholar : PubMed/NCBI
|
|
26
|
Kosumi K, Baba Y, Sakamoto A, Ishimoto T,
Harada K, Nakamura K, Kurashige J, Hiyoshi Y, Iwatsuki M, Iwagami
S, et al: Lysine-specific demethylase-1 contributes to malignant
behavior by regulation of invasive activity and metabolic shift in
esophageal cancer. Int J Cancer. 138:428–439. 2016. View Article : Google Scholar : PubMed/NCBI
|
|
27
|
Wenk MR: Lipidomics: New tools and
applications. Cell. 143:888–895. 2010. View Article : Google Scholar : PubMed/NCBI
|
|
28
|
Zhou Y, Li Y, Wang WJ, Xiang P, Luo XM,
Yang L, Yang SY and Zhao YL: Synthesis and biological evaluation of
novel (E)-N′-(2,3-dihydro-1H-inden-1-ylidene) benzohydrazides as
potent LSD1 inhibitors. Bioorg Med Chem Lett. 26:4552–4557. 2016.
View Article : Google Scholar : PubMed/NCBI
|
|
29
|
Folch J, Lees M and Sloane Stanley GH: A
simple method for the isolation and purification of total lipides
from animal tissues. J Biol Chem. 226:497–509. 1957. View Article : Google Scholar : PubMed/NCBI
|
|
30
|
Livak KJ and Schmittgen TD: Analysis of
relative gene expression data using real-time quantitative PCR and
the 2(-Delta Delta C(T)) method. Methods. 25:402–408. 2001.
View Article : Google Scholar : PubMed/NCBI
|
|
31
|
Goldman MJ, Craft B, Hastie M, Repečka K,
McDade F, Kamath A, Banerjee A, Luo Y, Rogers D, Brooks AN, et al:
Visualizing and interpreting cancer genomics data via the Xena
platform. Nat Biotechnol. 38:675–678. 2020. View Article : Google Scholar : PubMed/NCBI
|
|
32
|
Li Y, Tao L, Zuo Z, Zhou Y, Qian X, Lin Y,
Jie H, Liu C, Li Z, Zhang H, et al: ZY0511, a novel, potent and
selective LSD1 inhibitor, exhibits anticancer activity against
solid tumors via the DDIT4/mTOR pathway. Cancer Lett. 454:179–190.
2019. View Article : Google Scholar : PubMed/NCBI
|
|
33
|
Birge RB, Boeltz S, Kumar S, Carlson J,
Wanderley J, Calianese D, Barcinski M, Brekken RA, Huang X,
Hutchins JT, et al: Phosphatidylserine is a global
immunosuppressive signal in efferocytosis, infectious disease, and
cancer. Cell Death Differ. 23:962–978. 2016. View Article : Google Scholar : PubMed/NCBI
|
|
34
|
Iorio E, Ricci A, Bagnoli M, Pisanu ME,
Castellano G, Di Vito M, Venturini E, Glunde K, Bhujwalla ZM,
Mezzanzanica D, et al: Activation of phosphatidylcholine cycle
enzymes in human epithelial ovarian cancer cells. Cancer Res.
70:2126–2135. 2010. View Article : Google Scholar : PubMed/NCBI
|
|
35
|
Dolce V, Cappello AR, Lappano R and
Maggiolini M: Glycerophospholipid synthesis as a novel drug target
against cancer. Curr Mol Pharmacol. 4:167–175. 2011. View Article : Google Scholar : PubMed/NCBI
|
|
36
|
Obeid LM, Linardic CM, Karolak LA and
Hannun YA: Programmed cell death induced by ceramide. Science.
259:1769–1771. 1993. View Article : Google Scholar : PubMed/NCBI
|
|
37
|
Siskind LJ, Feinstein L, Yu T, Davis JS,
Jones D, Choi J, Zuckerman JE, Tan W, Hill RB, Hardwick JM and
Colombini M: Anti-apoptotic Bcl-2 family proteins disassemble
ceramide channels. J Biol Chem. 283:6622–6630. 2008. View Article : Google Scholar : PubMed/NCBI
|
|
38
|
Oskouian B, Sooriyakumaran P, Borowsky AD,
Crans A, Dillard-Telm L, Tam YY, Bandhuvula P and Saba JD:
Sphingosine-1-phosphate lyase potentiates apoptosis via p53- and
p38-dependent pathways and is down-regulated in colon cancer. Proc
Natl Acad Sci USA. 103:17384–17389. 2006. View Article : Google Scholar : PubMed/NCBI
|
|
39
|
Gao XY, Li L, Wang XH, Wen XZ, Ji K, Ye L,
Cai J, Jiang WG and Ji JF: Inhibition of sphingosine-1-phosphate
phosphatase 1 promotes cancer cells migration in gastric cancer:
Clinical implications. Oncol Rep. 34:1977–1987. 2015. View Article : Google Scholar : PubMed/NCBI
|
|
40
|
Escriba PV, González-Ros JM, Goñi FM,
Kinnunen PK, Vigh L, Sánchez-Magraner L, Fernández AM, Busquets X,
Horváth I and Barceló-Coblijn G: Membranes: A meeting point for
lipids, proteins and therapies. J Cell Mol Med. 12:829–875. 2008.
View Article : Google Scholar : PubMed/NCBI
|
|
41
|
Prentki M and Madiraju SR: Glycerolipid
metabolism and signaling in health and disease. Endocr Rev.
29:647–676. 2008. View Article : Google Scholar : PubMed/NCBI
|
|
42
|
Chang KT, Anishkin A, Patwardhan GA,
Beverly LJ, Siskind LJ and Colombini M: Ceramide channels:
destabilization by Bcl-xL and role in apoptosis. Biochim Biophys
Acta. 1848:2374–2384. 2015. View Article : Google Scholar : PubMed/NCBI
|
|
43
|
Kolesnick R and Fuks Z: Radiation and
ceramide-induced apoptosis. Oncogene. 22:5897–5906. 2003.
View Article : Google Scholar : PubMed/NCBI
|
|
44
|
Haydn T, Metzger E, Schuele R and Fulda S:
Concomitant epigenetic targeting of LSD1 and HDAC synergistically
induces mitochondrial apoptosis in rhabdomyosarcoma cells. Cell
Death Dis. 8:e28792017. View Article : Google Scholar : PubMed/NCBI
|
|
45
|
Liu S, Lu W, Li S, Li S, Liu J, Xing Y,
Zhang S, Zhou JZ, Xing H, Xu Y, et al: Identification of JL1037 as
a novel, specific, reversible lysine-specific demethylase 1
inhibitor that induce apoptosis and autophagy of AML cells.
Oncotarget. 8:31901–31914. 2017. View Article : Google Scholar : PubMed/NCBI
|
|
46
|
Gutierrez G, Mendoza C, Montano LF and
Lopez-Marure R: Ceramide induces early and late apoptosis in human
papilloma virus+ cervical cancer cells by inhibiting reactive
oxygen species decay, diminishing the intracellular concentration
of glutathione and increasing nuclear factor-kappaB translocation.
Anticancer Drugs. 18:149–159. 2007. View Article : Google Scholar : PubMed/NCBI
|
|
47
|
Liu YY, Yu JY, Yin D, Patwardhan GA, Gupta
V, Hirabayashi Y, Holleran WM, Giuliano AE, Jazwinski SM,
Gouaze-Andersson V, et al: A role for ceramide in driving cancer
cell resistance to doxorubicin. FASEB J. 22:2541–2551. 2008.
View Article : Google Scholar : PubMed/NCBI
|
|
48
|
Coe GL, Redd PS, Paschall AV, Lu C, Gu L,
Cai H, Albers T, Lebedyeva IO and Liu K: Ceramide mediates
FasL-induced caspase 8 activation in colon carcinoma cells to
enhance FasL-induced cytotoxicity by tumor-specific cytotoxic T
lymphocytes. Sci Rep. 6:308162016. View Article : Google Scholar : PubMed/NCBI
|
|
49
|
Hu Y, Le Leu RK, Belobrajdic D and Young
GP: The potential of sphingomyelin as a chemopreventive agent in
AOM-induced colon cancer model: Wild-type and p53+/− mice. Mol Nutr
Food Res. 52:558–566. 2008. View Article : Google Scholar : PubMed/NCBI
|
|
50
|
Klutzny S, Lesche R, Keck M, Kaulfuss S,
Schlicker A, Christian S, Sperl C, Neuhaus R, Mowat J, Steckel M,
et al: Functional inhibition of acid sphingomyelinase by
Fluphenazine triggers hypoxia-specific tumor cell death. Cell Death
Dis. 8:e27092017. View Article : Google Scholar : PubMed/NCBI
|
|
51
|
Mizutani N, Omori Y, Kawamoto Y, Sobue S,
Ichihara M, Suzuki M, Kyogashima M, Nakamura M, Tamiya-Koizumi K,
Nozawa Y and Murate T: Resveratrol-induced transcriptional
up-regulation of ASMase (SMPD1) of human leukemia and cancer cells.
Biochem Biophys Res Commun. 470:851–856. 2016. View Article : Google Scholar : PubMed/NCBI
|
|
52
|
Kachler K, Bailer M, Heim L, Schumacher F,
Reichel M, Holzinger CD, Trump S, Mittler S, Monti J, Trufa DI, et
al: Enhanced acid sphingomyelinase activity drives immune evasion
and tumor growth in non-small cell lung carcinoma. Cancer Res.
77:5963–5976. 2017. View Article : Google Scholar : PubMed/NCBI
|
|
53
|
Shamseddine AA, Clarke CJ, Carroll B,
Airola MV, Mohammed S, Rella A, Obeid LM and Hannun YA:
P53-dependent upregulation of neutral sphingomyelinase-2: Role in
doxorubicin-induced growth arrest. Cell Death Dis. 6:e19472015.
View Article : Google Scholar : PubMed/NCBI
|
|
54
|
Chen Y, Zhang P, Xu SC, Yang L, Voss U,
Ekblad E, Wu Y, Min Y, Hertervig E, Nilsson Å and Duan RD: Enhanced
colonic tumorigenesis in alkaline sphingomyelinase (NPP7) knockout
mice. Mol Cancer Ther. 14:259–267. 2015. View Article : Google Scholar : PubMed/NCBI
|
|
55
|
Carrer A and Wellen KE: Metabolism and
epigenetics: A link cancer cells exploit. Curr Opin Biotechnol.
34:23–29. 2015. View Article : Google Scholar : PubMed/NCBI
|
|
56
|
Seok S, Kim YC, Byun S, Choi S, Xiao Z,
Iwamori N, Zhang Y, Wang C, Ma J, Ge K, et al: Fasting-induced
JMJD3 histone demethylase epigenetically activates mitochondrial
fatty acid β-oxidation. J Clin Invest. 128:3144–3159. 2018.
View Article : Google Scholar : PubMed/NCBI
|
|
57
|
Cheng Y, Yuan Q, Vergnes L, Rong X, Youn
JY, Li J, Yu Y, Liu W, Cai H, Lin JD, et al: KDM4B protects against
obesity and metabolic dysfunction. Proc Natl Acad Sci USA.
115:E5566–E5575. 2018. View Article : Google Scholar : PubMed/NCBI
|
|
58
|
Nagaoka K, Hino S, Sakamoto A, Anan K,
Takase R, Umehara T, Yokoyama S, Sasaki Y and Nakao M:
Lysine-specific demethylase 2 suppresses lipid influx and
metabolism in hepatic cells. Mol Cell Biol. 35:1068–1080. 2015.
View Article : Google Scholar : PubMed/NCBI
|
|
59
|
Duteil D, Tosic M, Lausecker F, Nenseth
HZ, Müller JM, Urban S, Willmann D, Petroll K, Messaddeq N,
Arrigoni L, et al: Lsd1 ablation triggers metabolic reprogramming
of brown adipose tissue. Cell Rep. 17:1008–1021. 2016. View Article : Google Scholar : PubMed/NCBI
|